A car is moving on a straight road. The velocity of the car varies with time as shown in the figure. Initially (at t=0), the car was at x=0, where, x is the position of the car at any time 't'.
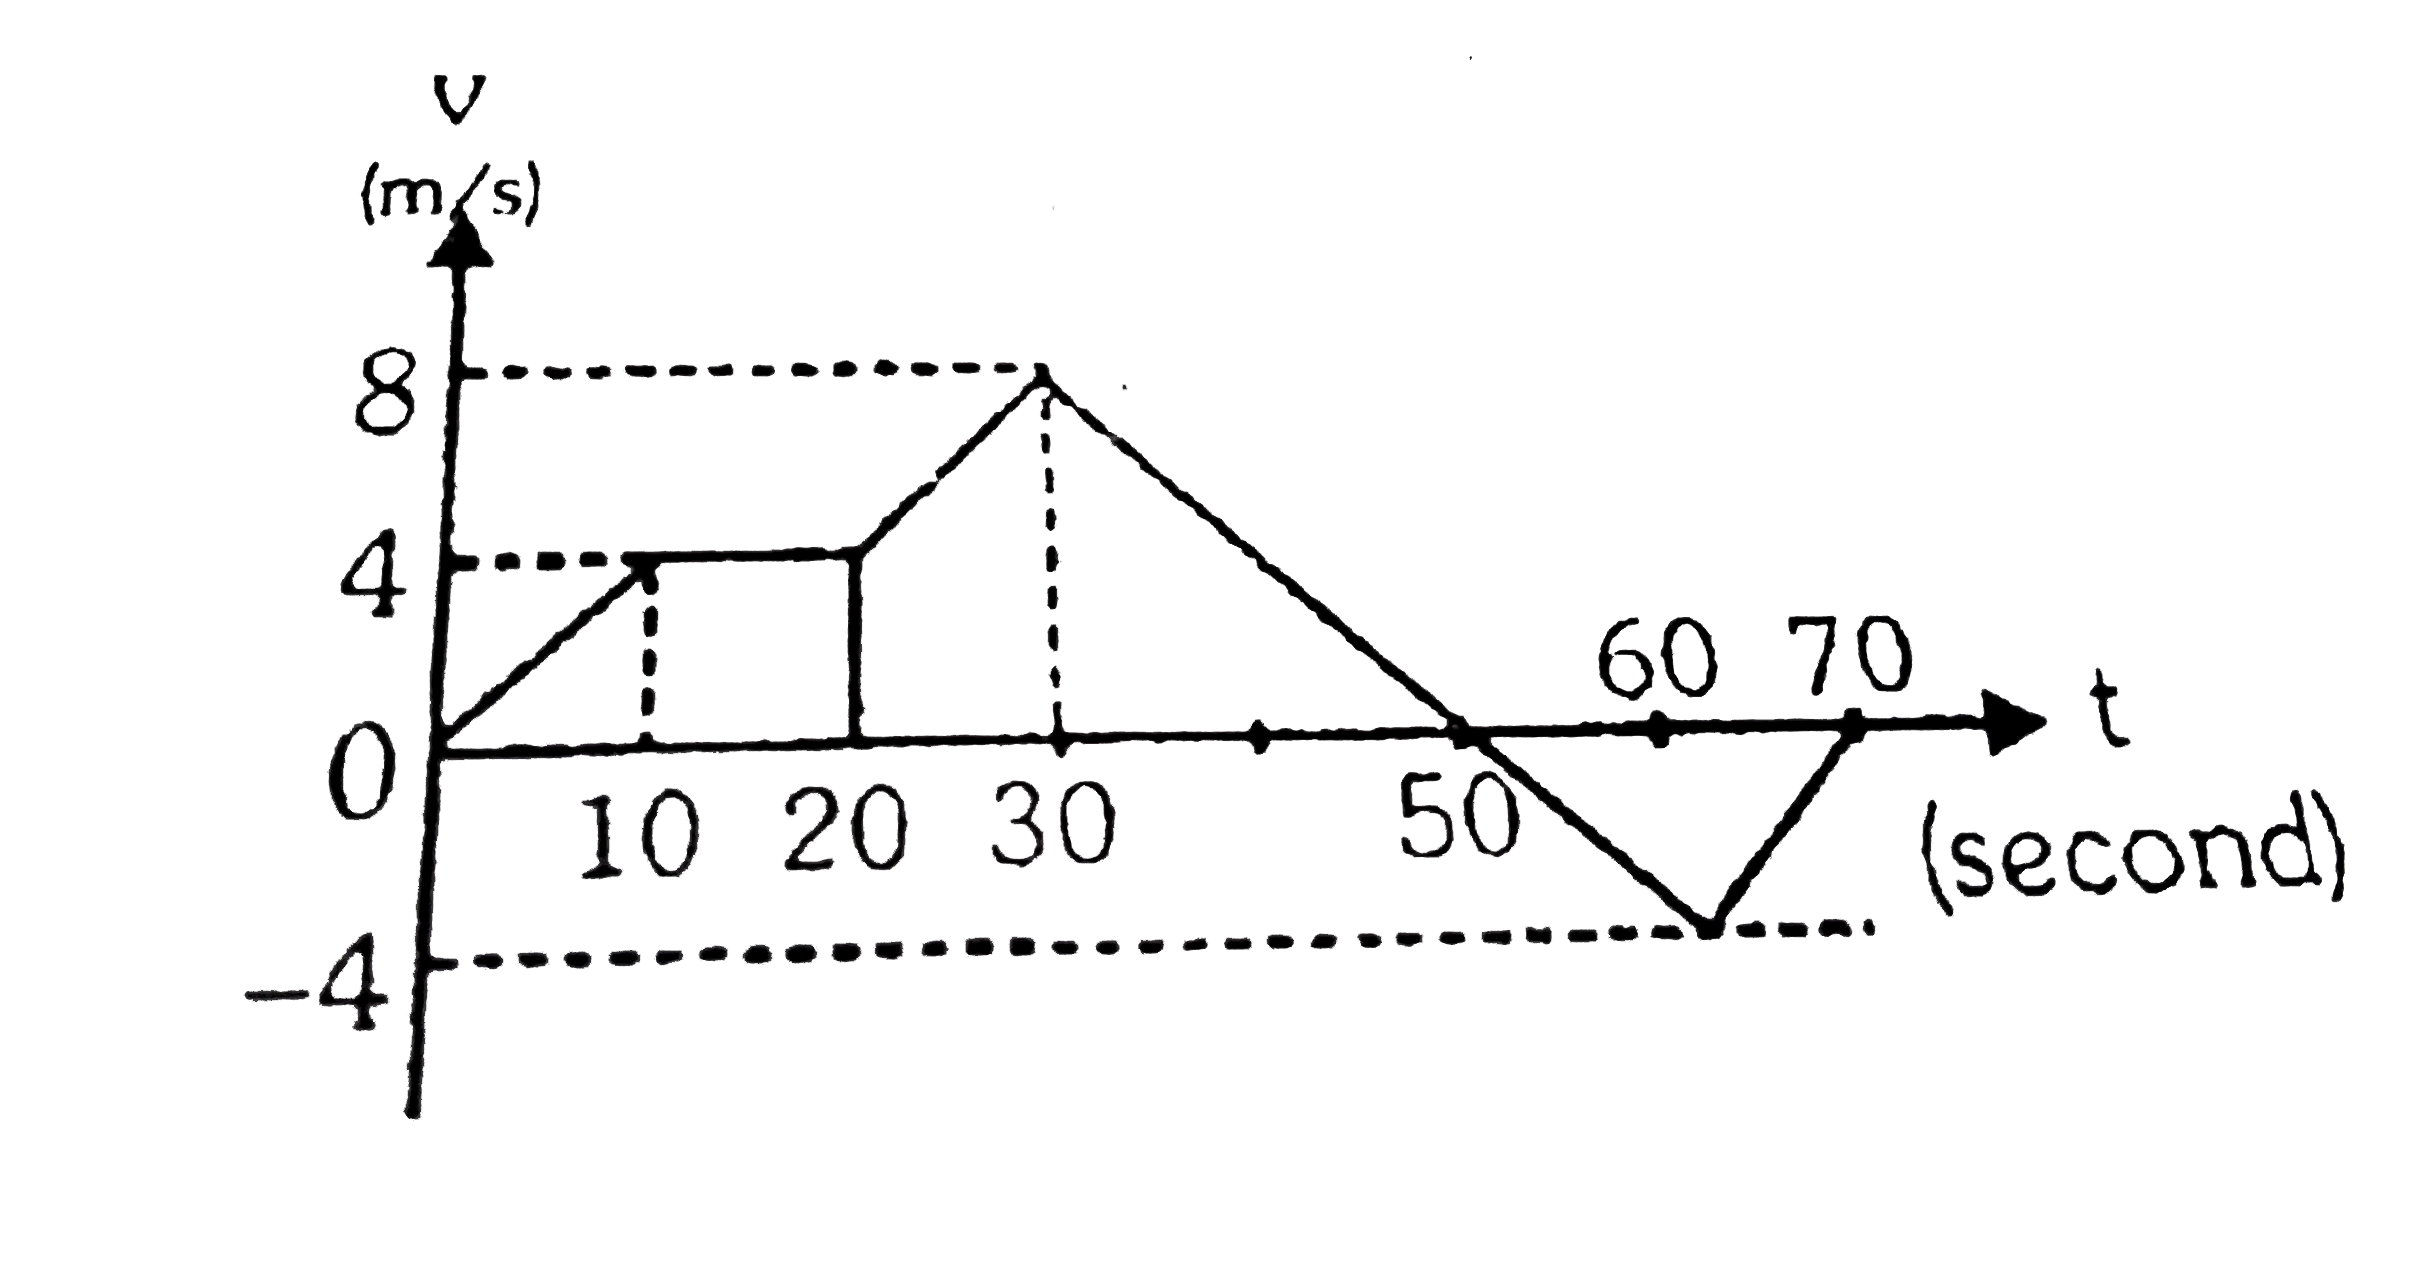
The time interval during which the car is retarding can be :-Solution in Gujrati
t=50s to t=70s
t=30s to t=50s
t=30s to t=60s
t=10s to t=20s
The correct Answer is:C
Time interval of retardation =30 to 70
Topper's Solved these Questions
- KINEMATICSBOOK - ALLEN CHAPTER - KINEMATICSEXERCISE - Comprehension#3
5 Videos
- KINEMATICSBOOK - ALLEN CHAPTER - KINEMATICSEXERCISE - Comprehension#4
3 Videos
- KINEMATICSBOOK - ALLEN CHAPTER - KINEMATICSEXERCISE - Comprehension#1
3 Videos
- ERROR AND MEASUREMENTBOOK - ALLEN CHAPTER - ERROR AND MEASUREMENTEXERCISE - Part-2(Exercise-2)(B)
22 Videos
- KINEMATICS (MOTION ALONG A STRAIGHT LINE AND MOTION IN A PLANE)BOOK - ALLEN CHAPTER - KINEMATICS (MOTION ALONG A STRAIGHT LINE AND MOTION IN A PLANE)EXERCISE - BEGINNER S BOX-7
8 Videos
Similar Questions
The trajectory of a projectile in a vertical plane is y=√3x−2x2. [g=10m/s2]
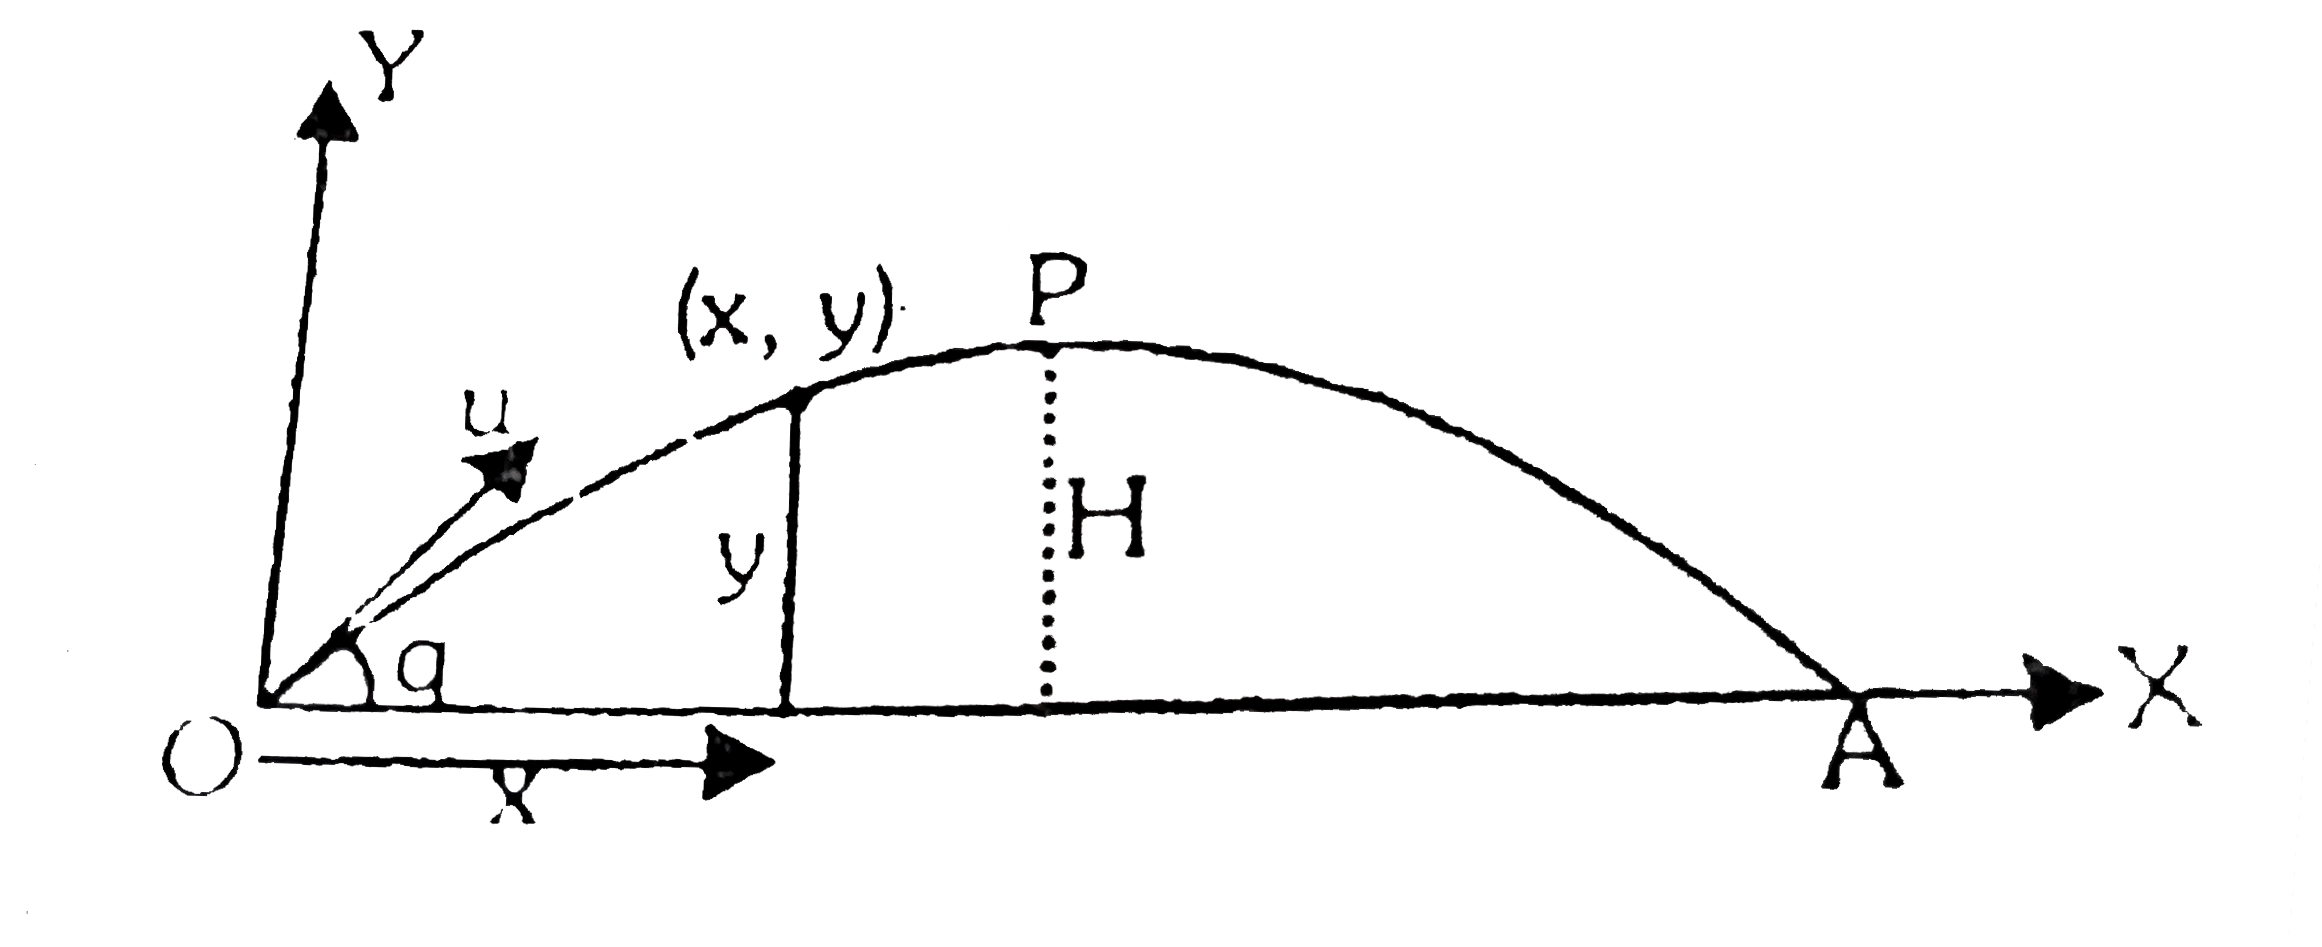
Angle of projection θ is :-
View SolutionA student performs an experiment to determine how the range of a ball depends on the velocity with which it is projected. The "range" is the distance between the points where the ball lends and from where it was projected, assuming it lands at the same height from which it was projected. It each trial, the student uses the same baseball, and launches it at the same angle. Table shows the experimental results.
∣∣ ∣ ∣ ∣ ∣ ∣∣TrailLaunch speed(m/s)Range(m)110822031.833070.7440122.5∣∣ ∣ ∣ ∣ ∣ ∣∣
Based on this data, the student then hypothesizes that the range, R, depends on the initial speed v0 according to the following equation : R=Cvn0, where C is a constant and n is another constant.
Based on this data, the best guess for the value of n is :-
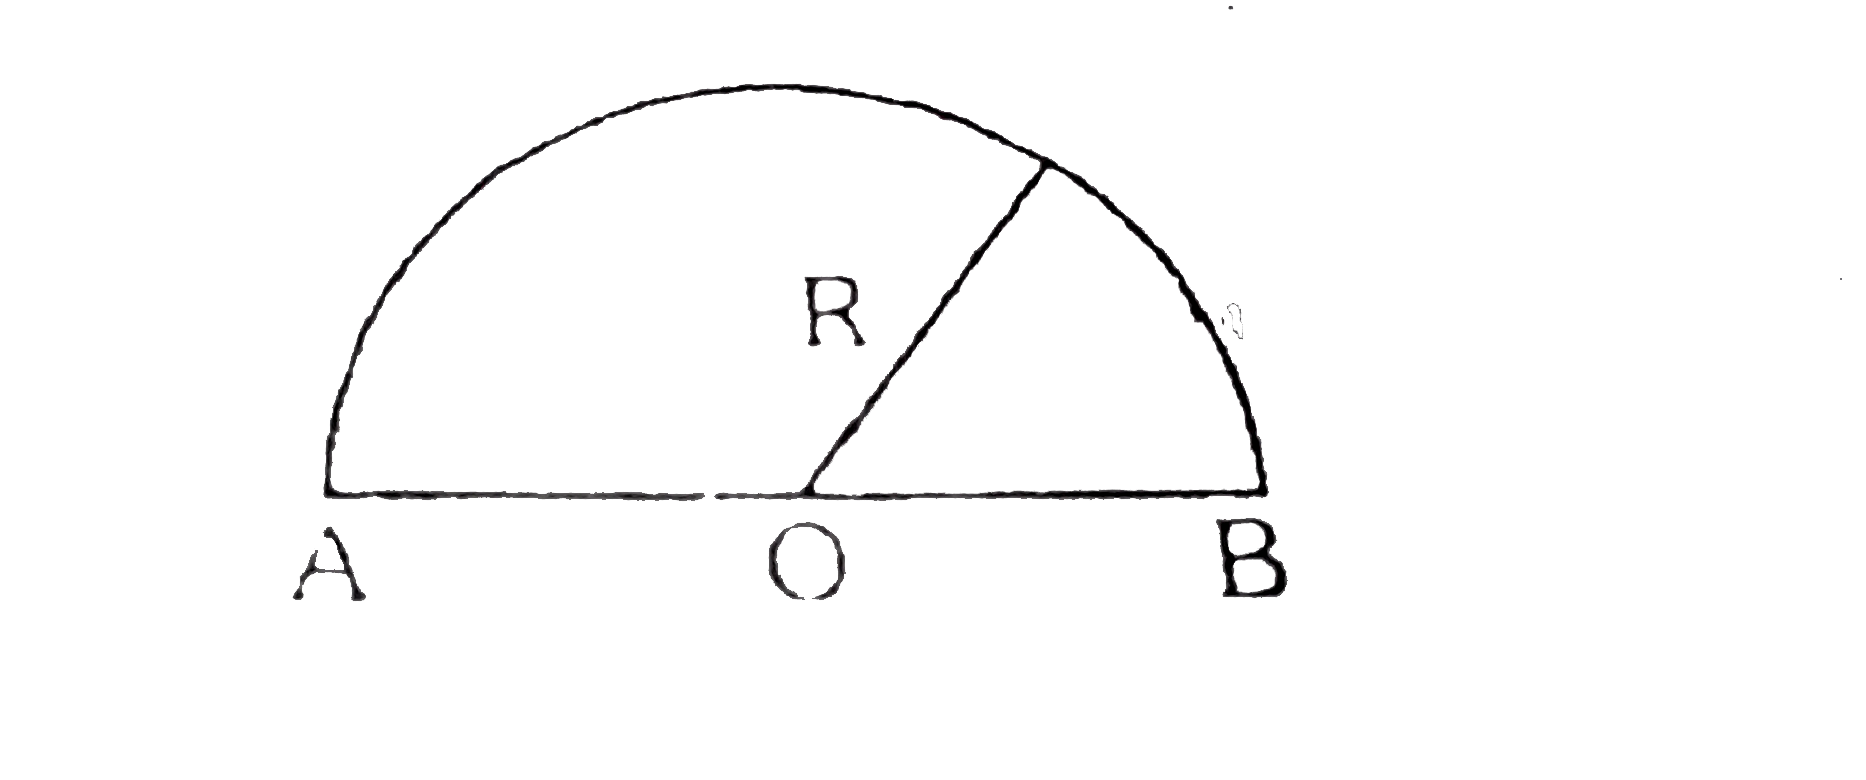
View SolutionDistance is a scalar quantity. Displacement is a vector quqntity. The magnitude of displacement is always less than or equal to distance. For a moving body displacement can be zero but distance cannot be zero. Same concept is applicable regarding velocity and speed. Acceleration is the rate of change of velocity. If acceleration is constant, then equations of kinematics are applicable for one dimensional motion under the gravity in which air resistance is considered, then the value of acceleration depends on the density of medium. Each motion is measured with respect of frame of reference. Relative velocity may be greater/ smaller to the individual velocities.
A particle moves from A to B. Then the ratio of distance to displacement is :-
View SolutionA cube has a side of length 1.2×10⁻²m. Calculate its volume.
View SolutionA football player kicks a ball at an angle of 30∘ with an initial speed of 20 m/s. Assuming that the ball travels in a vertical plane, calculate (a) the time at which the ball reaches the highest point (b) the maximum height reached (c) the horizontal range of the ball (d) the time for which the ball is in the air, (g=10m/s2)
View SolutionInitially car A is 10.5 m ahead of car B . Both start moving at time t = 0 in the same direction along a straight line. The velocity-time graph of two cars is shown in figure. The time when the car B will catch the car A , will be.
View SolutionThe velocity-time graph of a car moving along a straight road is shown in figure. The average velocity of the car is first 25 seconds is
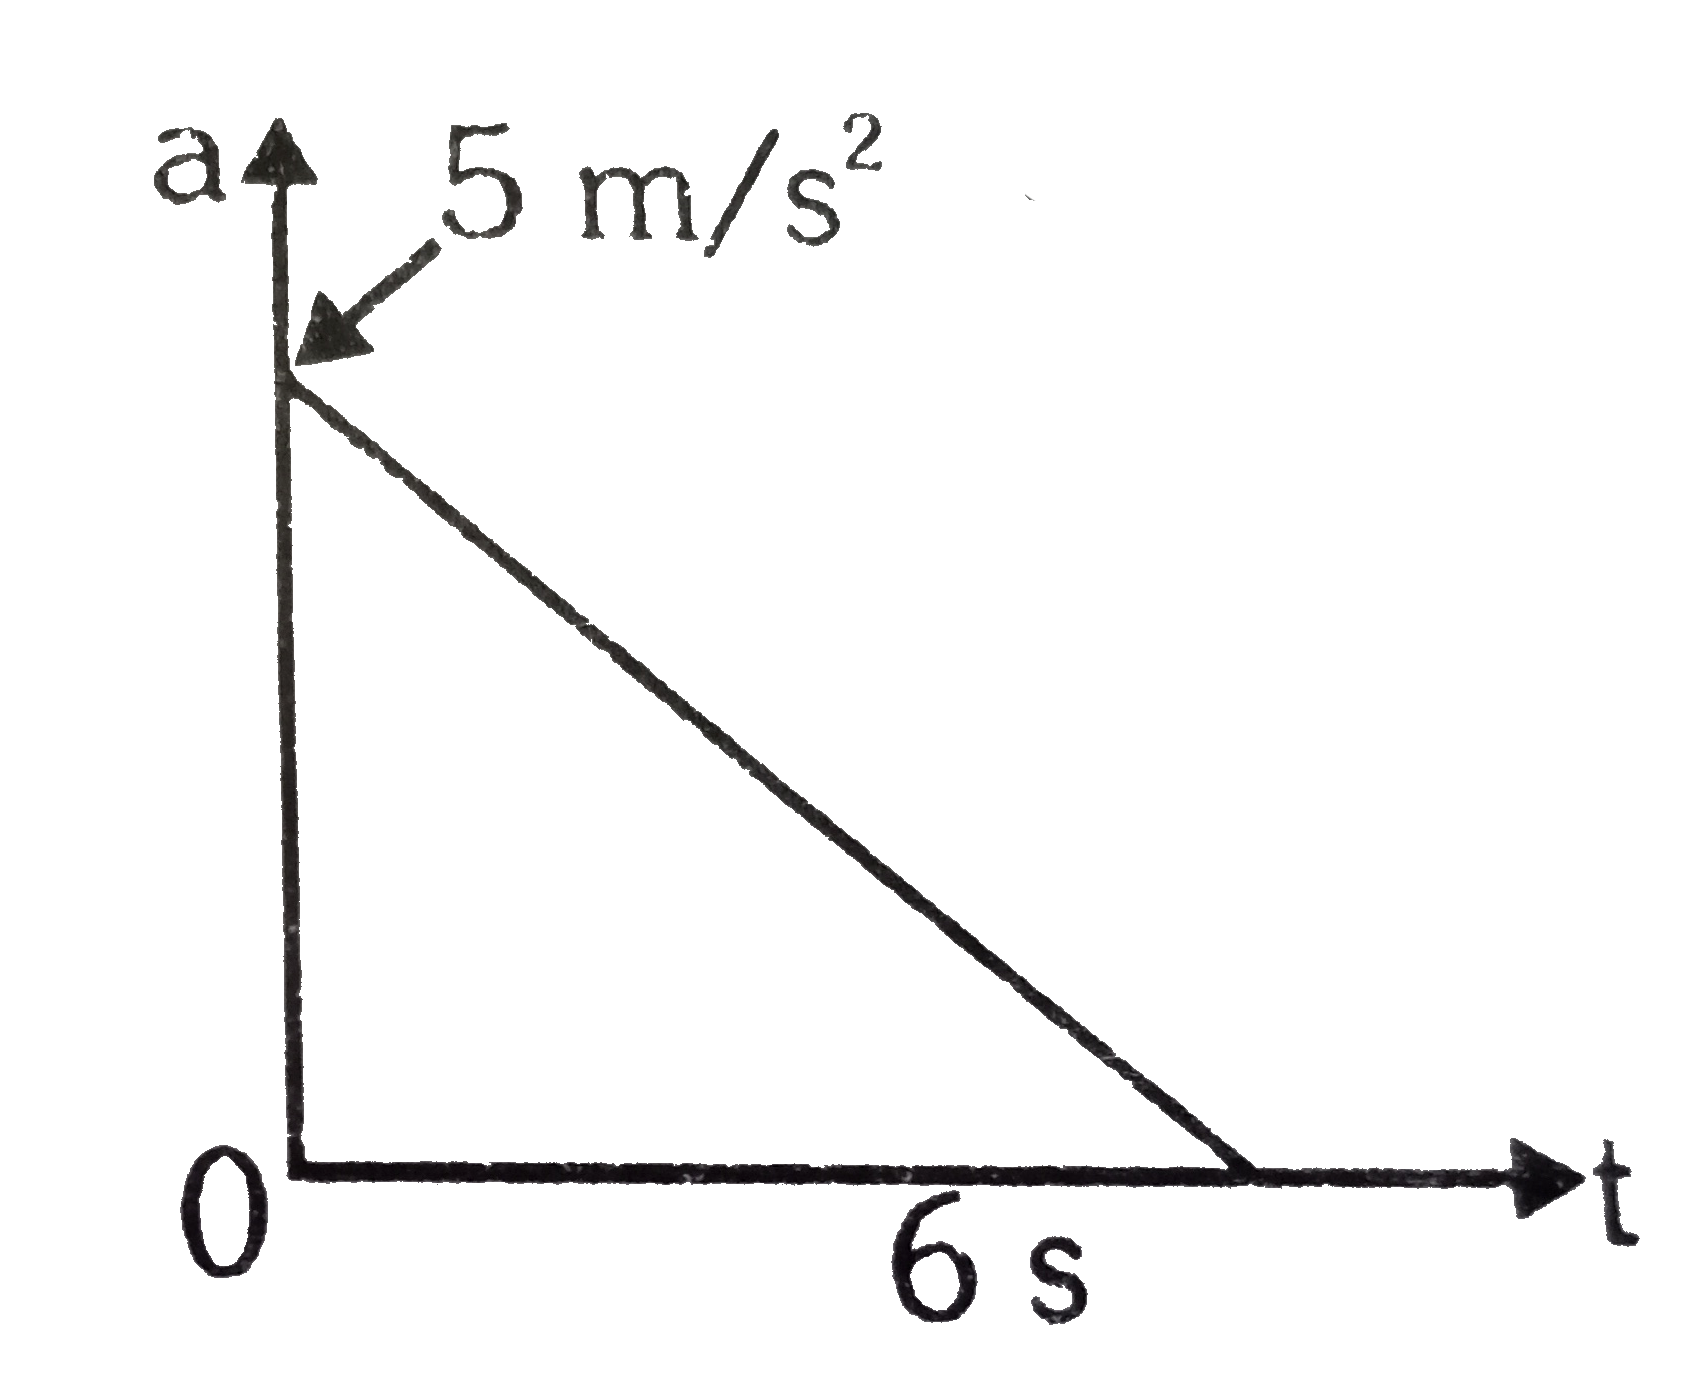
View SolutionA car is moving on a straight road. The velocity of the car varies with time as shown in the figure. Initially (at t=0), the car was at x=0 , where, x is the position of the car at any time 't'. The variation of acceleration (a) with time (t) will be best represented by :-
View SolutionA car is moving on a straight road. The velocity of the car varies with time as shown in the figure. Initially (at t=0), the car was at x=0 , where, x is the position of the car at any time 't'. The displacement time graph will be best represented by :-
View SolutionA car is moving on a straight road. The velocity of the car varies with time as shown in the figure. Initially (at t=0), the car was at x=0, where, x is the position of the car at any time 't'.
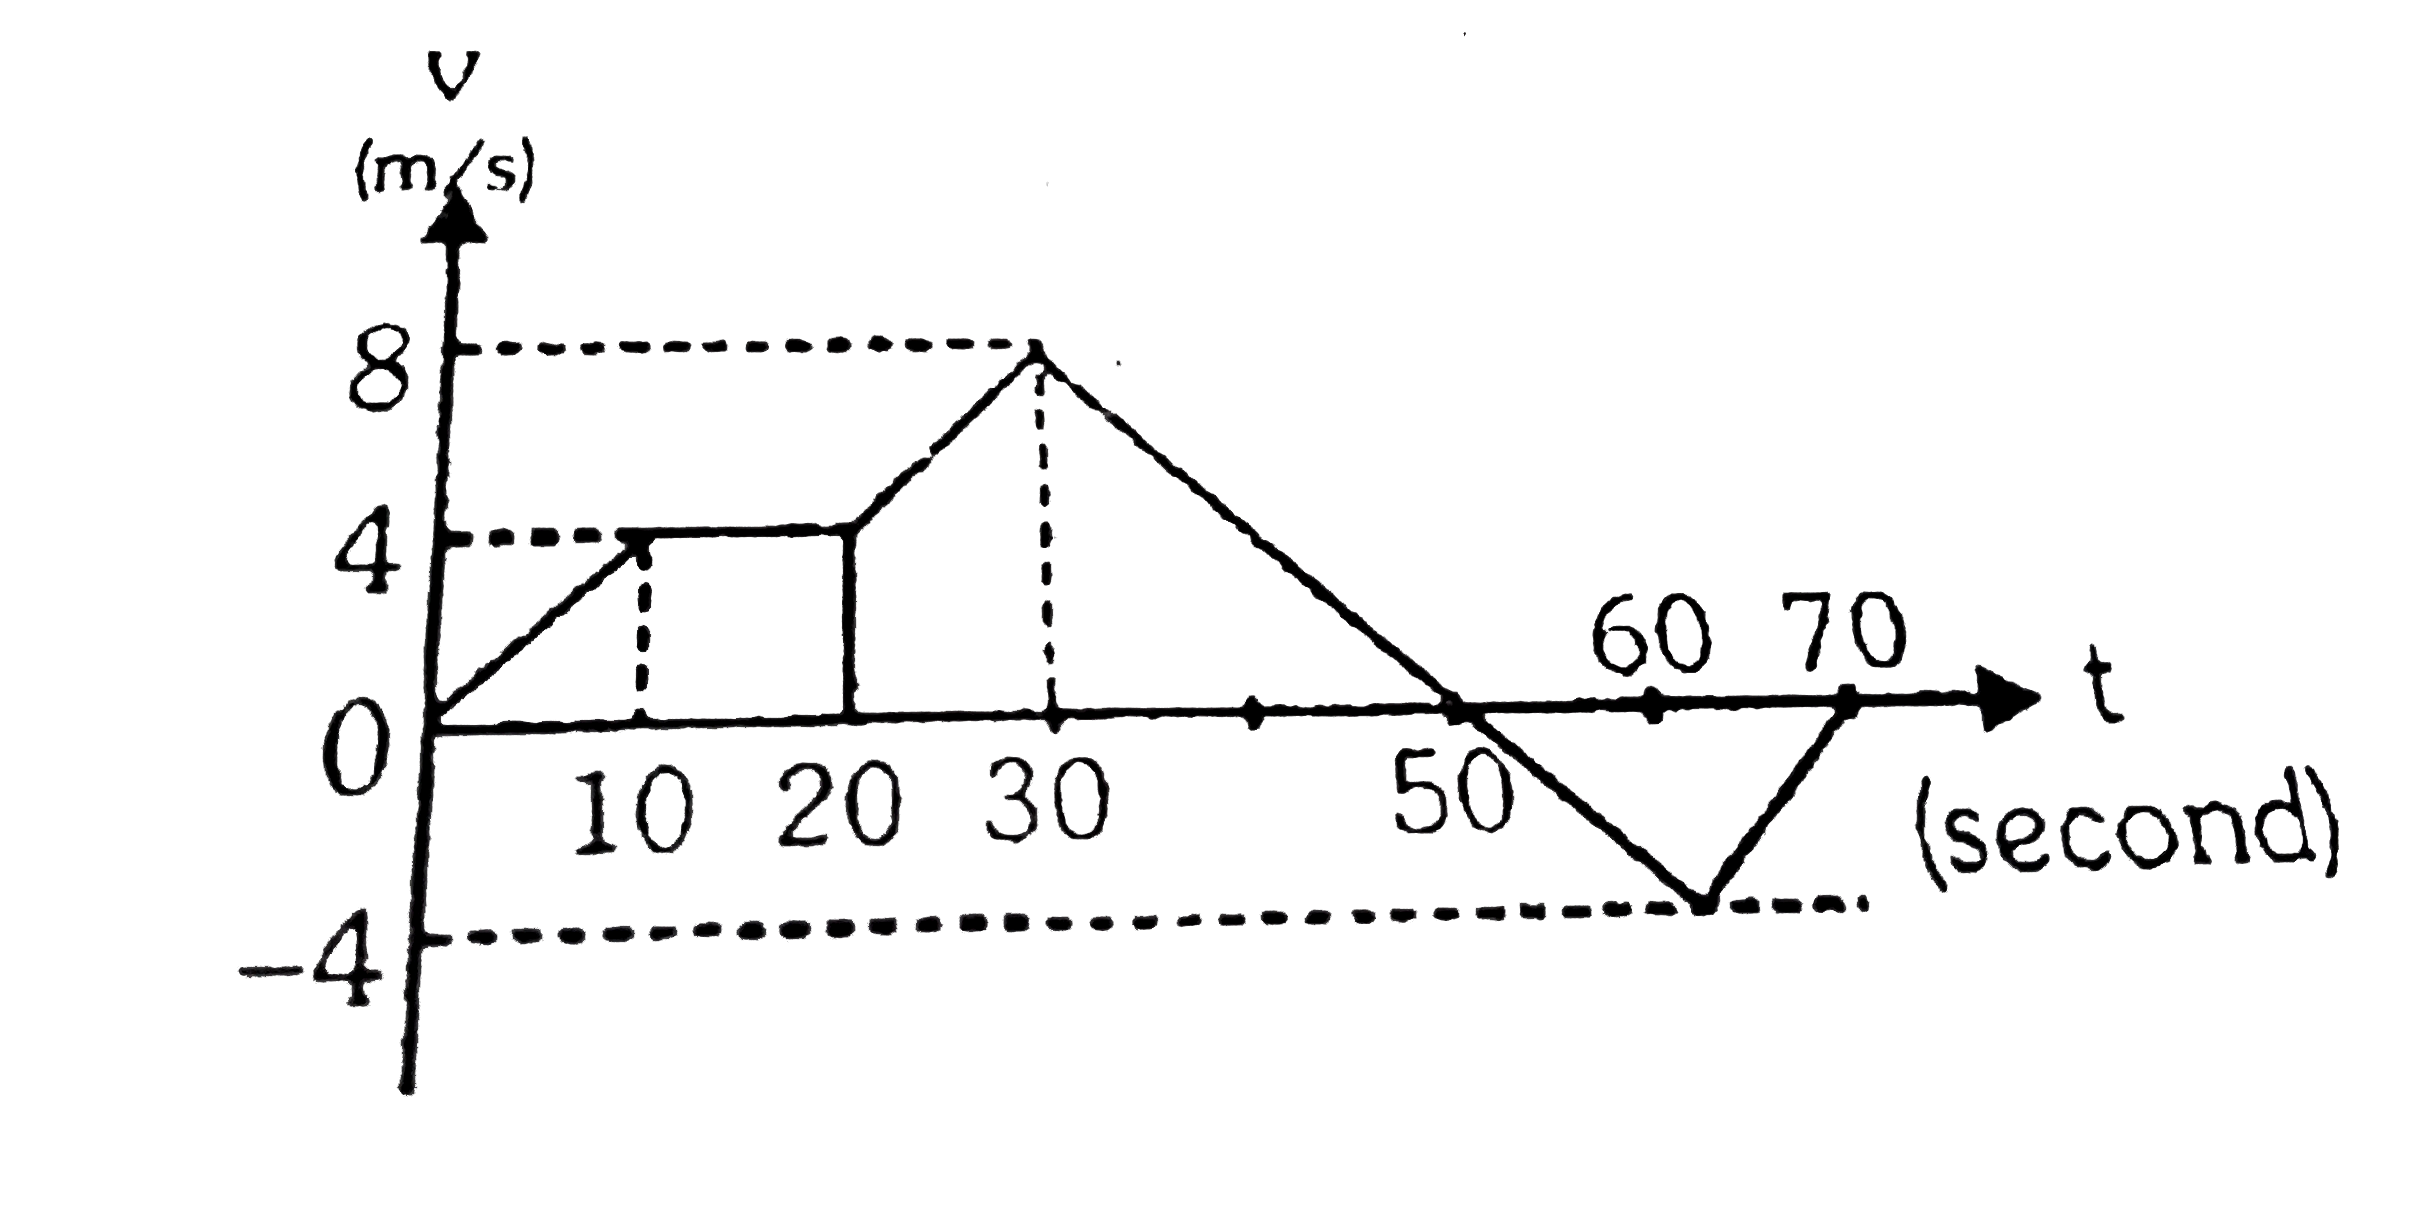
The maximum displacement from the starting position will be :-
View SolutionA car is moving on a straight road. The velocity of the car varies with time as shown in the figure. Initially (at t=0), the car was at x=0, where, x is the position of the car at any time 't'.
Average speed from t=0 to t=70s will be :-
View SolutionThe velocity-time graph of a car moving along a straight road is shown in figure. The average velocity of the car in first 25 seconds is
View SolutionThe x-t plot of a car is shown in the figure. The average velocity is zero in the time interval between 0 and t then t= _____sec.
View SolutionInitially car A is 10.5 m ahead of car B . Both start moving at time t = 0 in the same direction along a straight line. The velocity-time graph of two cars is shown in figure. The time when the car B will catch the car A , will be.
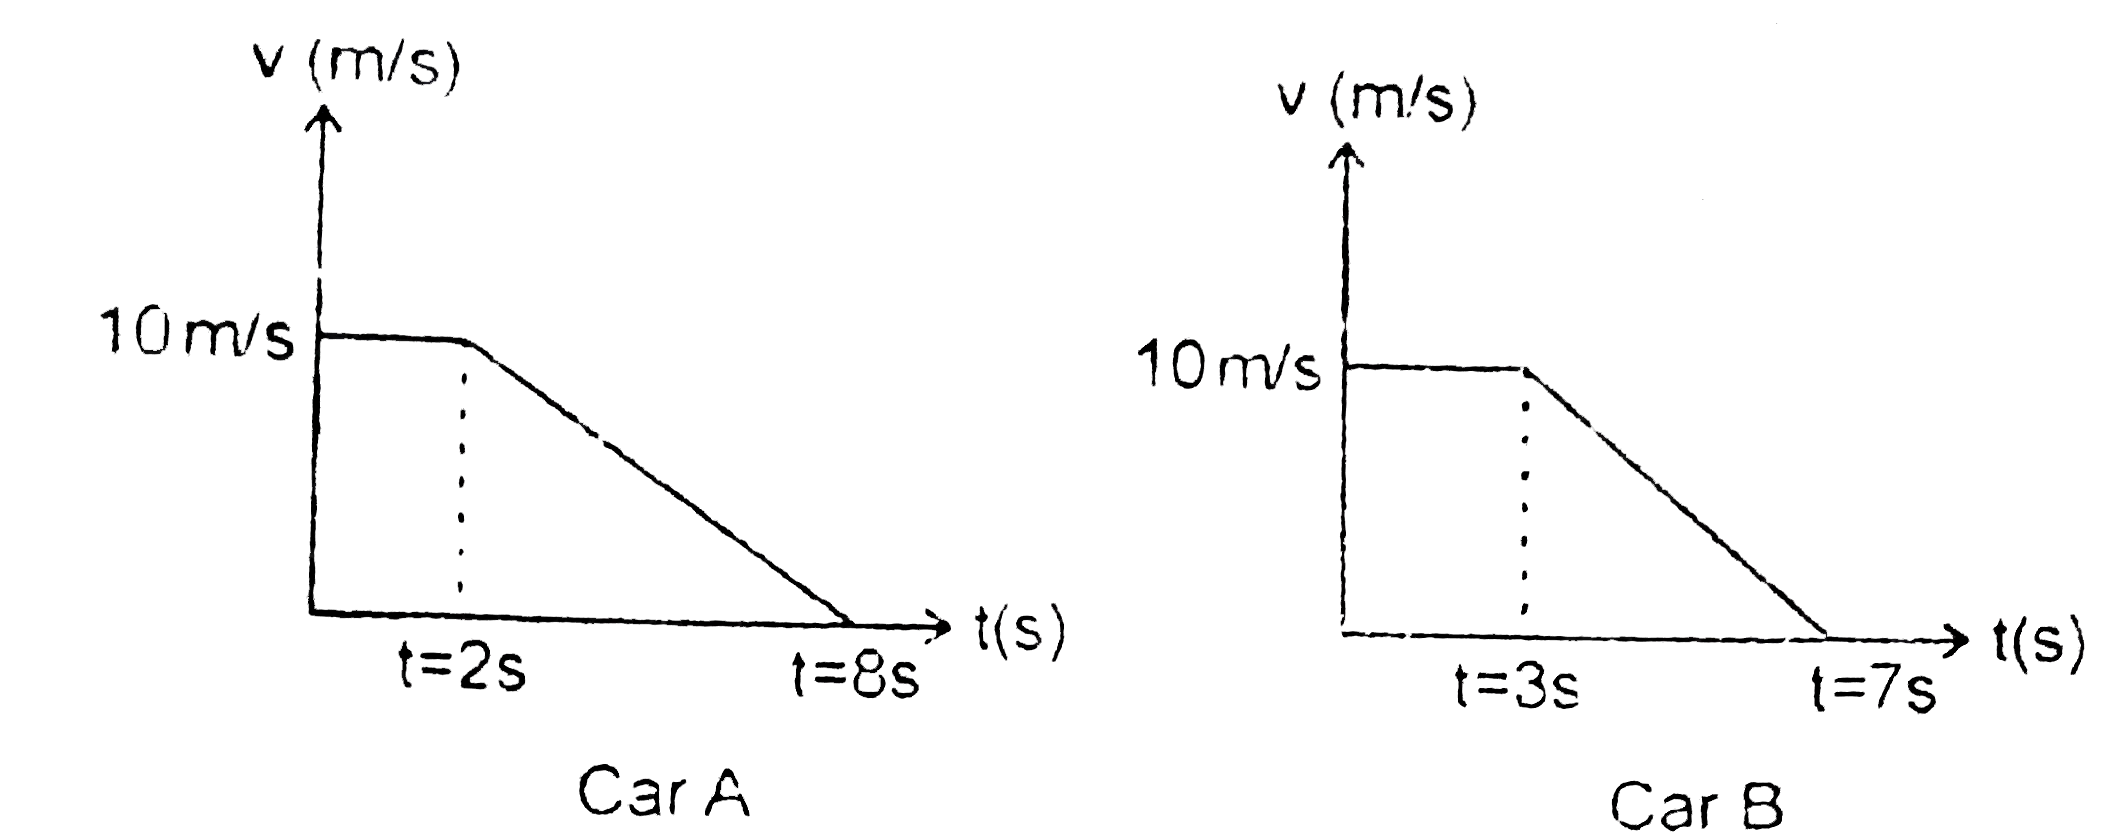
View SolutionCar A and car B move on a straight road and their velocity versus time graph are as shown in figure. Comparing the motion or car A in between t=0 to t=8sec. And motion of car B in between t=0 to t=7sec., pick up the correct statement.
 .
.
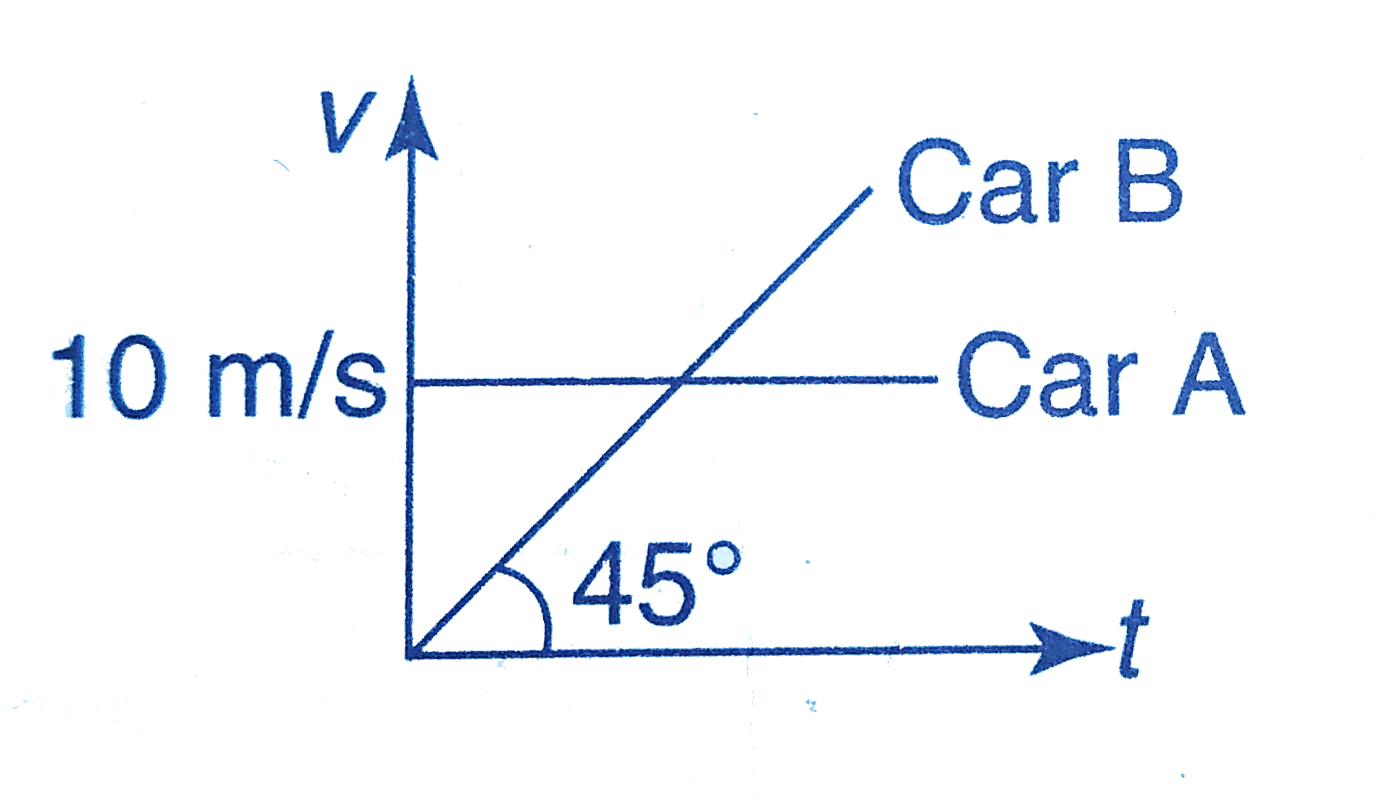
View SolutionInitially car A is 10.5m ahead of car B. Both start moving at time t=0 in the same direction along a straight line. The velocity-time graph of two cars is shown in figure. The time when the car B will catch the car A, will be.
View Solution
