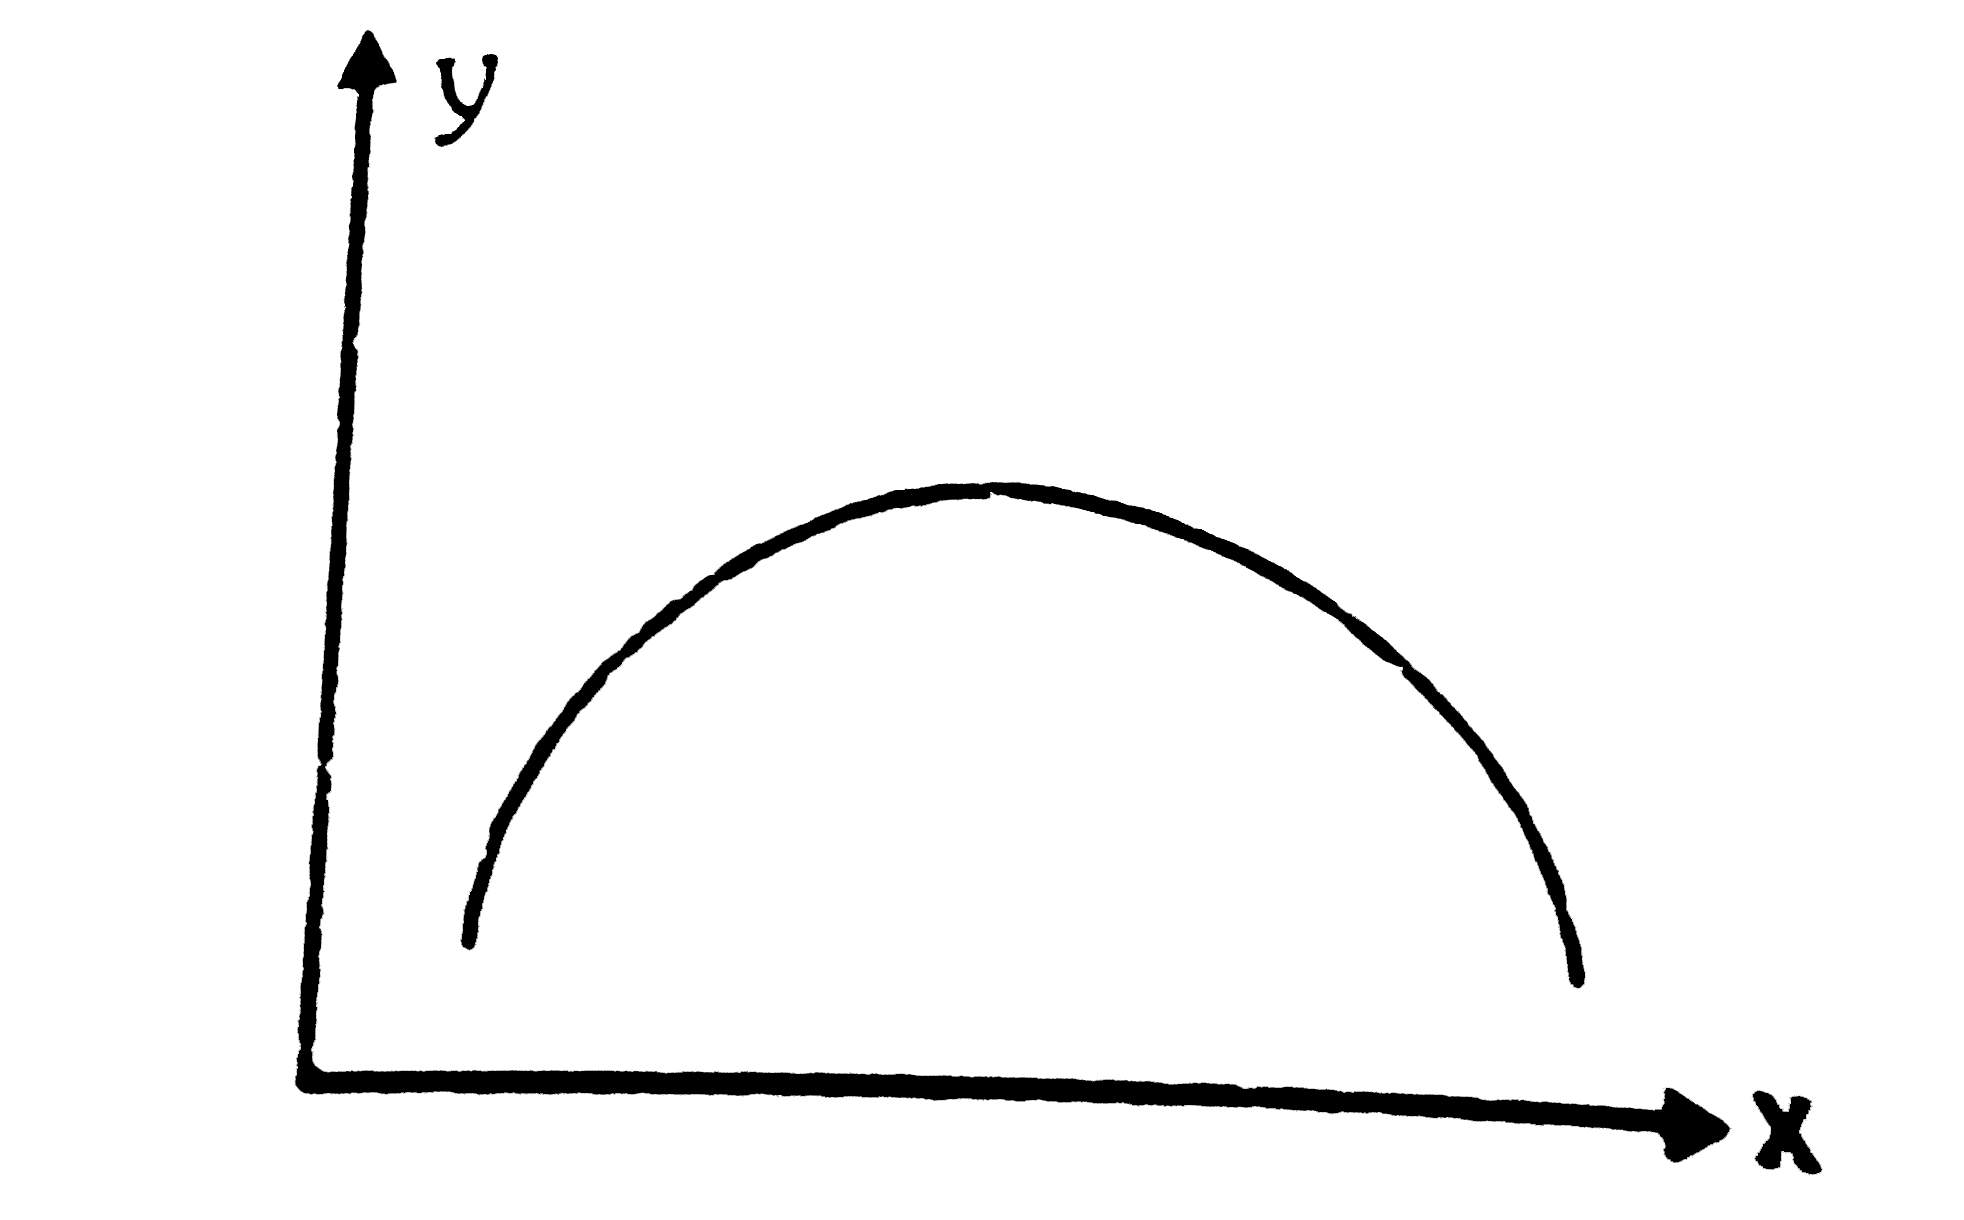
Magnitude of slope of the shown graph.
 Solution in Gujrati
first increses then decrese
first decrese then increses
increses
decreses
The correct Answer is:A
x=at,y=−bt2⇒a2y+bx2=0
Topper's Solved these Questions
- BASIC MATHSBOOK - ALLEN CHAPTER - BASIC MATHSEXERCISE - Comprehension 4
3 Videos
- BASIC MATHSBOOK - ALLEN CHAPTER - BASIC MATHSEXERCISE - DATA SUFFICIENCY QUESTIONS
3 Videos
- BASIC MATHSBOOK - ALLEN CHAPTER - BASIC MATHSEXERCISE - Comprehension 2
3 Videos
- AIIMS 2019BOOK - ALLEN CHAPTER - AIIMS 2019EXERCISE - PHYSICS
39 Videos
- CIRCULAR MOTIONBOOK - ALLEN CHAPTER - CIRCULAR MOTIONEXERCISE - EXERCISE (J-A)
6 Videos
Similar Questions
Which one of the following statement is false?
View SolutionTwo vectors →A and →B lie in a plane, another vector →C lies outside this plane, then the resultant of these three vectors i.e. →A+→B+→C
View SolutionTwo particle A and B are moving in XY-plane. Their positions vary with time t according to relation
xA(t)=3t,xB(t)=6
yA(t)=t,yB(t)=2+3t2
The distance between two particle at t=1 is :
View SolutionA simple pendulum executing SHM in a straight line has zero velocity at 'A' and 'B' whose distances form 'O' in the same line OAB are 'a' and 'b'. If the velocity half wat between them is 'v' then its time period is
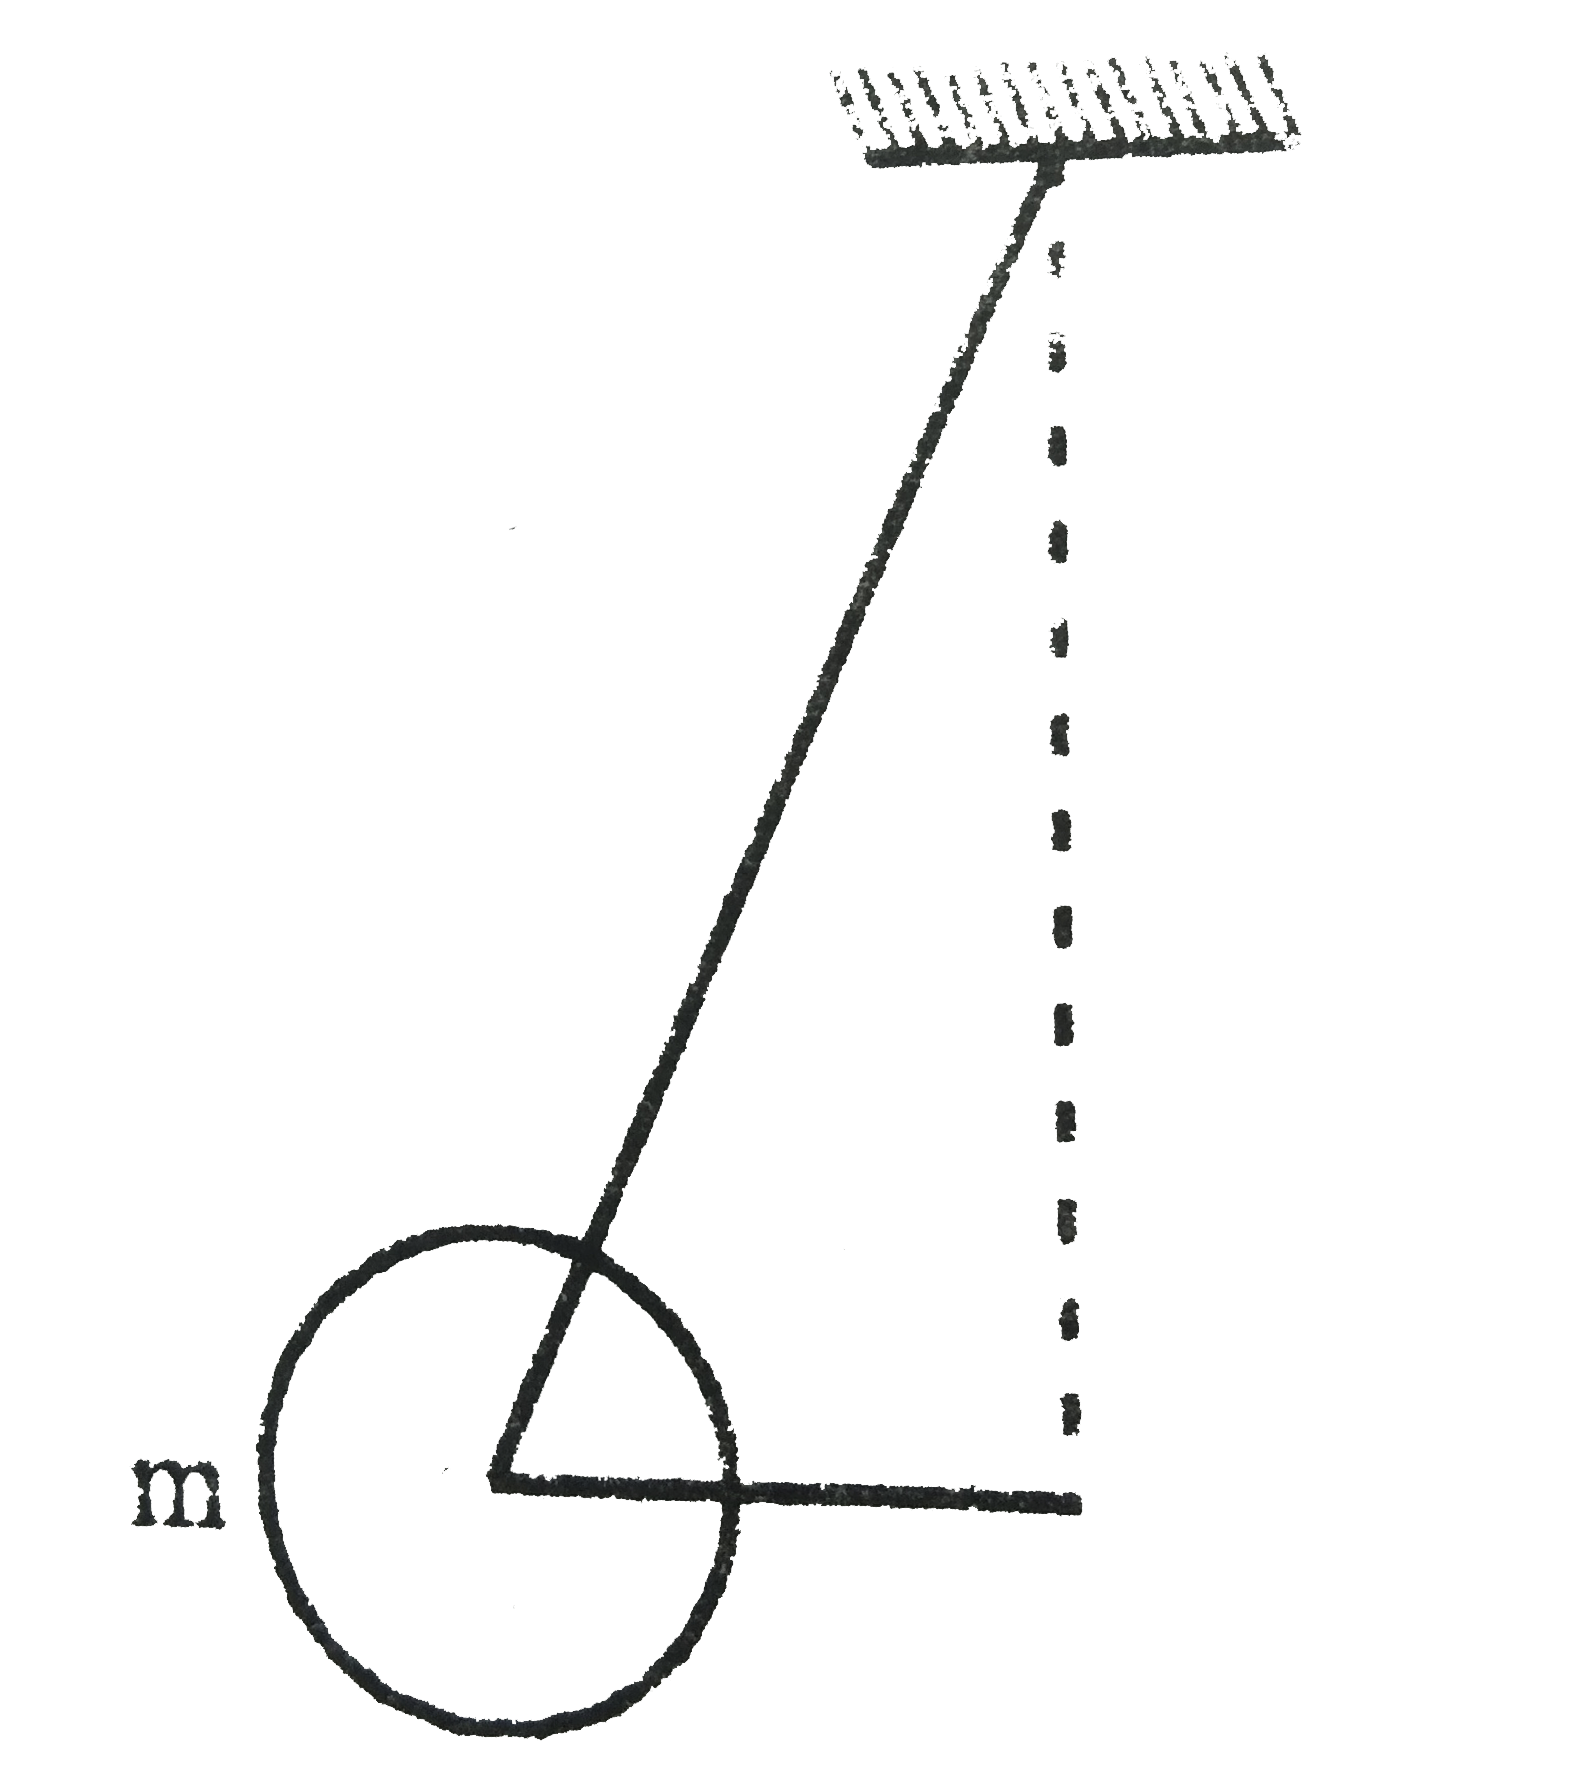
View SolutionA ball of mass (m)0.5kg is attached to the end of a string having length (L)0.5m. The ball is rotated on a horizontal circular path about vertical axis. The maximum tension that the string can bear is 324N. The maximum possible value of angular velocity of ball (radian/s) is -
 .
.
View SolutionThe acceleration - velocity graph of a particle moving in a straight line is shown in figure. Then the slope of the velocity- displacement graph
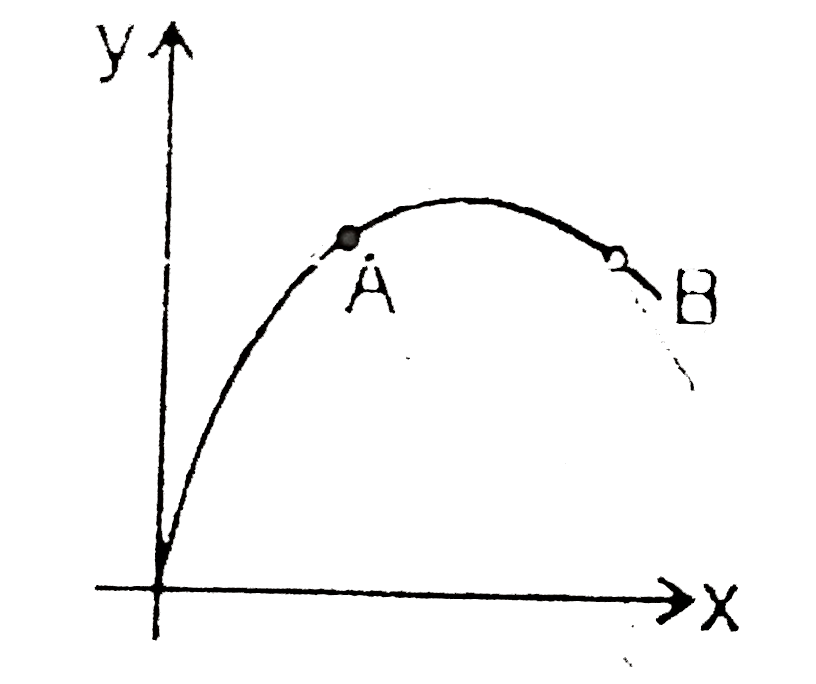
View SolutionFor the shown graph slope of graph from point A to point B :
View SolutionAssertion : In the s-t graph as shown in figure, velocity of particle is negative and acceleration is positive.
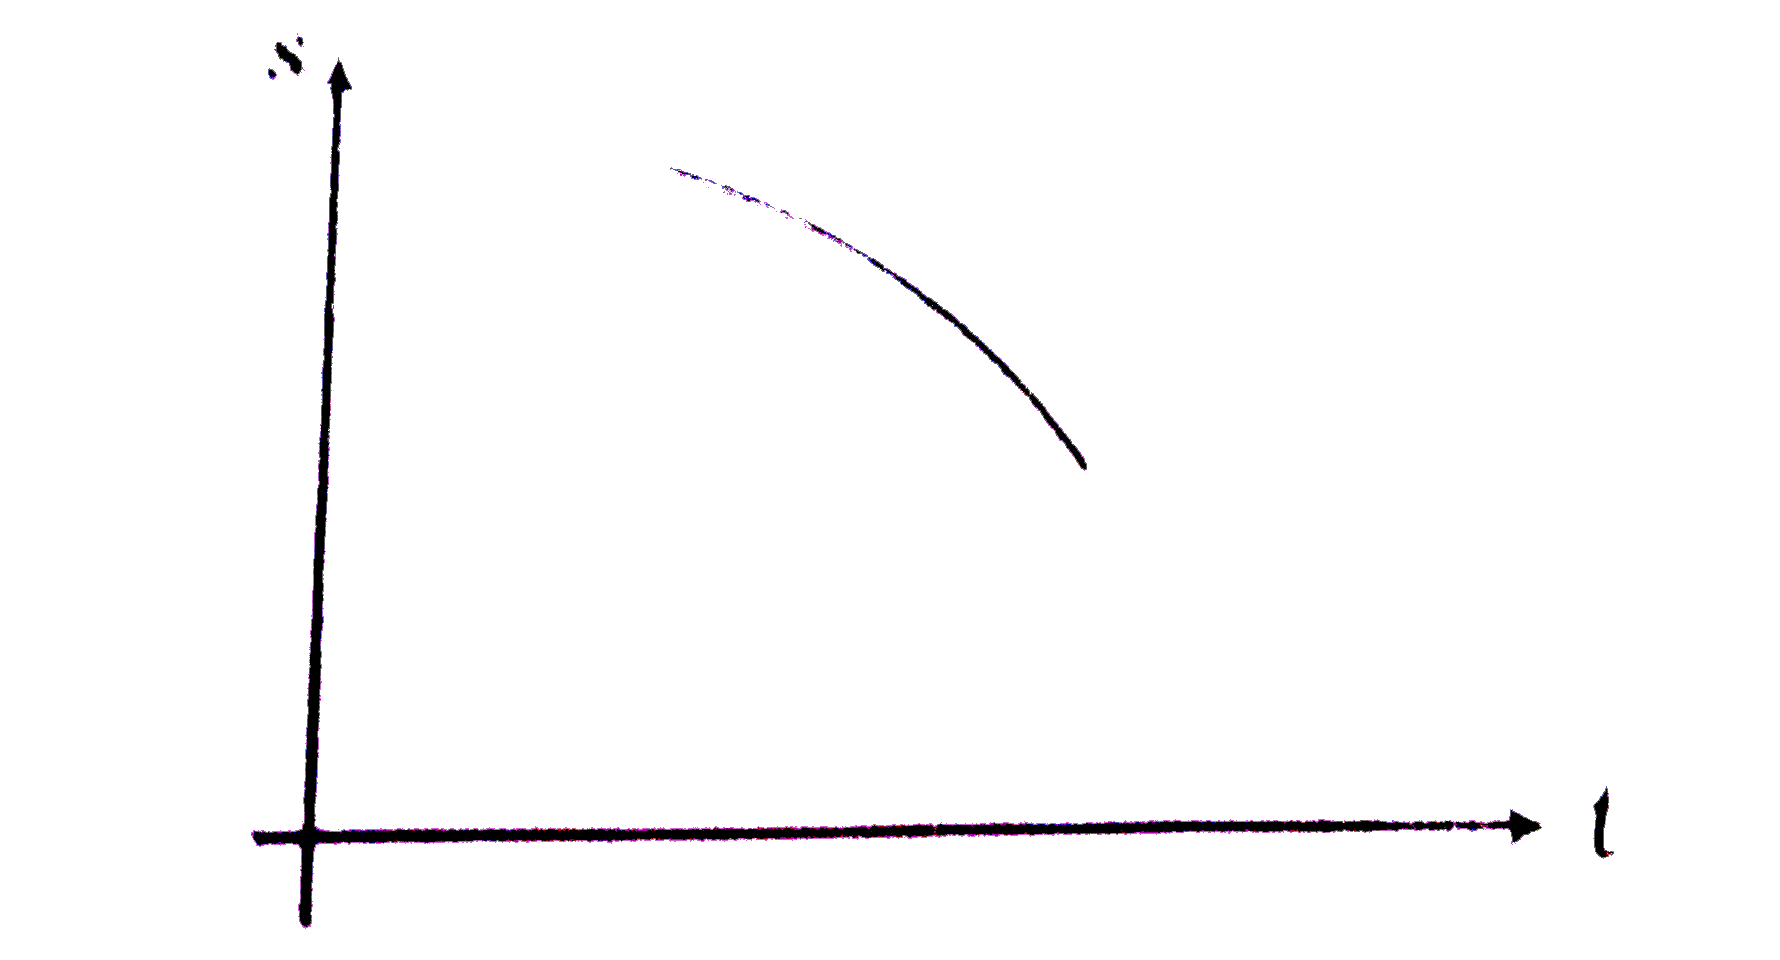
Reason : Slope of s-t graph is negative and increasing in magnitude.
View SolutionMagnitude of slope i.e. steepness of graph shown in figure ltimg src="https://d10lpgp6xz60nq.cloudfront.net/physics_images/ALN_PHY_R04_E01_026_Q01.png" width="80%"gt
View SolutionWhen a plot between logk and 1/T is plotted we get the graph as shown.
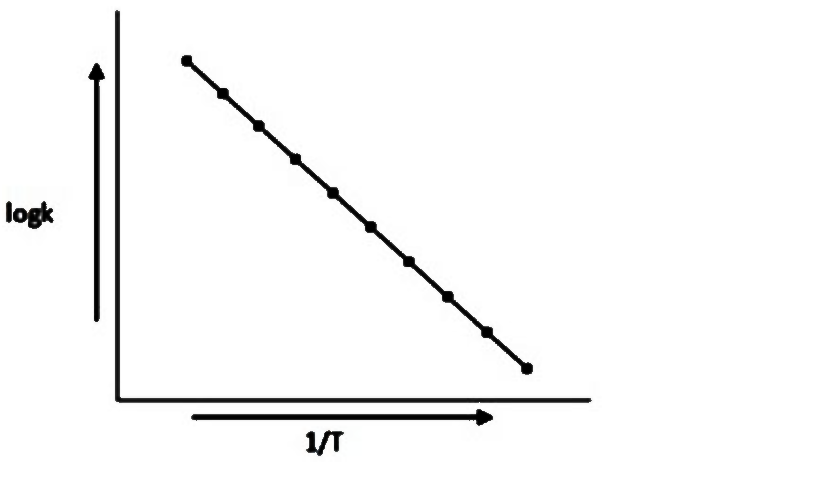
What is the value of slope in the graph?
View SolutionThe V – I graph for a wire of copper of length L and cross -section area A is shown in the figure below . The slope of the graph will be
View SolutionA : The displacement (s) time graph shown in the figure represents an accelerated motion.
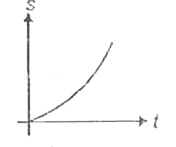
R : Slope of graph increases with time.
View SolutionAcceleration-velocity graph of a particle moving in a straight line is as shown in the figure. Then slope of velocity-displacement graph

View SolutionThe slope of graph y-t give the magnitude of .......... (displacement, speed, acceleration)
View SolutionThe slope of the distance-time (xt) graph gives the magnitude of acceleration.
View SolutionAssertion : In the s-t graph as shown in figure, velocity of particle is negative and acceleration is positive. Reason : Slope of s-t graph is negative and increasing in magnitude.
View Solution
