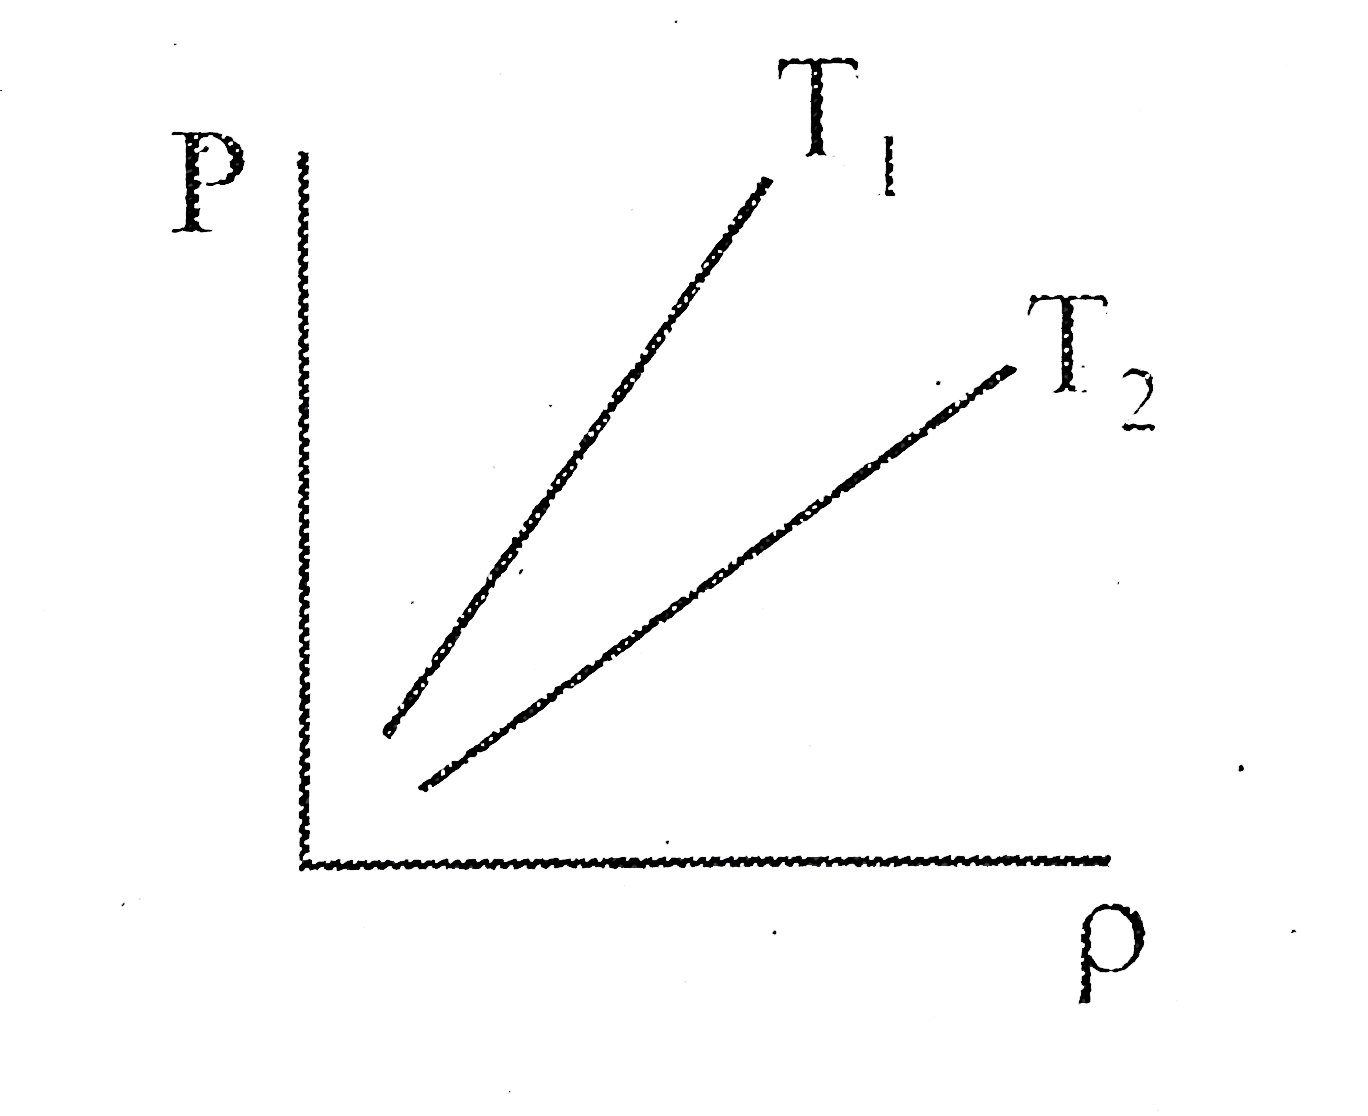
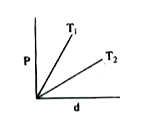
Figure shows graphs of pressure vs density for an ideal gas at two temperature T1 and T2 . Which of the following is correct ?
 Solution in Gujrati
T1>T2
T1=T2
T1<T2
Any of the three is possible
Step by step video & image solution for Figure shows graphs of pressure vs density for an ideal gas at two temperature T_(1) and T_(2) . Which of the following is correct ? by Physics experts to help you in doubts & scoring excellent marks in Class 12 exams.
Updated on:21/07/2023Topper's Solved these Questions
Similar Questions
Why are electric field lines perpendicular at a point on an equipotential surface of a conductor ?
View SolutionConsider the statements given below-
(A) The wave and the particle aspects are both neccessary for a complete description of light
(B) The wave and particle aspects cannot be revealed simultaneously in a single experiment. The-
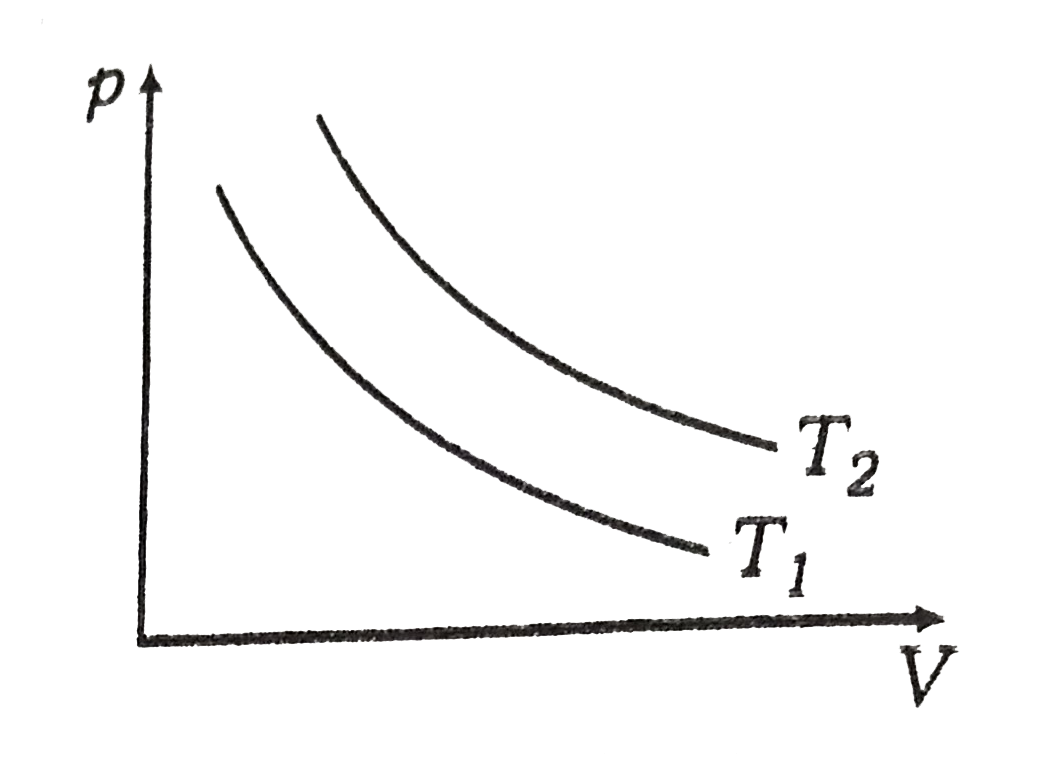
View SolutionFigure shows the pressure P versus volume V graphs for a certains mass of a gas at two constant temperature T_(1) and T_(2) . Which of the following interface is correct?
View SolutionFigure shows graphs of pressure versus density for an ideal gas at two temperatures T_(1) and T_(2) Which is correct ? .
View SolutionThe adjoining fgure shows graph of pressure and volume of a gas at two temperatures T1 and T2 Which one the following is correct
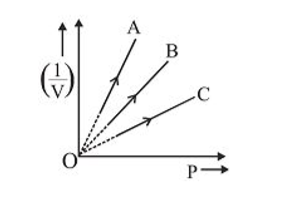
View SolutionFigure shows the isotherms of fixed mass of an ideal gas at three temperatures TA.TB and TC then:-
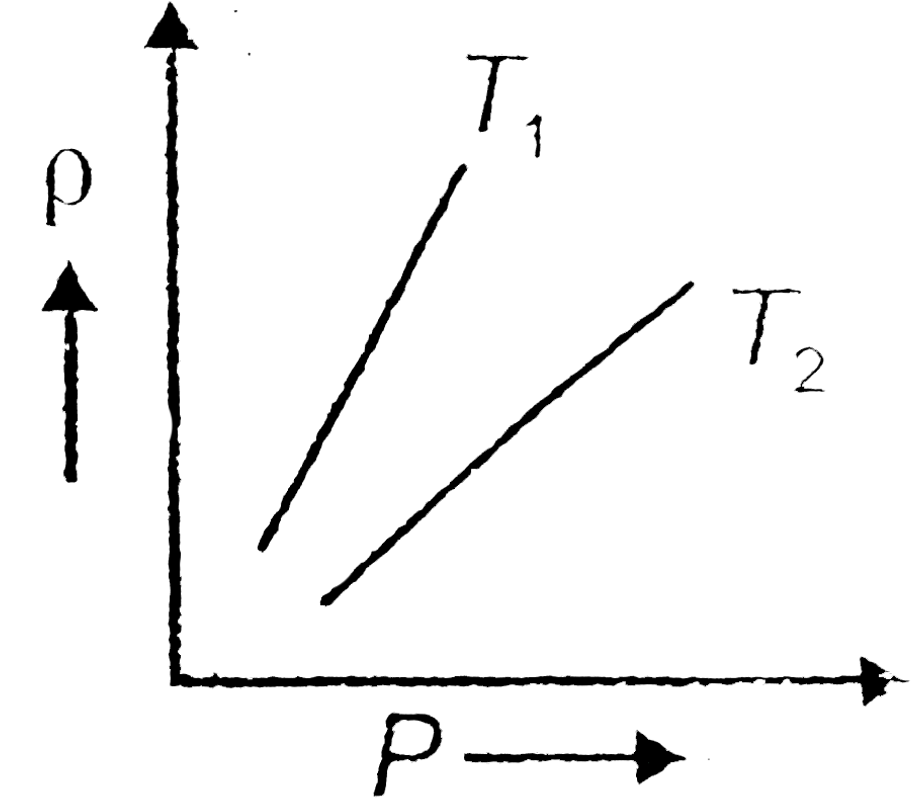
View SolutionThe density (ρ) versus pressure (P) graphs of a given mass of an ideal gas is shown at two temperatures T1andT2. Then relation between T1andT2 may be
View SolutionAt two different temperature T_(1) and T_(2), (T_(2) gt T_(1)) , draw two PV-P graphs for a definite amount of an ideal gas.
View SolutionThe given figure shows the maxwell distribution of molecular speeds of a gas at three different temperature T_(1),T_(2) and T_(3) . The correct order of temperature is
View SolutionFigure shows the isotherms of a fixed mass of an ideal gas at three temperatures TA,TB and TC , then
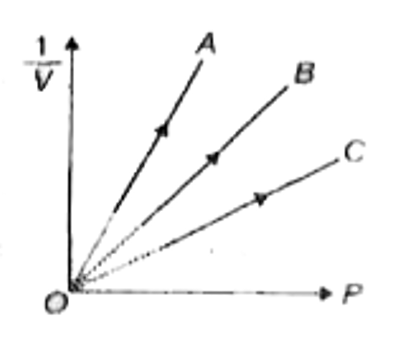
View SolutionThe following graph respresent the pressure versus number density for ideal gas at two different temperature T1andT2. The graph implies ................. .
View SolutionDiagram shows a graph between pressure and density for an ideal gas at two temperatures T1andT2 which is correct
View SolutionThe following graphs shows two isothermal process for a fixed mass of an ideal gas. Find the ratio of r.m.s speed of the molecules at temperatures T1 and T2?
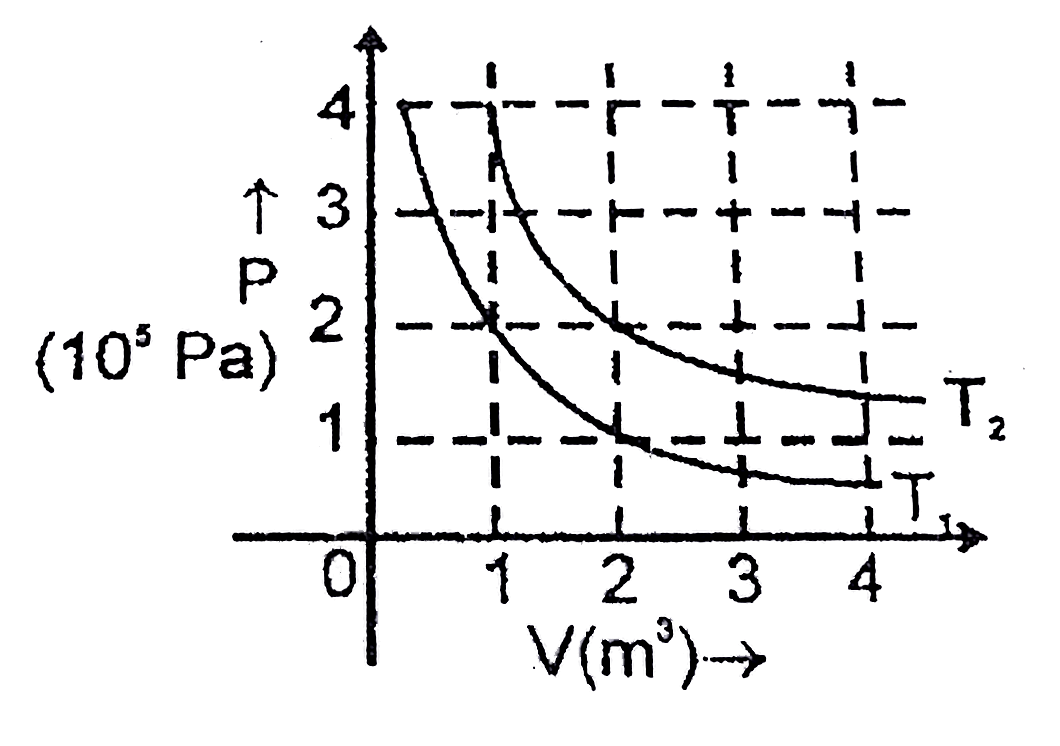
View SolutionThe adjoining fgure shows graph of pressure and volume of a gas at two temperatures T_(1) and T_(2) Which one the following is correct
View SolutionFigure shows graphs of pressure versus density for an ideal gas at two temperatures T_(1) and T_(2) Which is correct ? .
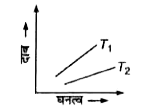
View Solutionनिम्न चित्र में एक आदर्श गैस के लिए दाब तथा घनत्व के मध्य ग्राफ दो तापमानों T1 तथा T2 पर खींचे गए हैं। कौन-सा सम्बन्ध सही है?
View Solution
