using the illustration when both surfaces 1 and 2 are exposed to the atmoshere, P1 and P2 are gauge pressure , and h1 and h2 are heights .
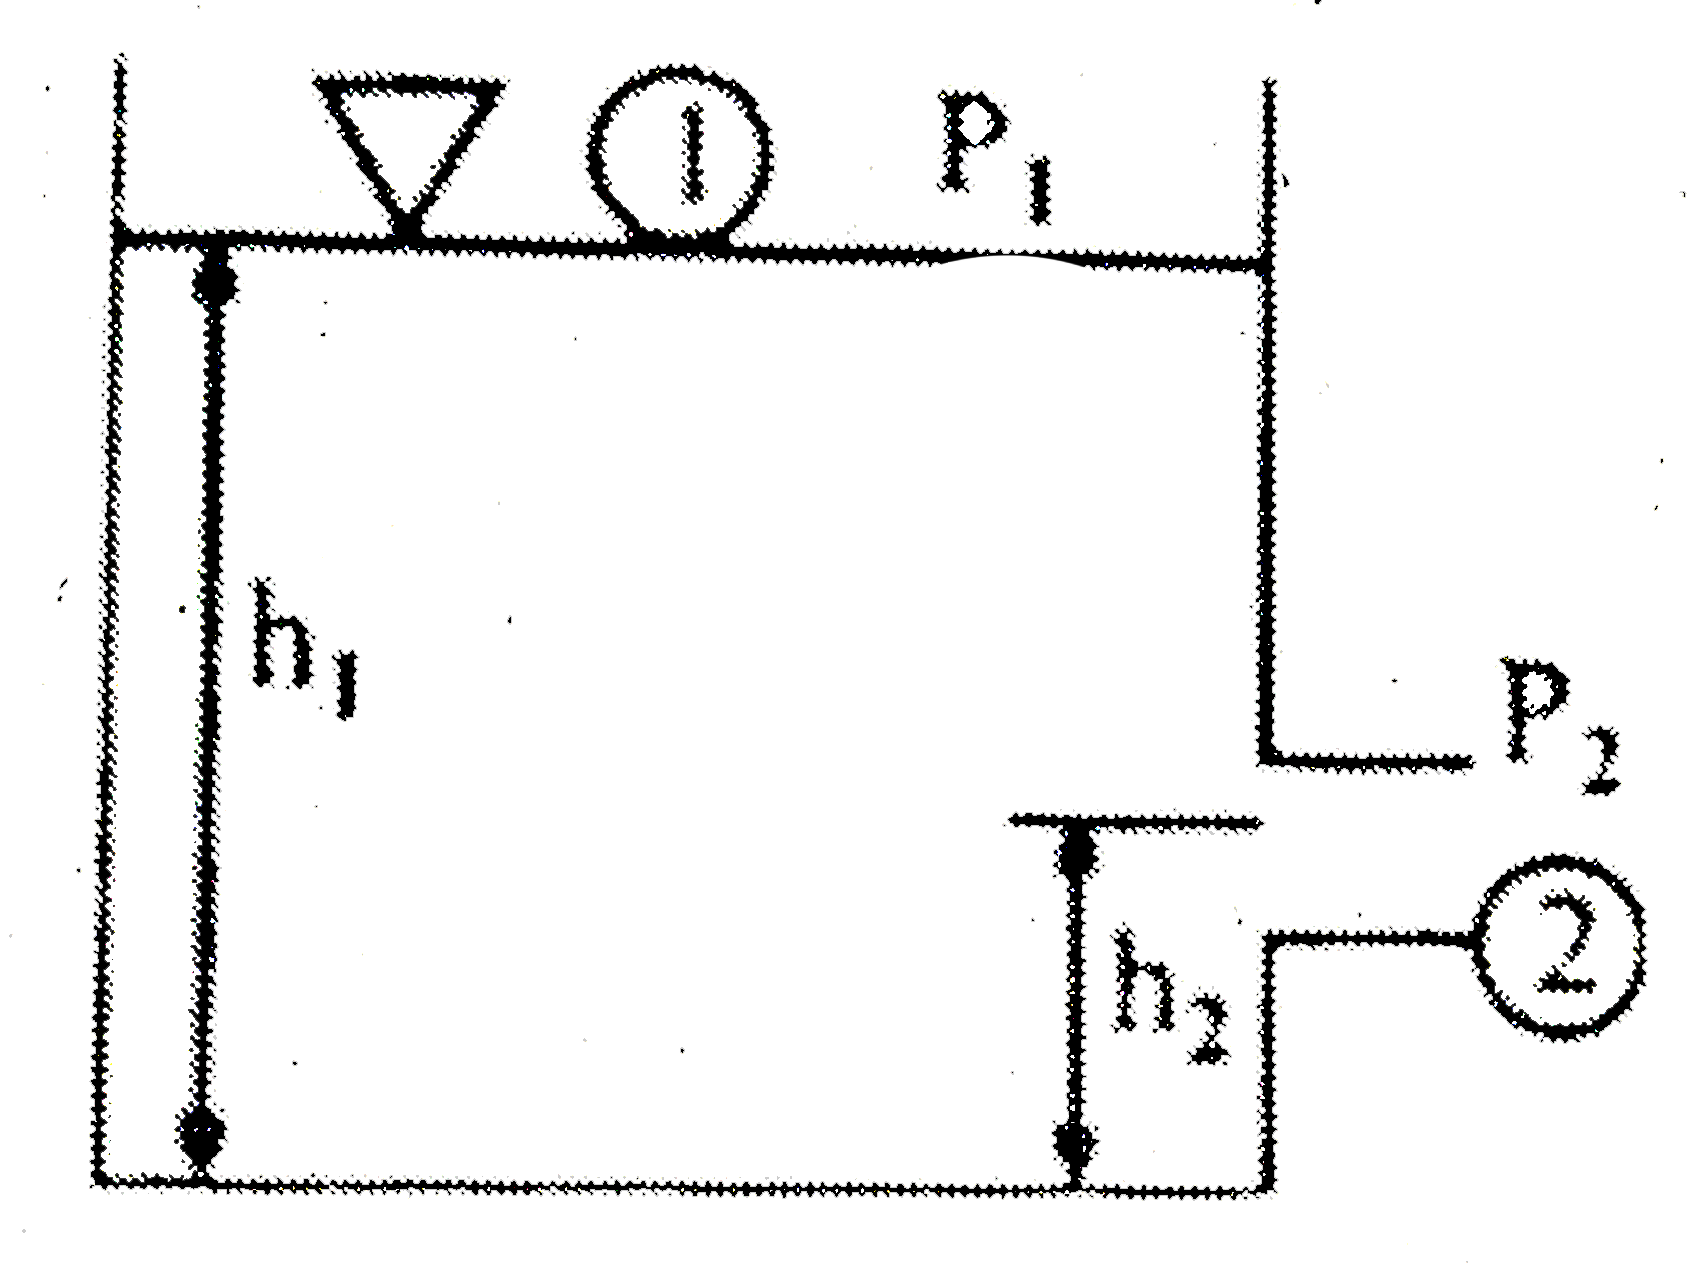
The Bernoulli equation for this situation is h1+P1W+V212a=h2+P2W+V222a
The velocity of the fluid leavening point (2) is constant and can be expressed as
V2=(P1/P2)V1
V2=(P1/P2)ah
V2=[(h1−h2)(2a)]1/2
none of the above
The correct Answer is:C
h1+P1W+V212a+h2+P2W+V222a at 1 the velocity in all practical purposes =0 and P0=P2=0 then the equation above can be written as
h2+V222a=h1
V22=(h1−h2)2a
V2=[(h1−h2)(2a)]1/2
Similar Questions
using the illustration when both surfaces 1 and 2 are exposed to the atmoshere, P1 and P2 are gauge pressure , and h1 and h2 are heights .
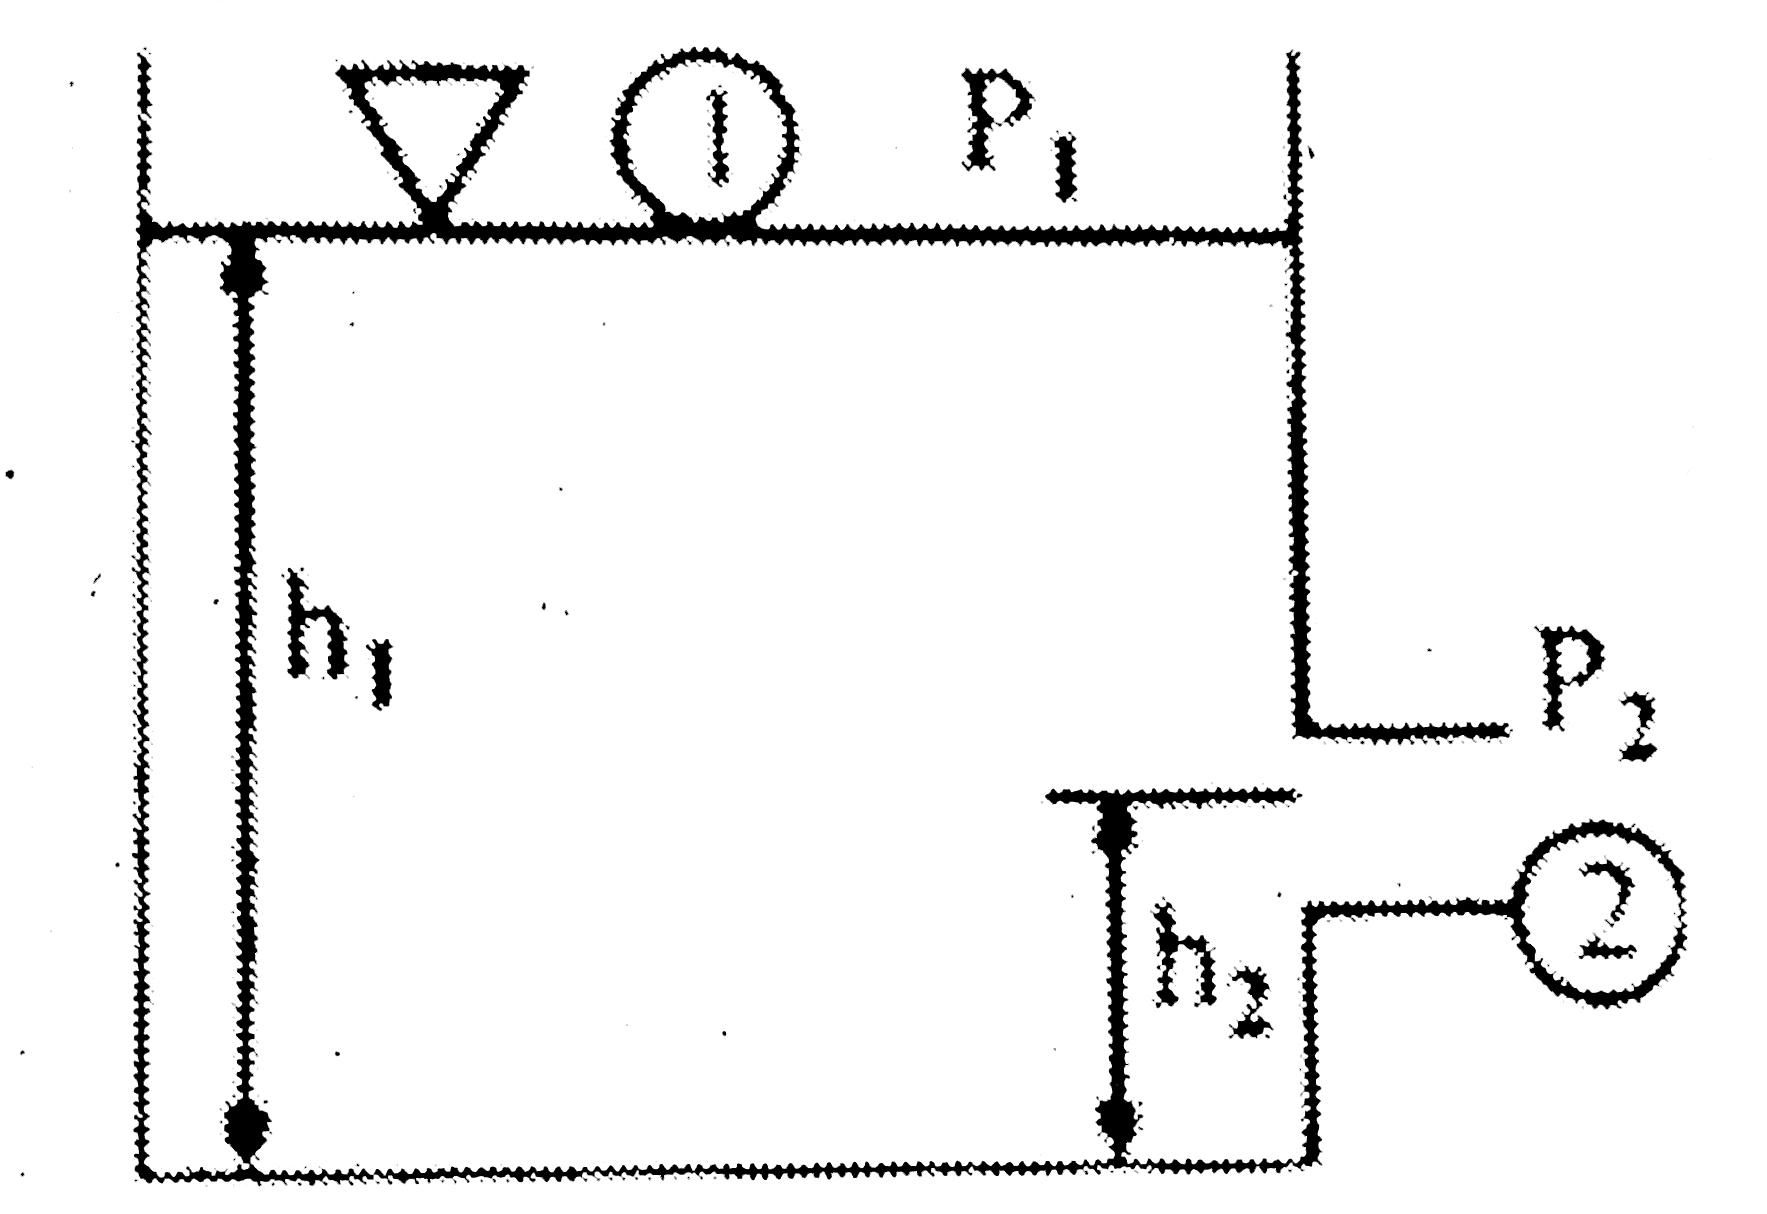
The Bernoulli equation for this situation is h1+P1W+V212a=h2+P2W+V222a
The value of P1 and P2 are such that
View Solutionusing the illustration when both surfaces 1 and 2 are exposed to the atmoshere, P1 and P2 are gauge pressure , and h1 and h2 are heights .
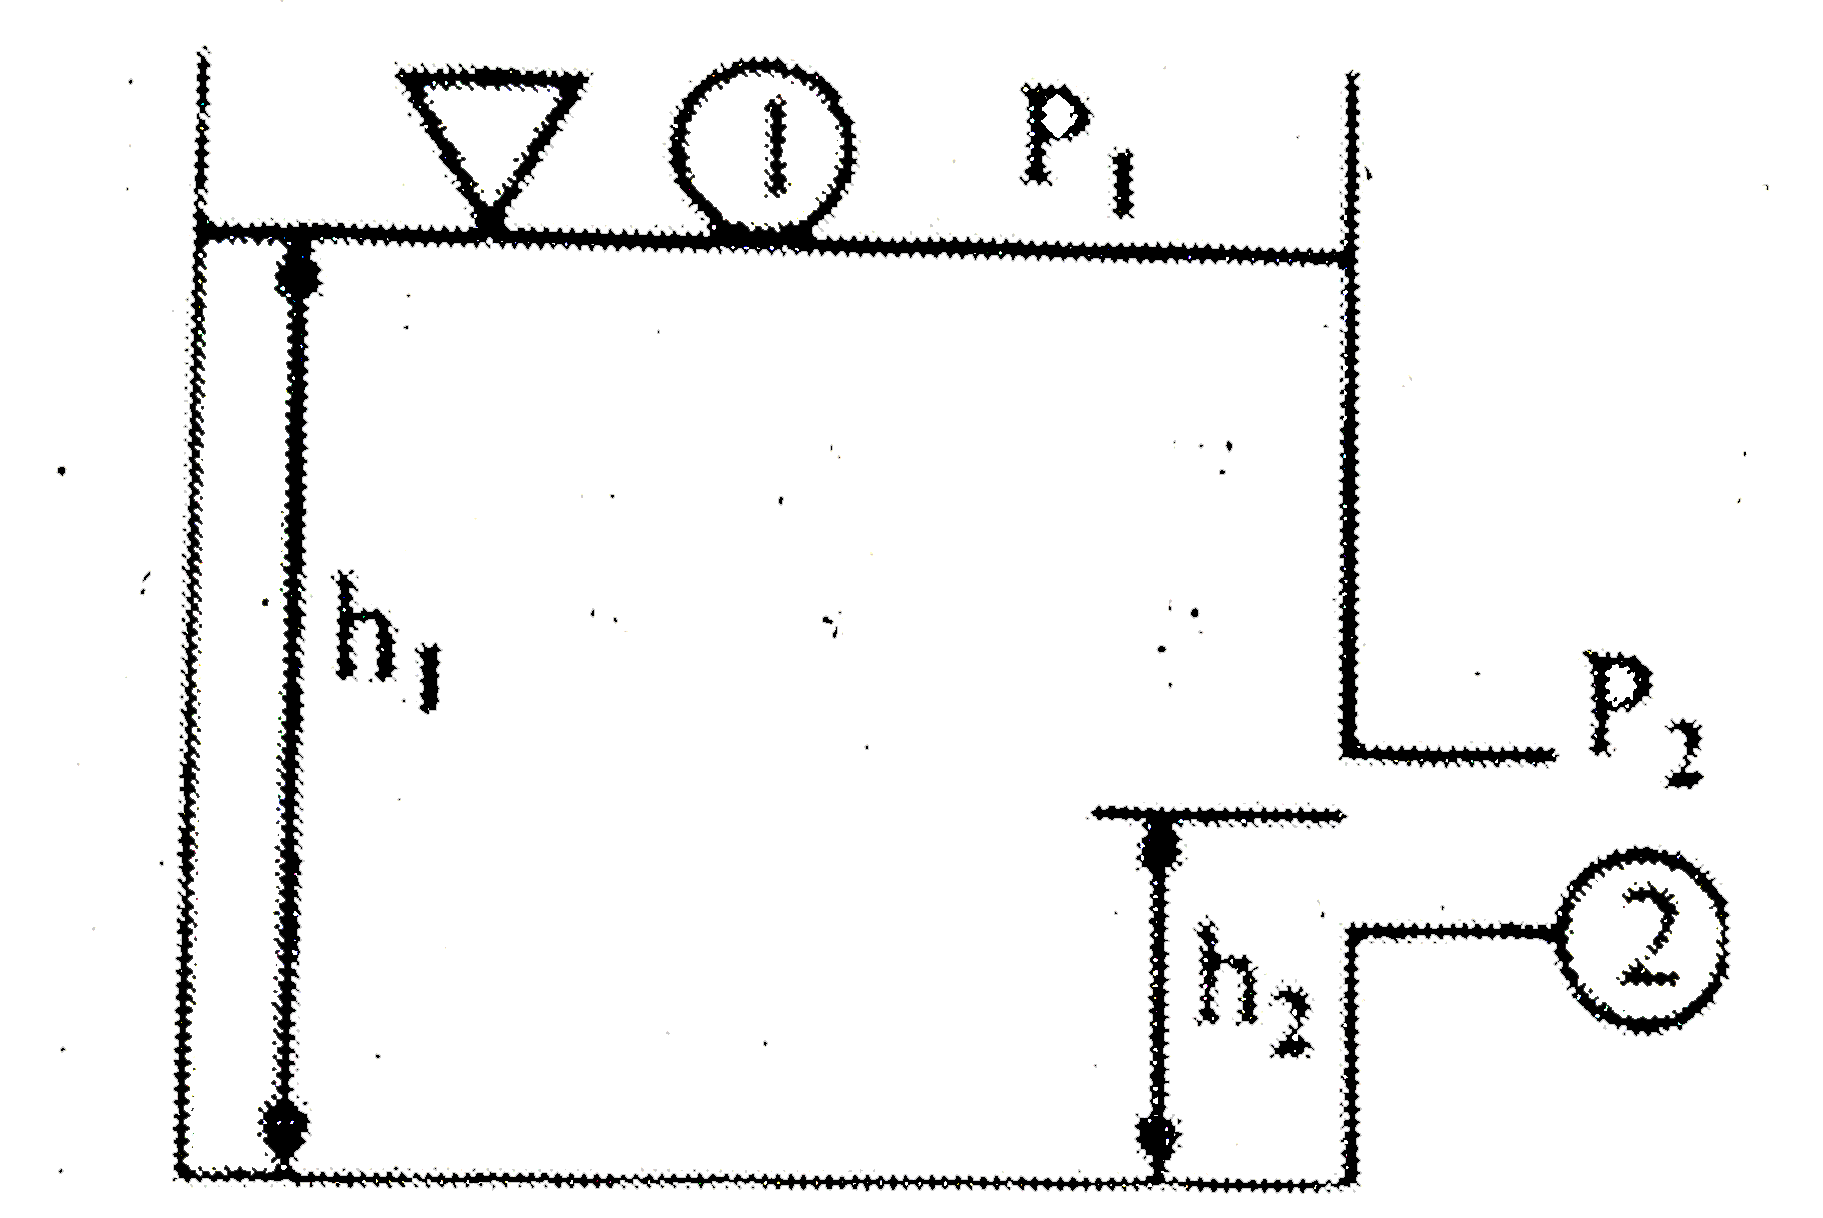
The Bernoulli equation for this situation is h1+P1W+V212a=h2+P2W+V222a
If an Identical outlet were placed at exactly the same point on the left side of the container, the velocity would be
View Solution
Knowledge Check
The pressure P1 at the top of a dam and P2 at a depth h from the top inside water (density ρ) are related as :
AP1>P2BP1=P2CP1−P2=hρgDP2−P1=hρg
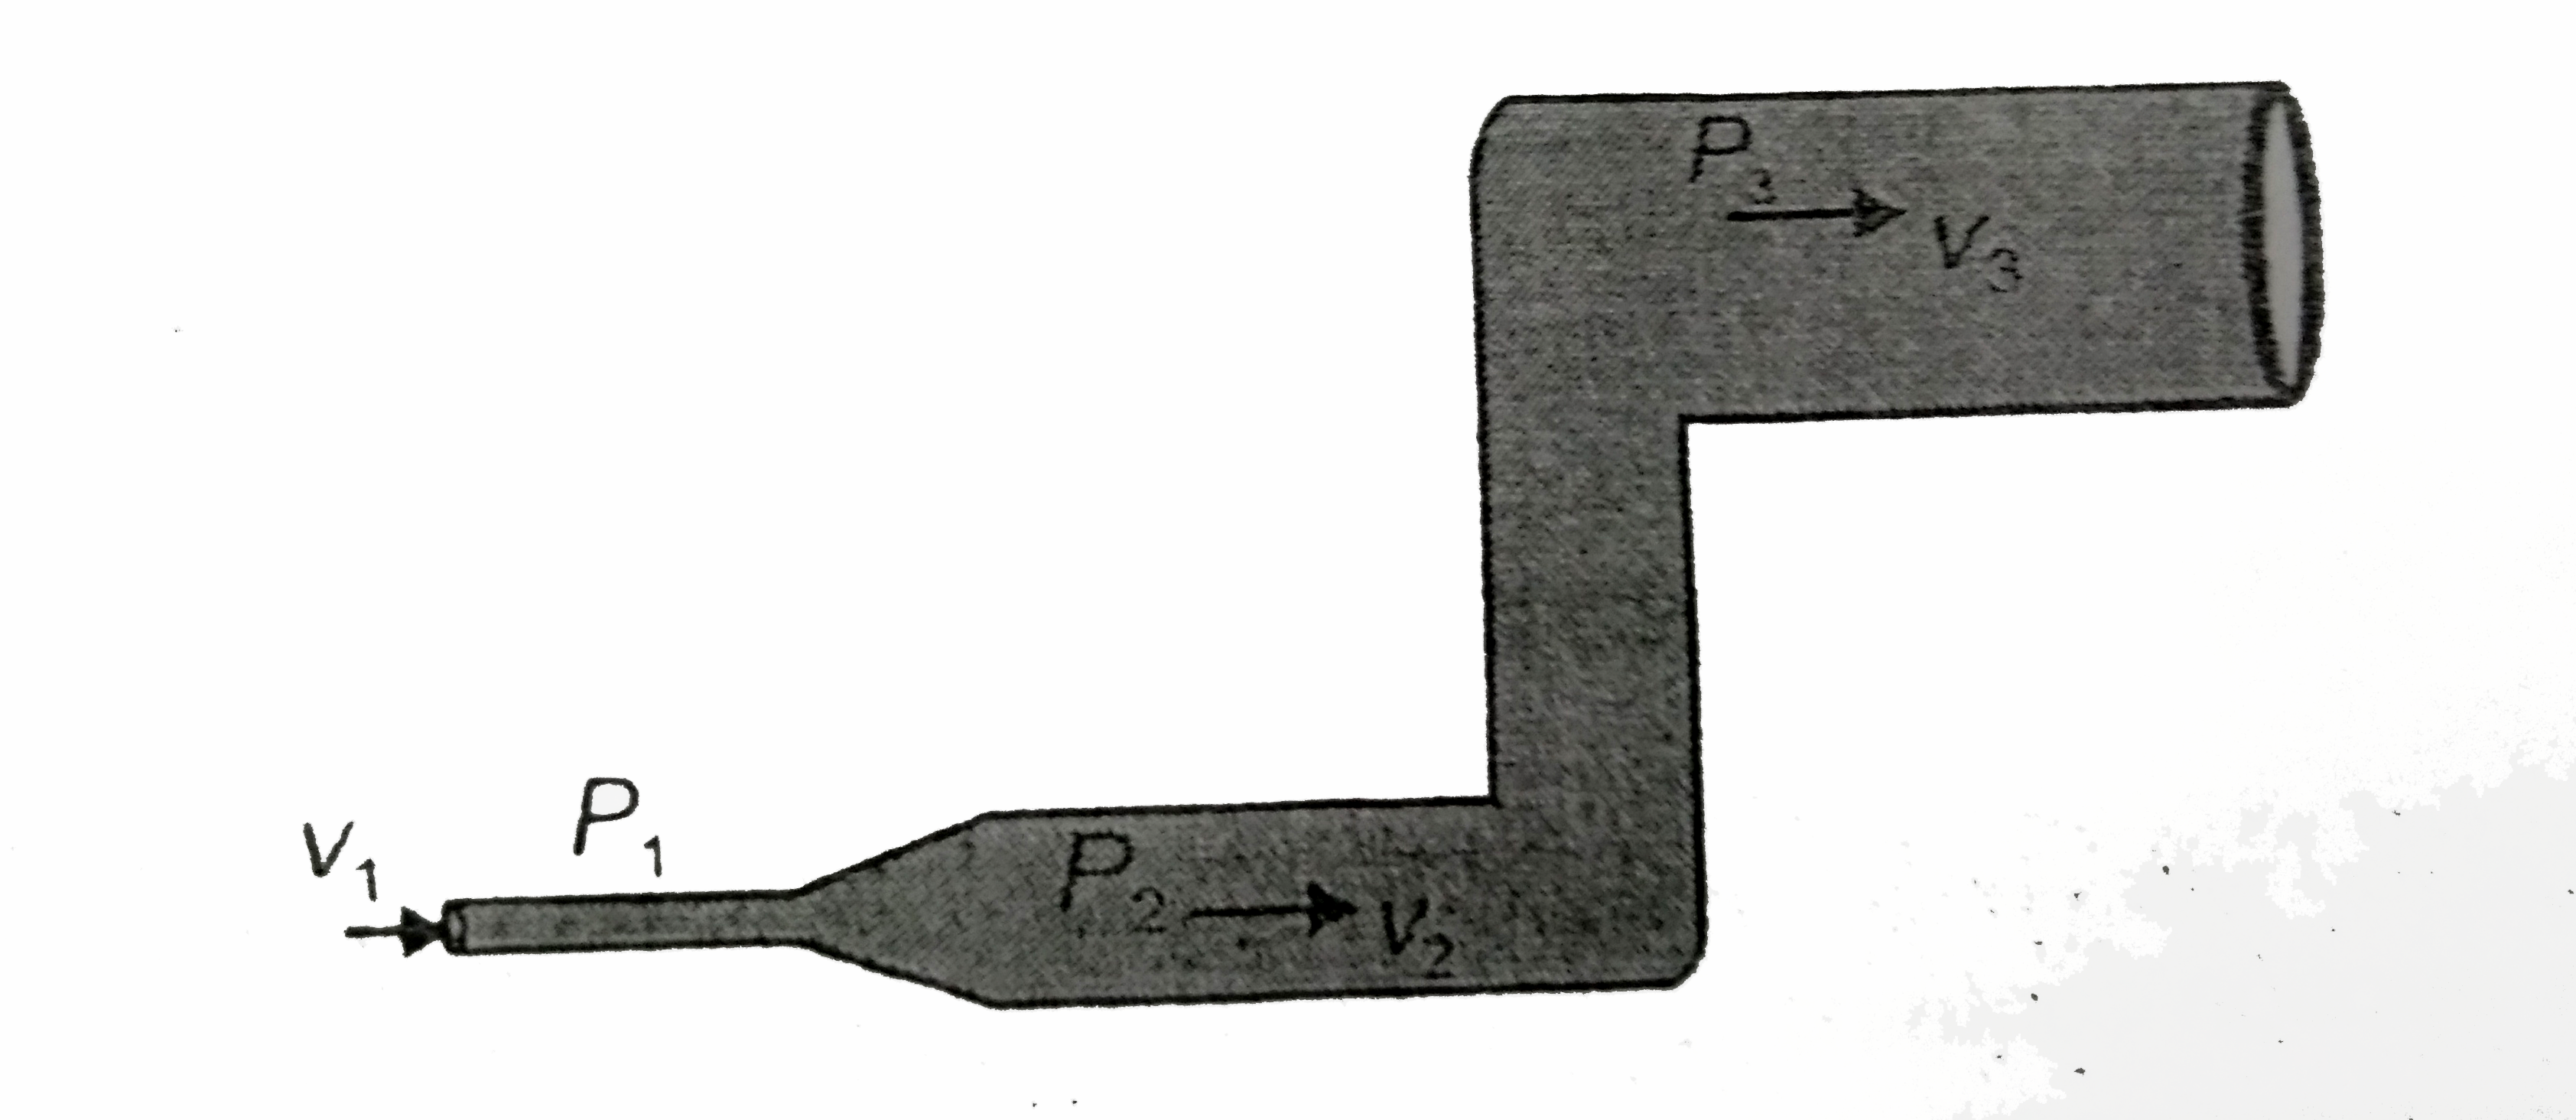
Water is flowing through a pipe as shown in figure. If P1,P2andP3 are pressures and v1,v2andv3 are velocities of water at the different sections as shown in figure, then
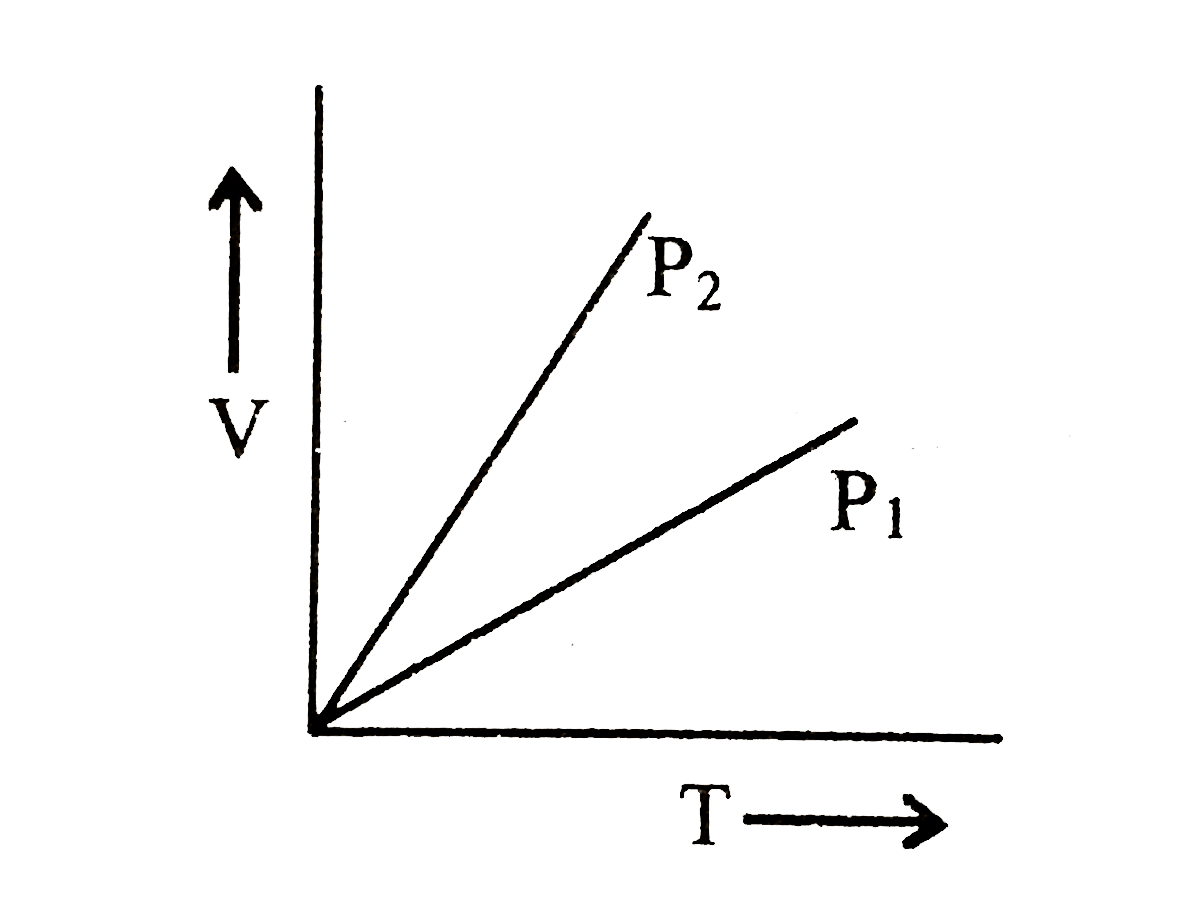
View SolutionFor V versus T curves at constant pressure P1andP2 for and ideal gas shown in figure-
View SolutionA horizontal tube has different cross sections at points A and B. The areas of cross section are a1 and a2 respectively, and pressures at these points are p1=ρgh1 and p2=ρgh2 where ρ is the density of liquid flowing in the tube and h1 and h2 are heights of liquid columns in vertical tubes connected at A and B. If h1−h2=h, then the flow rate of the liquid in the horizontal tube is
View SolutionThe volume V versus temperature T graphs for a certain amount of a perfect gas at two pressure p1andp2 are as shown in Fig. Show that p1 is less than p2.
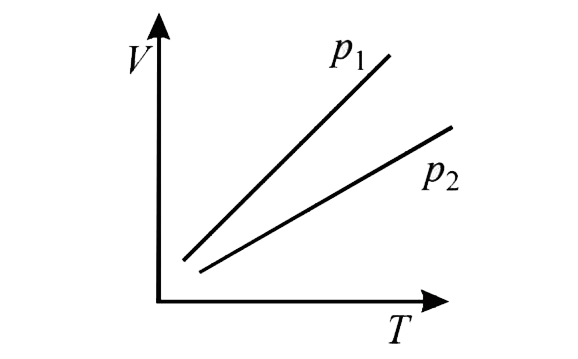
View SolutionThe volume V versus temperature T graphs for a certain amount of a perfect gas at two pressure p1andp2 are as shown in Fig. It follows from the graphs that p1 is greater than p2.

View SolutionFor the following concentration cell, to be spontancous Pt(H2)P1 atm. |HCl|Pt(H2)P2 atm which of the following is correct ?
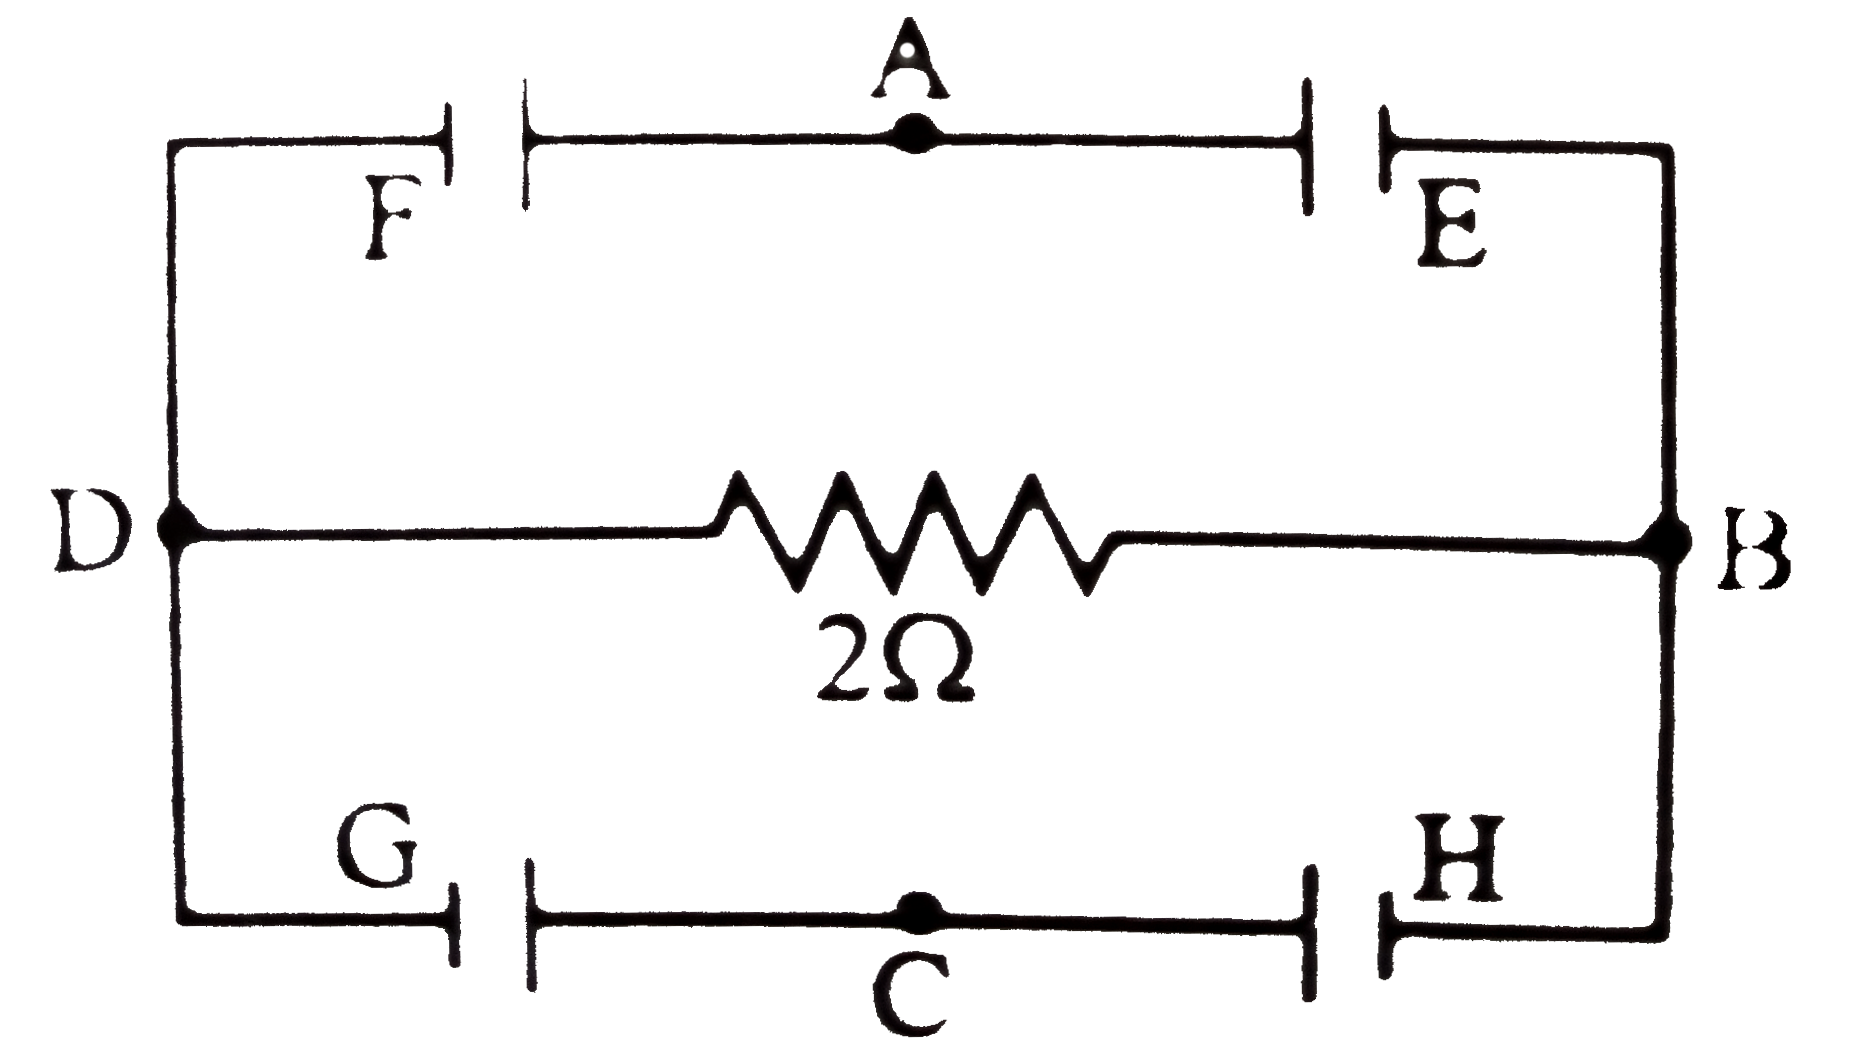
View SolutionIn the circuit shown E,F,G and H are cells of emf 2V,1V,3V and 1V respectively and their internal resistance are 2Ω,1Ω,3Ω and 1Ω respectively.
View Solution
