Show the variation of resistivity of Si with temperature in a graph.
Graph of resistivity of copper as a function of temperature is given alongside (resistivity of metals increases with increase in temperature).

Similar Questions
Knowledge Check
- Question 1 - Select One
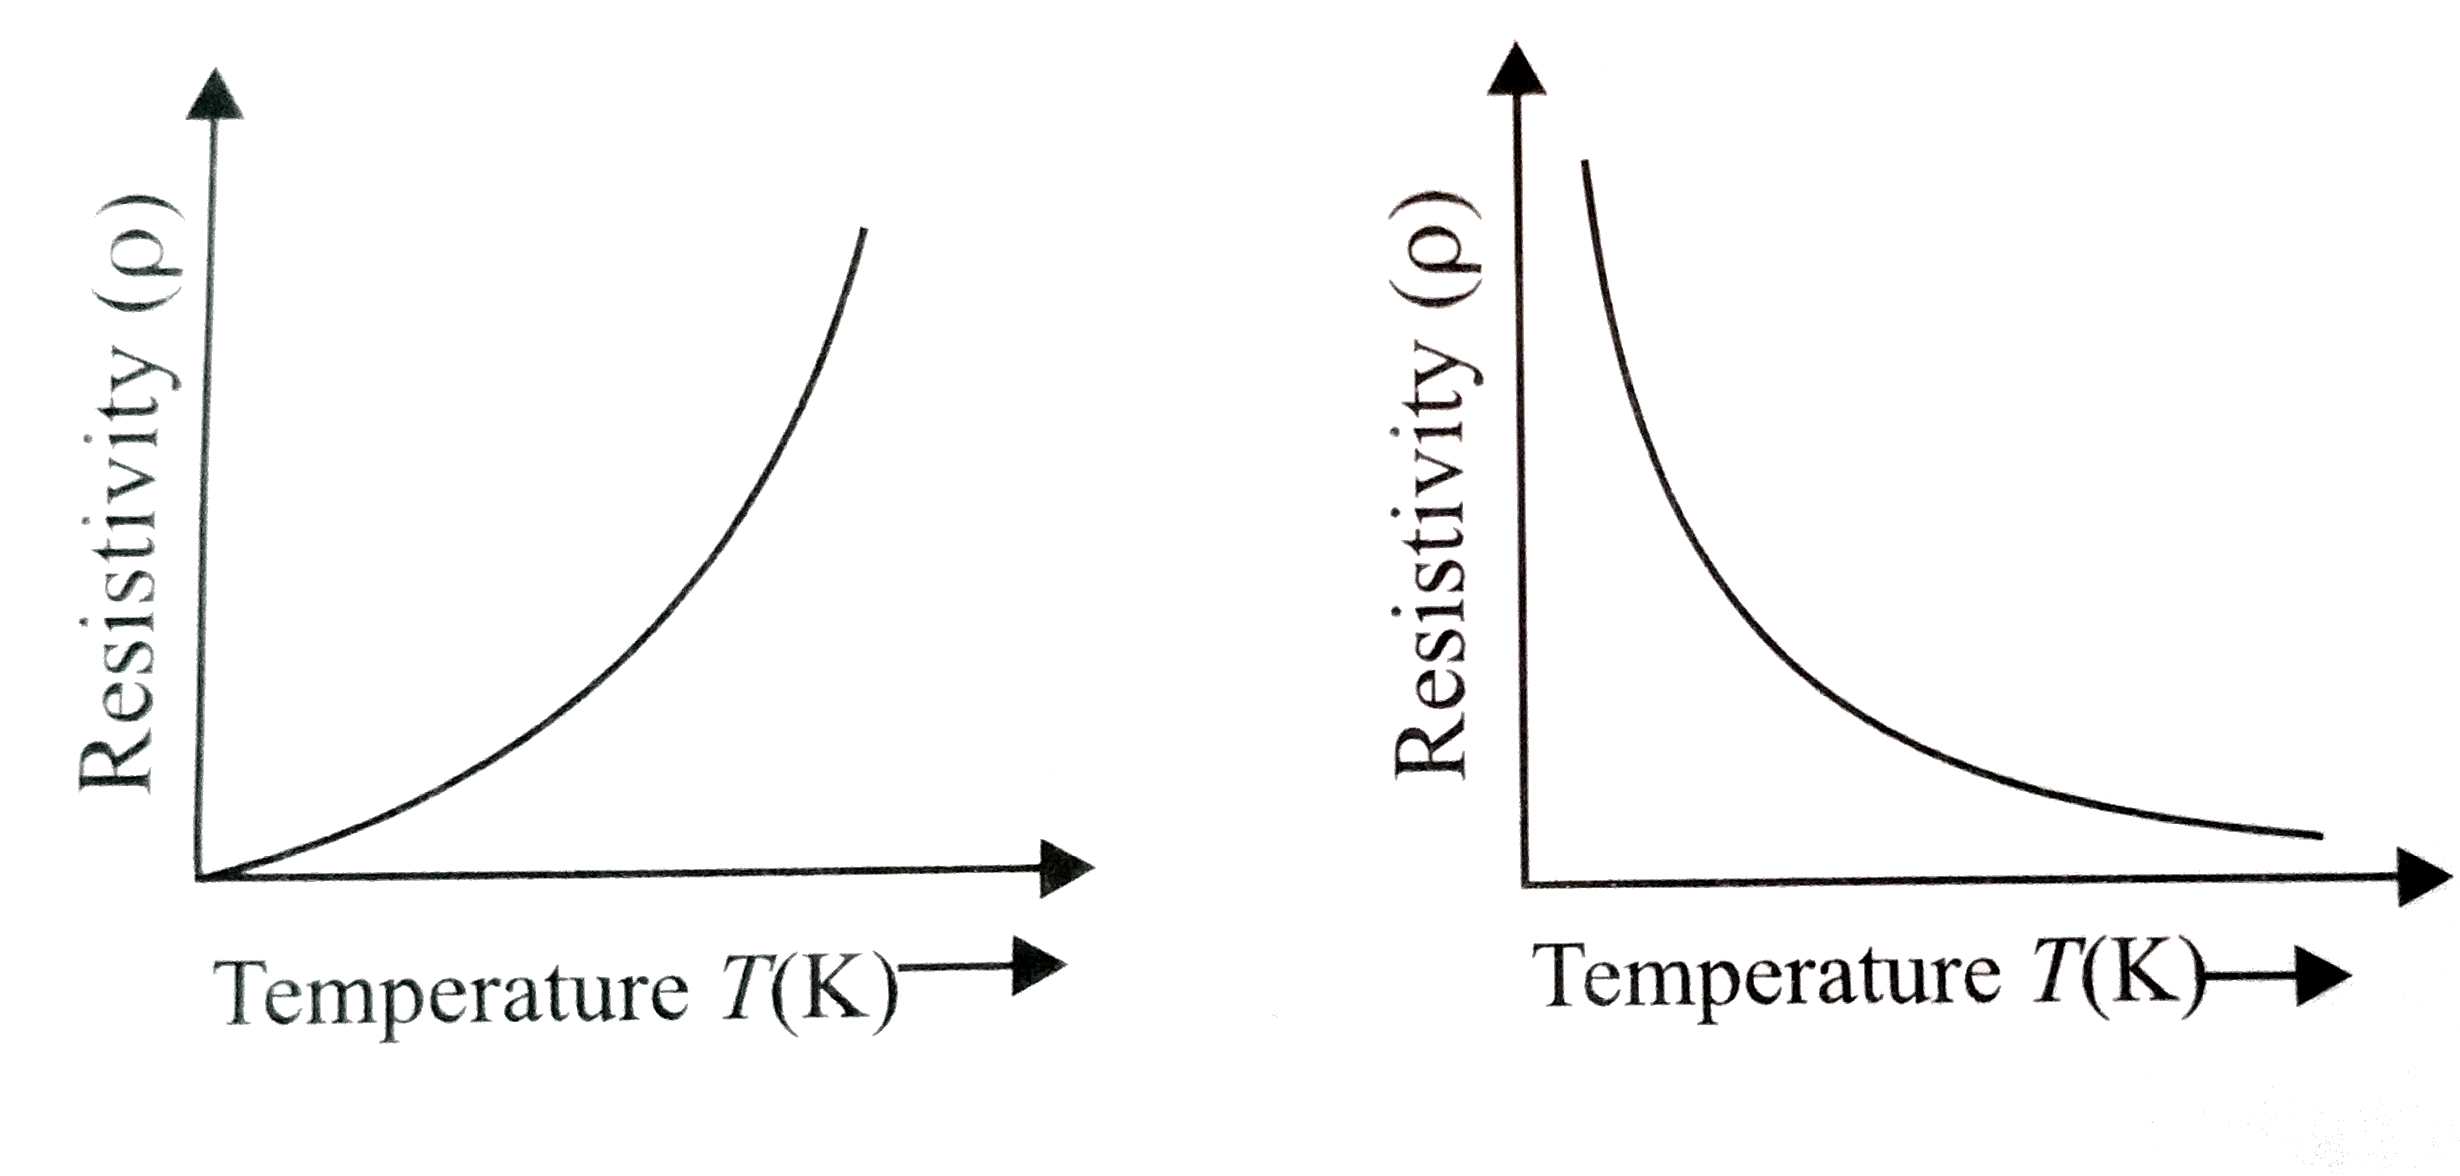
Figure (a) and figure (b) both are showing the variation of resistivity (p) with temperature (T) for some materials. Identify the types of these materials.
 AConductor and semiconductorBConductor and InsulatorCInsulator and semiconductorDBoth are conductor
Define resistivity of a conductor. Plot a graph showing the variation of resistivity with temperature for a metallic conductor. How does one explain such a behaviour, using the mathematical expression of the resistivity of a material
View SolutionDefine resistivity of a conductor. Plot a graph showing the variation of resistivity with temperature for a metallic conductor. How does one explain such a behaviour, using the mathematical expression of the resistivity of a material
View SolutionShow on a graph the variation of resistivity with temperature for a typical semiconductor
View SolutionShow on a graph, the variation of resistivity with temperature for a typical semiconductor.
View SolutionShow on a graph, the variation of resistivity with temperature for a typical semiconductor.
View SolutionDefine the term 'temperature coefficient of resistivity' . Write its S.I. unit. Plot a graph showing the variation of resistivity of copper with temperature.
View SolutionDraw a graph showing the variation of resistivity with temperature for nichrome. Which property of nichrome is used to make standard resistance coils?
View Solution

