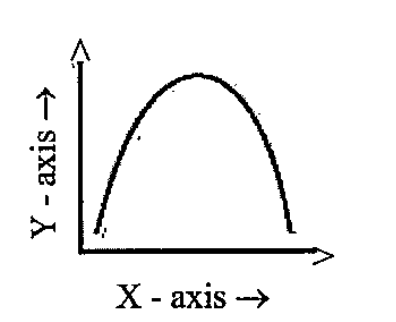
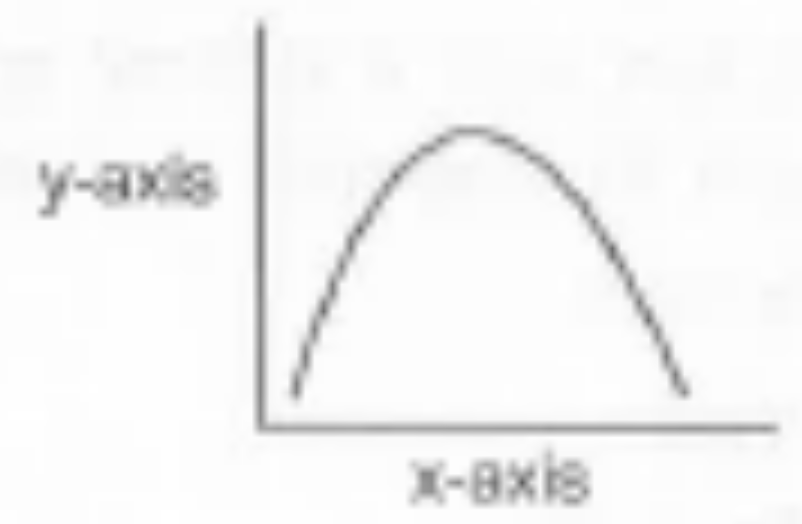
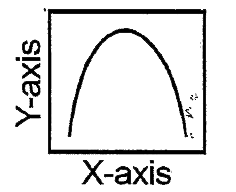
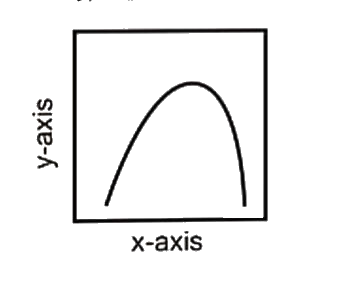
The curve given below shows enzymatic activity with relation to three conditions (pH, temperature and substrate concentration). What do the two axes (X and Y) represent?
 Solution in Tamil
Temperature - Enzyme activity
Substrate concentration - Enzymatic activity
Enzymatic-Temperature activity
Enzymatic - pH activity
Step by step video & image solution for The curve given below shows enzymatic activity with relation to three conditions (pH, temperature and substrate concentration). What do the two axes (X and Y) represent? by Biology experts to help you in doubts & scoring excellent marks in Class 12 exams.
Updated on:21/07/2023Topper's Solved these Questions
Similar Questions
‘Systema Naturae’ was written by
View SolutionOrgan of Jacobson' helps in
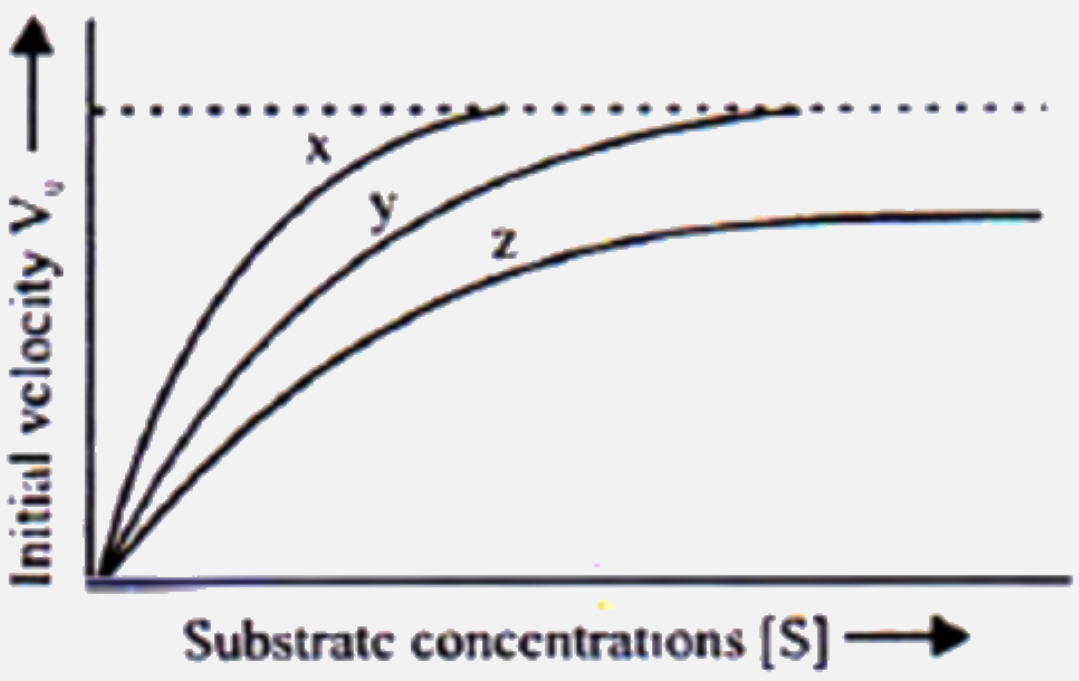
View SolutionFigure given below shows three velocity-substrate concentration curves for an enzyme reaxtion. What do the curves for an enzyme reaction. What do the curves depict
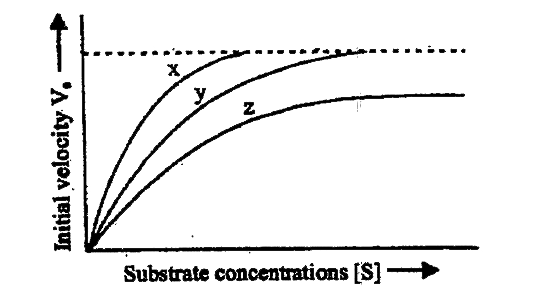
View SolutionThe Given figure shows three velocity-substrate concentration curves of an enzyme reaction. What do the curves X Y and Z depict respectively ?
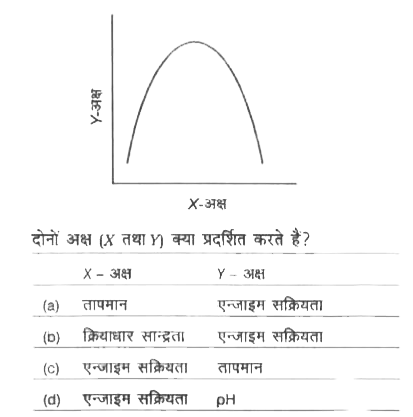
View Solutionनीचे दिए गया वक्र तीन परिस्थितियो (pH तापमान तथा क्रियाधार की सान्द्रता) के सम्बन्ध में एन्जाइम सक्रियता को दर्शाता है।
View SolutionWith the increase is substrate concentration the rate of enzymatic activity increases
View SolutionWhat is denoted by X and Y in the given graph?
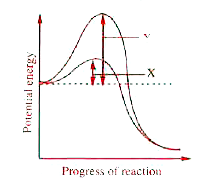
XY1) Activation energy without enzymeActivation energy with enzyme2) Activation energy with enzyme Activation energy without enzyme3) Substrate concentration with enzymeSubstrate concentration without enzyme4) Substrate concentration without enzymeSubstrate concentration with enzyme
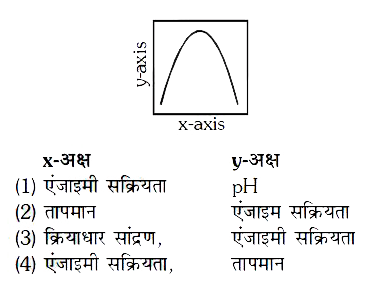
View Solutionनीचे दिखाये गये वक्र में तीन दशाओं (pH, तापमान तथा क्रियाधार सांद्रण) के संबंध के साथ एंजाइम-क्रिया दर्शायी गयी है। इसमें दो अक्षा (x तथा y) क्या दर्शाते हैं ?
View SolutionThe given curve shows enzymatic activity with relation to three conditions (pH, temperature & substrate concentration) What do the two axes (x & y) represent?
View SolutionThe given figure shows three velocity-substrate concentration curves for an enzyme reaction. What do the curves x, y and z depict respectively?
View SolutionThe curve given show enzymatic activity with relation to three conditions (pH, temp: and substrate conc.). What do the two axises (x and y) represent?
View SolutionFigure given below shows three velocity-substrate concentration curves for an enzyme reaxtion. What do the curves for an enzyme reaction. What do the curves depict
View SolutionThe Given figure shows three velocity-substrate concentration curves of an enzyme reaction. What do the curves X Y and Z depict respectively ?
View SolutionThe curve given below shows enzymatic activity with relation to three conditions (pH, temperature and substrate concentration). What does the two axis (x and y) represent ?
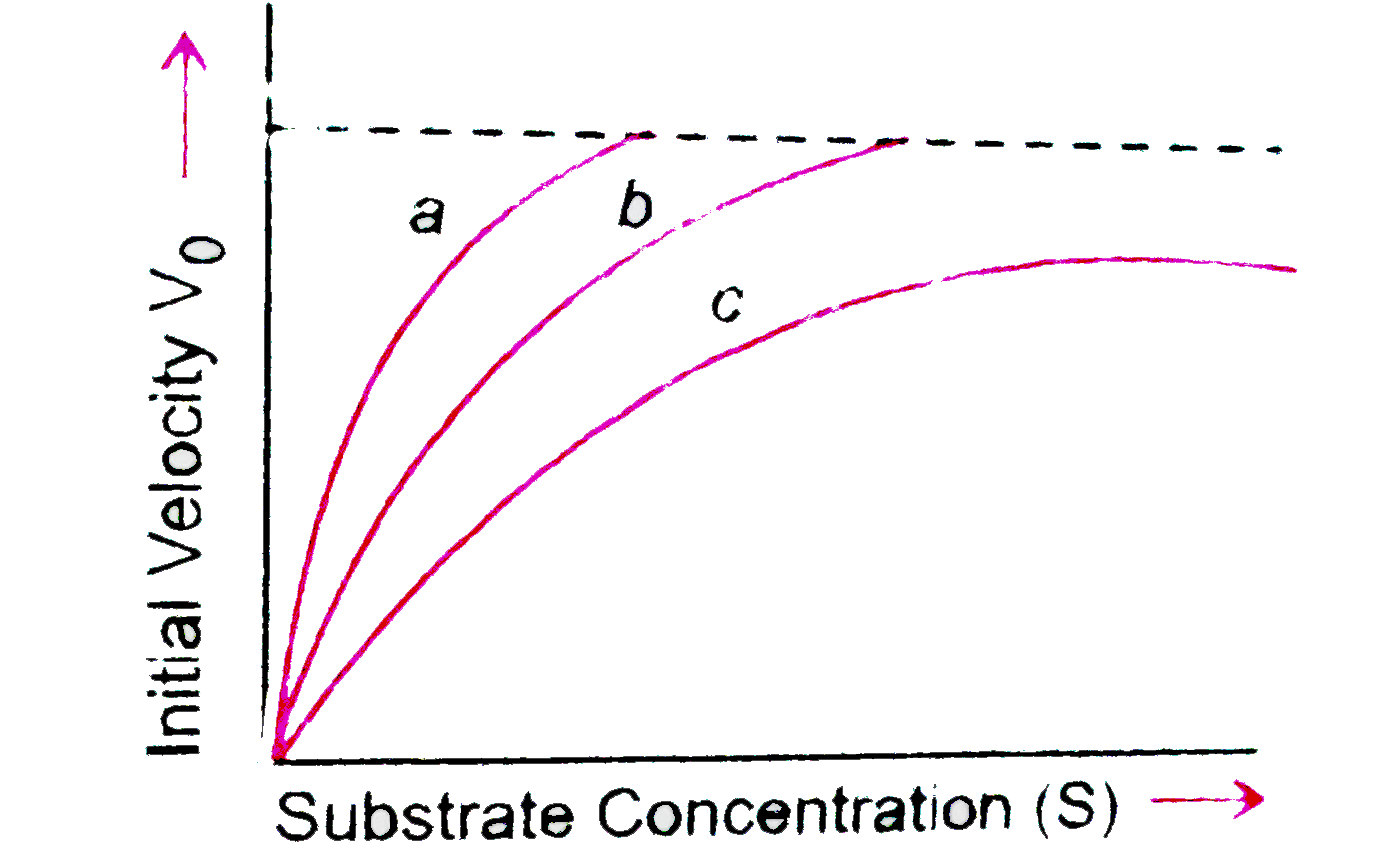
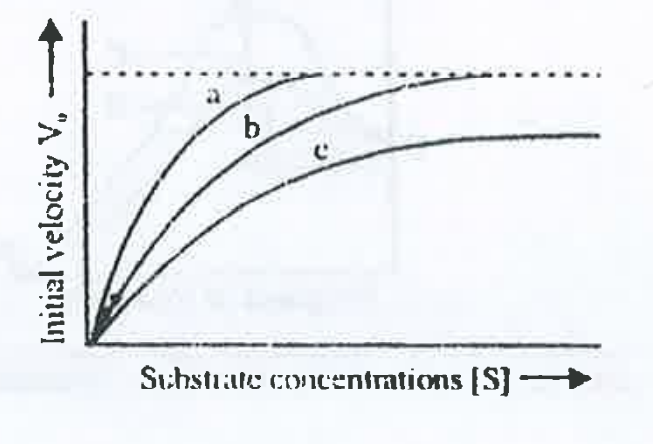
View SolutionThe figure given below shows three velocity -substrate concentration curves for an enzyme reaction. What do the curves a,b and c depit respectively ?
View SolutionThe curve below showns enzymatic acitvity in relation to three conditions (pH, temperature and substrate concentration).
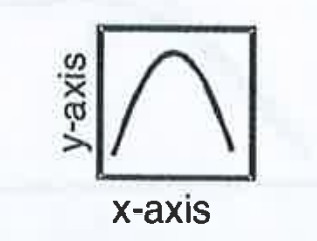
What do the axises (x and y) represent ?
View Solution
