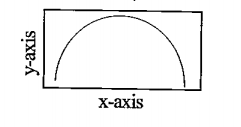
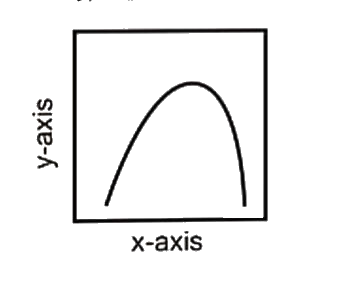
The curve given below show enzymatic activity with relation to three conditions (Ph, temperature and substrate concentration).What do the two axises ( x and y) represent? x - axis, y - axis.
 Solution in Tamil
Enzymatic activity Temperature
Enzymatic activity - pH
Temperature - Enzyme Activity
Substrate concentration - Enzymatic Activity
Step by step video & image solution for The curve given below show enzymatic activity with relation to three conditions (Ph, temperature and substrate concentration).What do the two axises ( x and y) represent? x - axis, y - axis. by Biology experts to help you in doubts & scoring excellent marks in Class 11 exams.
Updated on:21/07/2023Topper's Solved these Questions
Similar Questions
Differentiate haplontic and diplontic life cycle.
View SolutionFind out the floral formula for a bisexual flower with bract, regular, pentamerous, distinct calyx and corolla, superior ovary without bracteole.
View SolutionFigure given below shows three velocity-substrate concentration curves for an enzyme reaxtion. What do the curves for an enzyme reaction. What do the curves depict
View SolutionIn oxygen dissociation curve x-axis and y-axis represent
View SolutionThe Given figure shows three velocity-substrate concentration curves of an enzyme reaction. What do the curves X Y and Z depict respectively ?
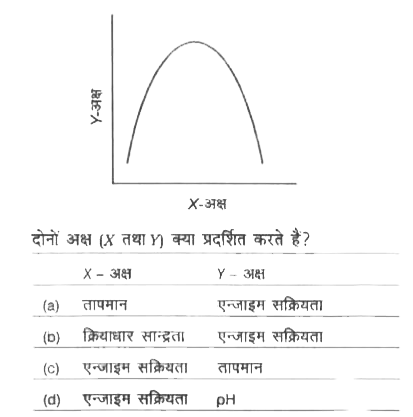
View Solutionनीचे दिए गया वक्र तीन परिस्थितियो (pH तापमान तथा क्रियाधार की सान्द्रता) के सम्बन्ध में एन्जाइम सक्रियता को दर्शाता है।
View SolutionWhat is denoted by X and Y in the given graph?
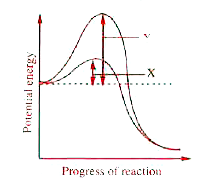
XY1) Activation energy without enzymeActivation energy with enzyme2) Activation energy with enzyme Activation energy without enzyme3) Substrate concentration with enzymeSubstrate concentration without enzyme4) Substrate concentration without enzymeSubstrate concentration with enzyme
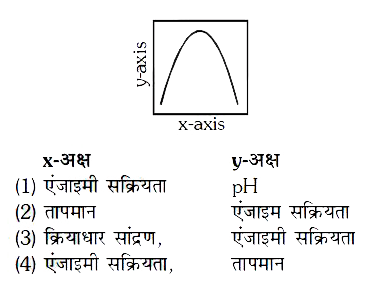
View Solutionनीचे दिखाये गये वक्र में तीन दशाओं (pH, तापमान तथा क्रियाधार सांद्रण) के संबंध के साथ एंजाइम-क्रिया दर्शायी गयी है। इसमें दो अक्षा (x तथा y) क्या दर्शाते हैं ?
View SolutionThe graph given below shows the distribution of biomes:
(a)What do the 'X' and 'Y' axis represent?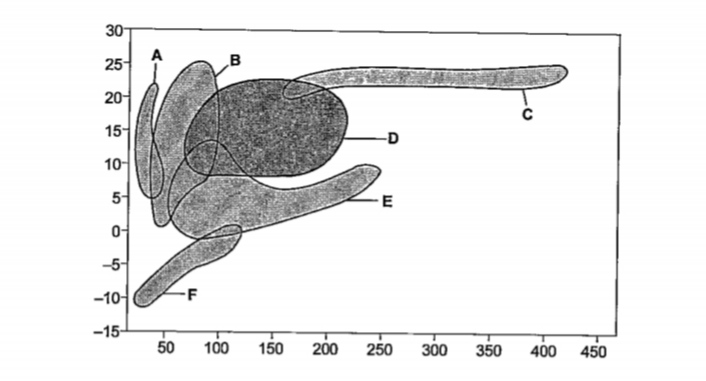
View SolutionThe given curve shows enzymatic activity with relation to three conditions (pH, temperature & substrate concentration) What do the two axes (x & y) represent?
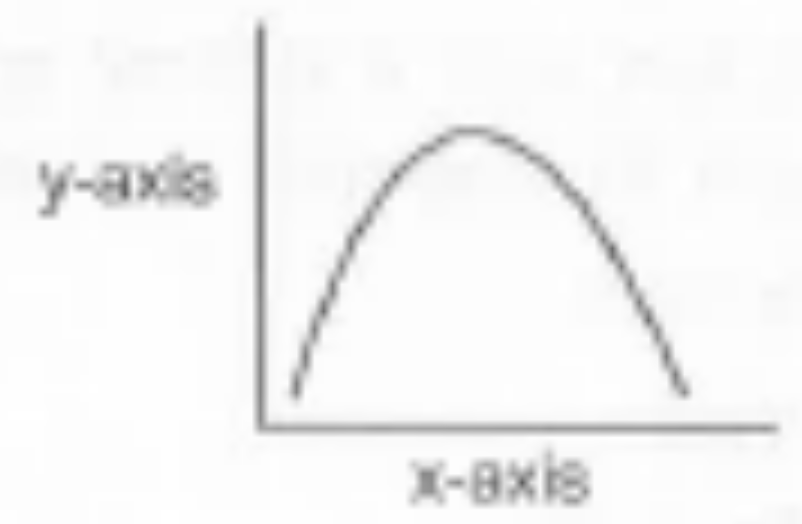
View SolutionThe given figure shows three velocity-substrate concentration curves for an enzyme reaction. What do the curves x, y and z depict respectively?
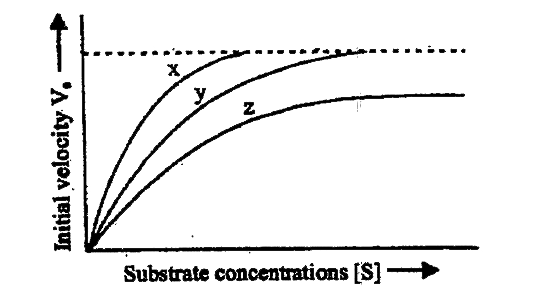
View SolutionThe curve given show enzymatic activity with relation to three conditions (pH, temp: and substrate conc.). What do the two axises (x and y) represent?
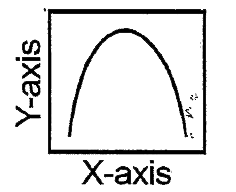
View SolutionFigure given below shows three velocity-substrate concentration curves for an enzyme reaxtion. What do the curves for an enzyme reaction. What do the curves depict
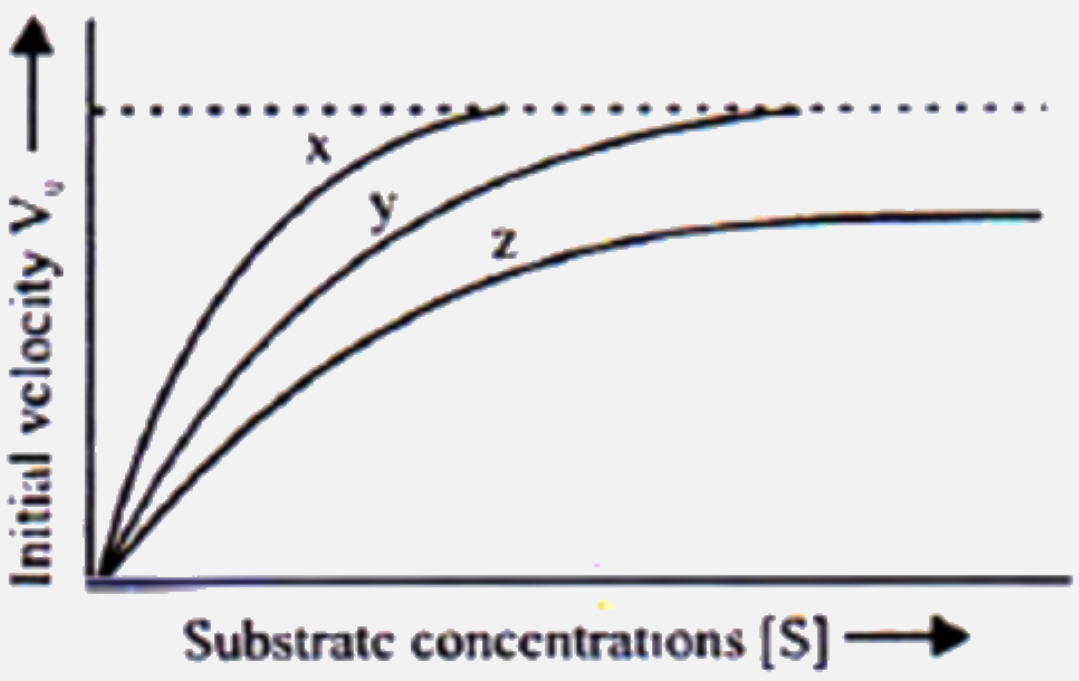
View SolutionThe Given figure shows three velocity-substrate concentration curves of an enzyme reaction. What do the curves X Y and Z depict respectively ?
View SolutionThe curve given below shows enzymatic activity with relation to three conditions (pH, temperature and substrate concentration). What does the two axis (x and y) represent ?
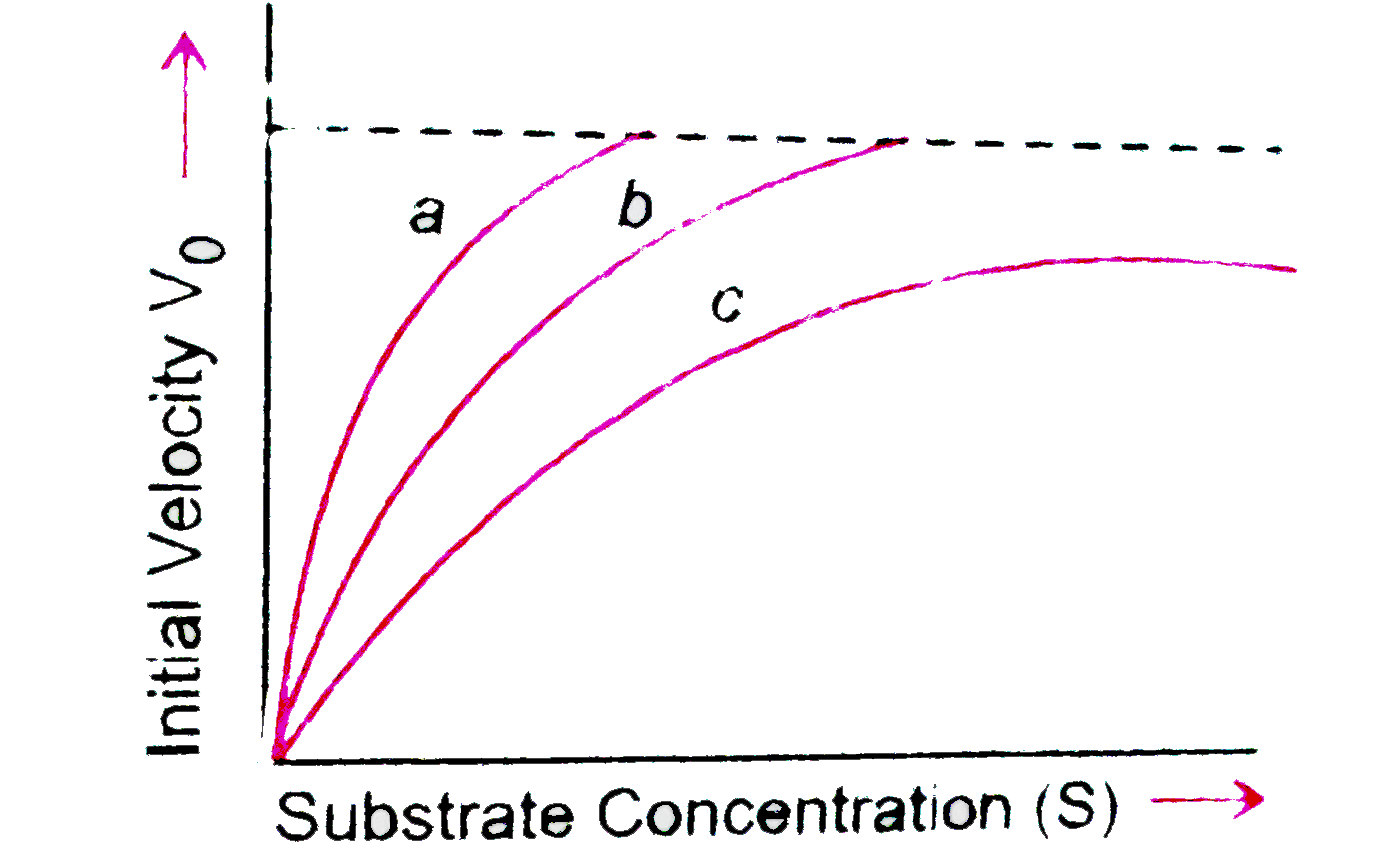
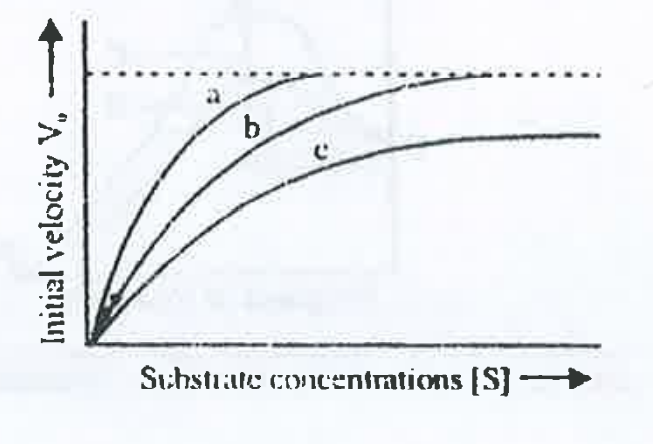
View SolutionThe figure given below shows three velocity -substrate concentration curves for an enzyme reaction. What do the curves a,b and c depit respectively ?
View Solution
