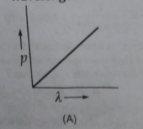
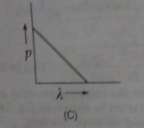
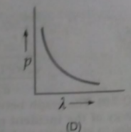
Which of following graphs correctly represents the variation of particle momentum with de-Broglie wavelength?Solution in Punjabi
 .
.
 .
.
 .
.
 .
.
Step by step video & image solution for Which of following graphs correctly represents the variation of particle momentum with de-Broglie wavelength? by Physics experts to help you in doubts & scoring excellent marks in Class 12 exams.
Updated on:21/07/2023Topper's Solved these Questions
Similar Questions
The photon of frequency v has a momntum associated with it .If c is the velocity of light,then momentum is
View SolutionTo get five images of a single object, one should have two plane mirrors at an angle of :
View SolutionProve that electromagnetic waves are transverse in nature.
View SolutionWhich of the following graphs correctly represents the variation of particle momentum with associated de Broglie wavelength?
View SolutionWhich of the following figure represents the variation of particle momentum and the associated de - Broglie wavelength ?
View SolutionWhich of following graphs correctly represents the variation of particle momentum with de-Broglie wavelength?
View SolutionWhich of the following figures represent the variation of particle momentum and the associated de Broglie wavelength?
View SolutionRepresent graphically Variation of the de-Broglie wavelenght with linear momentum of a particle.
View SolutionThe graph showing the correct variation of linear momentum (p) of a charge particle with its de-Broglie wavelength (λ) is
View SolutionDraw a graph showing variation of de-Broglie wavelength with the momentum of an electron.
View SolutionWhich of the following graph represent the variation of particle momentum and associated de Broglie wavelength?
View SolutionWhich of following graphs correctly represents the variation of particle momentum with de-Broglie wavelength?
View SolutionWhich of the following figures represents the variation of particle momentum and associated de-Broglie wavelength
View SolutionWhich of the following figure represents the variation of particle momentum and the associated de - Broglie wavelength ?
View SolutionWhich of the following graph represent the variation of particle momentem and the associated de Broglie wavelength
View SolutionWhich of the following figure represents the variation of particle momentum (P) and associated de Broglie wavelength (lambda) ?
View Solution
