line chart given below gives information about total number of people in ('00) who visited statue of liberty in five days of week and table given tells about ratio of male to female who visited statue of liberty in these five days.
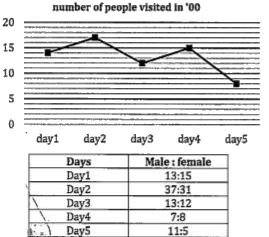
What is the ratio of average number of females who visited on day1, day2 and day4 to average number of males who visited on day2 and day4?
65:62
63:62
62:65
62:61
The correct Answer is:C
Step by step video, text & image solution for line chart given below gives information about total number of people in ('00) who visited statue of liberty in five days of week and table given tells about ratio of male to female who visited statue of liberty in these five days. What is the ratio of average number of females who visited on day1, day2 and day4 to average number of males who visited on day2 and day4? by Maths experts to help you in doubts & scoring excellent marks in Class 14 exams.
Topper's Solved these Questions
- BOOK - ADDA247CHAPTER - DATA INTERPRETATIONEXERCISE - Prelims Questions (Level-2)59videos
DATA INTERPRETATION
- BOOK - ADDA247CHAPTER - DATA INTERPRETATIONEXERCISE - Mains Questions33videos
DATA INTERPRETATION
- BOOK - ADDA247CHAPTER - DATA INTERPRETATIONEXERCISE - Basic Questions30videos
DATA INTERPRETATION
- BOOK - ADDA247CHAPTER - BOAT AND STREAM EXERCISE - Previous Year Question22videos
BOAT AND STREAM
- BOOK - ADDA247CHAPTER - DATA SUFFICIENCY EXERCISE - PREVIOUS YEAR QUESTIONS25videos
DATA SUFFICIENCY
Similar Questions
Knowledge Check
- Question 1 - Select One
The Bar graph given below presents the number of males and females working in five different companies.
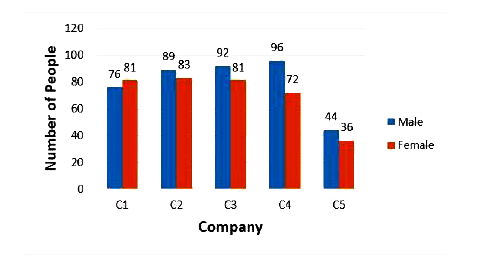
What is the ratio of the total number of males working in the Companies C2 and C3 to the total number of females working in C1 and C5 ?A171:136B181:117C182:119D183:124 - Question 2 - Select One
The Bar graph given below presents the number of males and females working in five different companies.
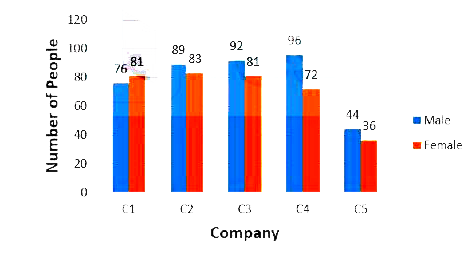
What is the average number of females working per company ?A72.2B70.6C71.8D74.6 - Question 3 - Select One
The following bar-diagram shows total number of males and females in five different organisations. Study it carefully to answer the questions.
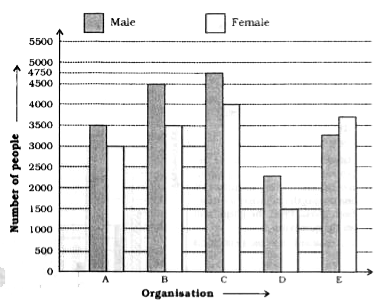
What is the ratio of average number of females from the organisations A, B and C to the average number of males from the organisations C, D and E?A42:41B41:42C40:41D41:40
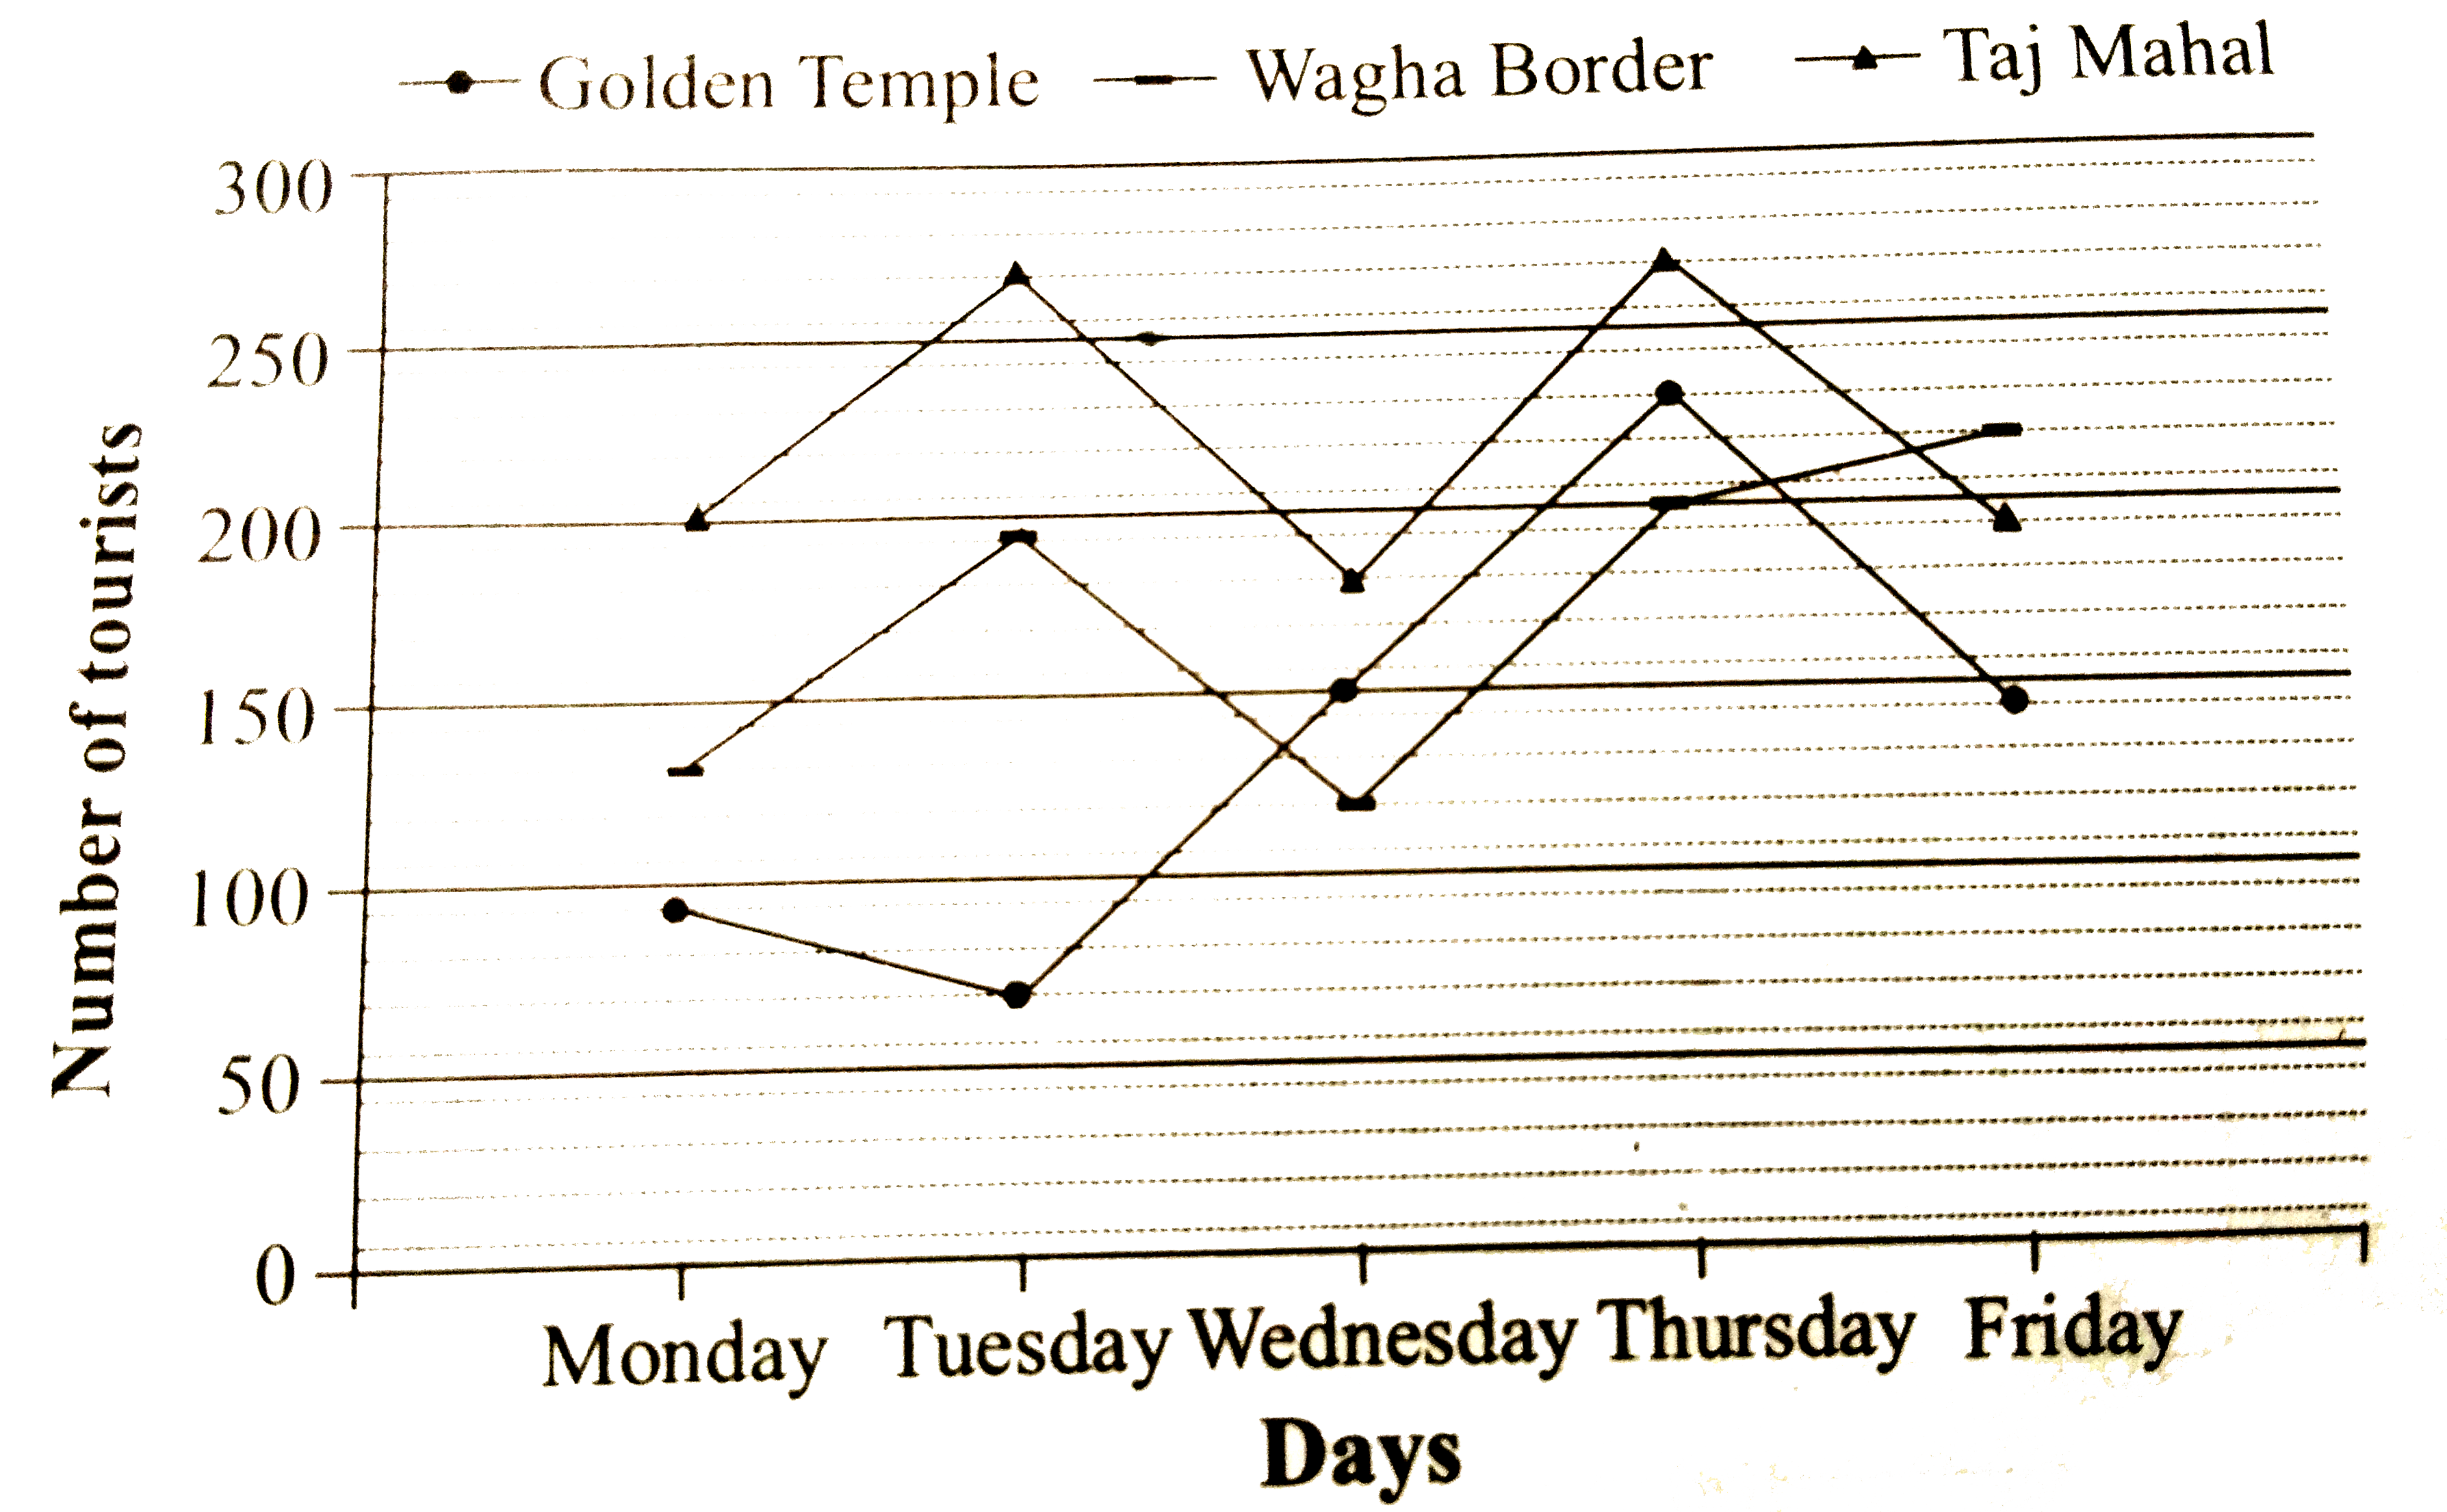
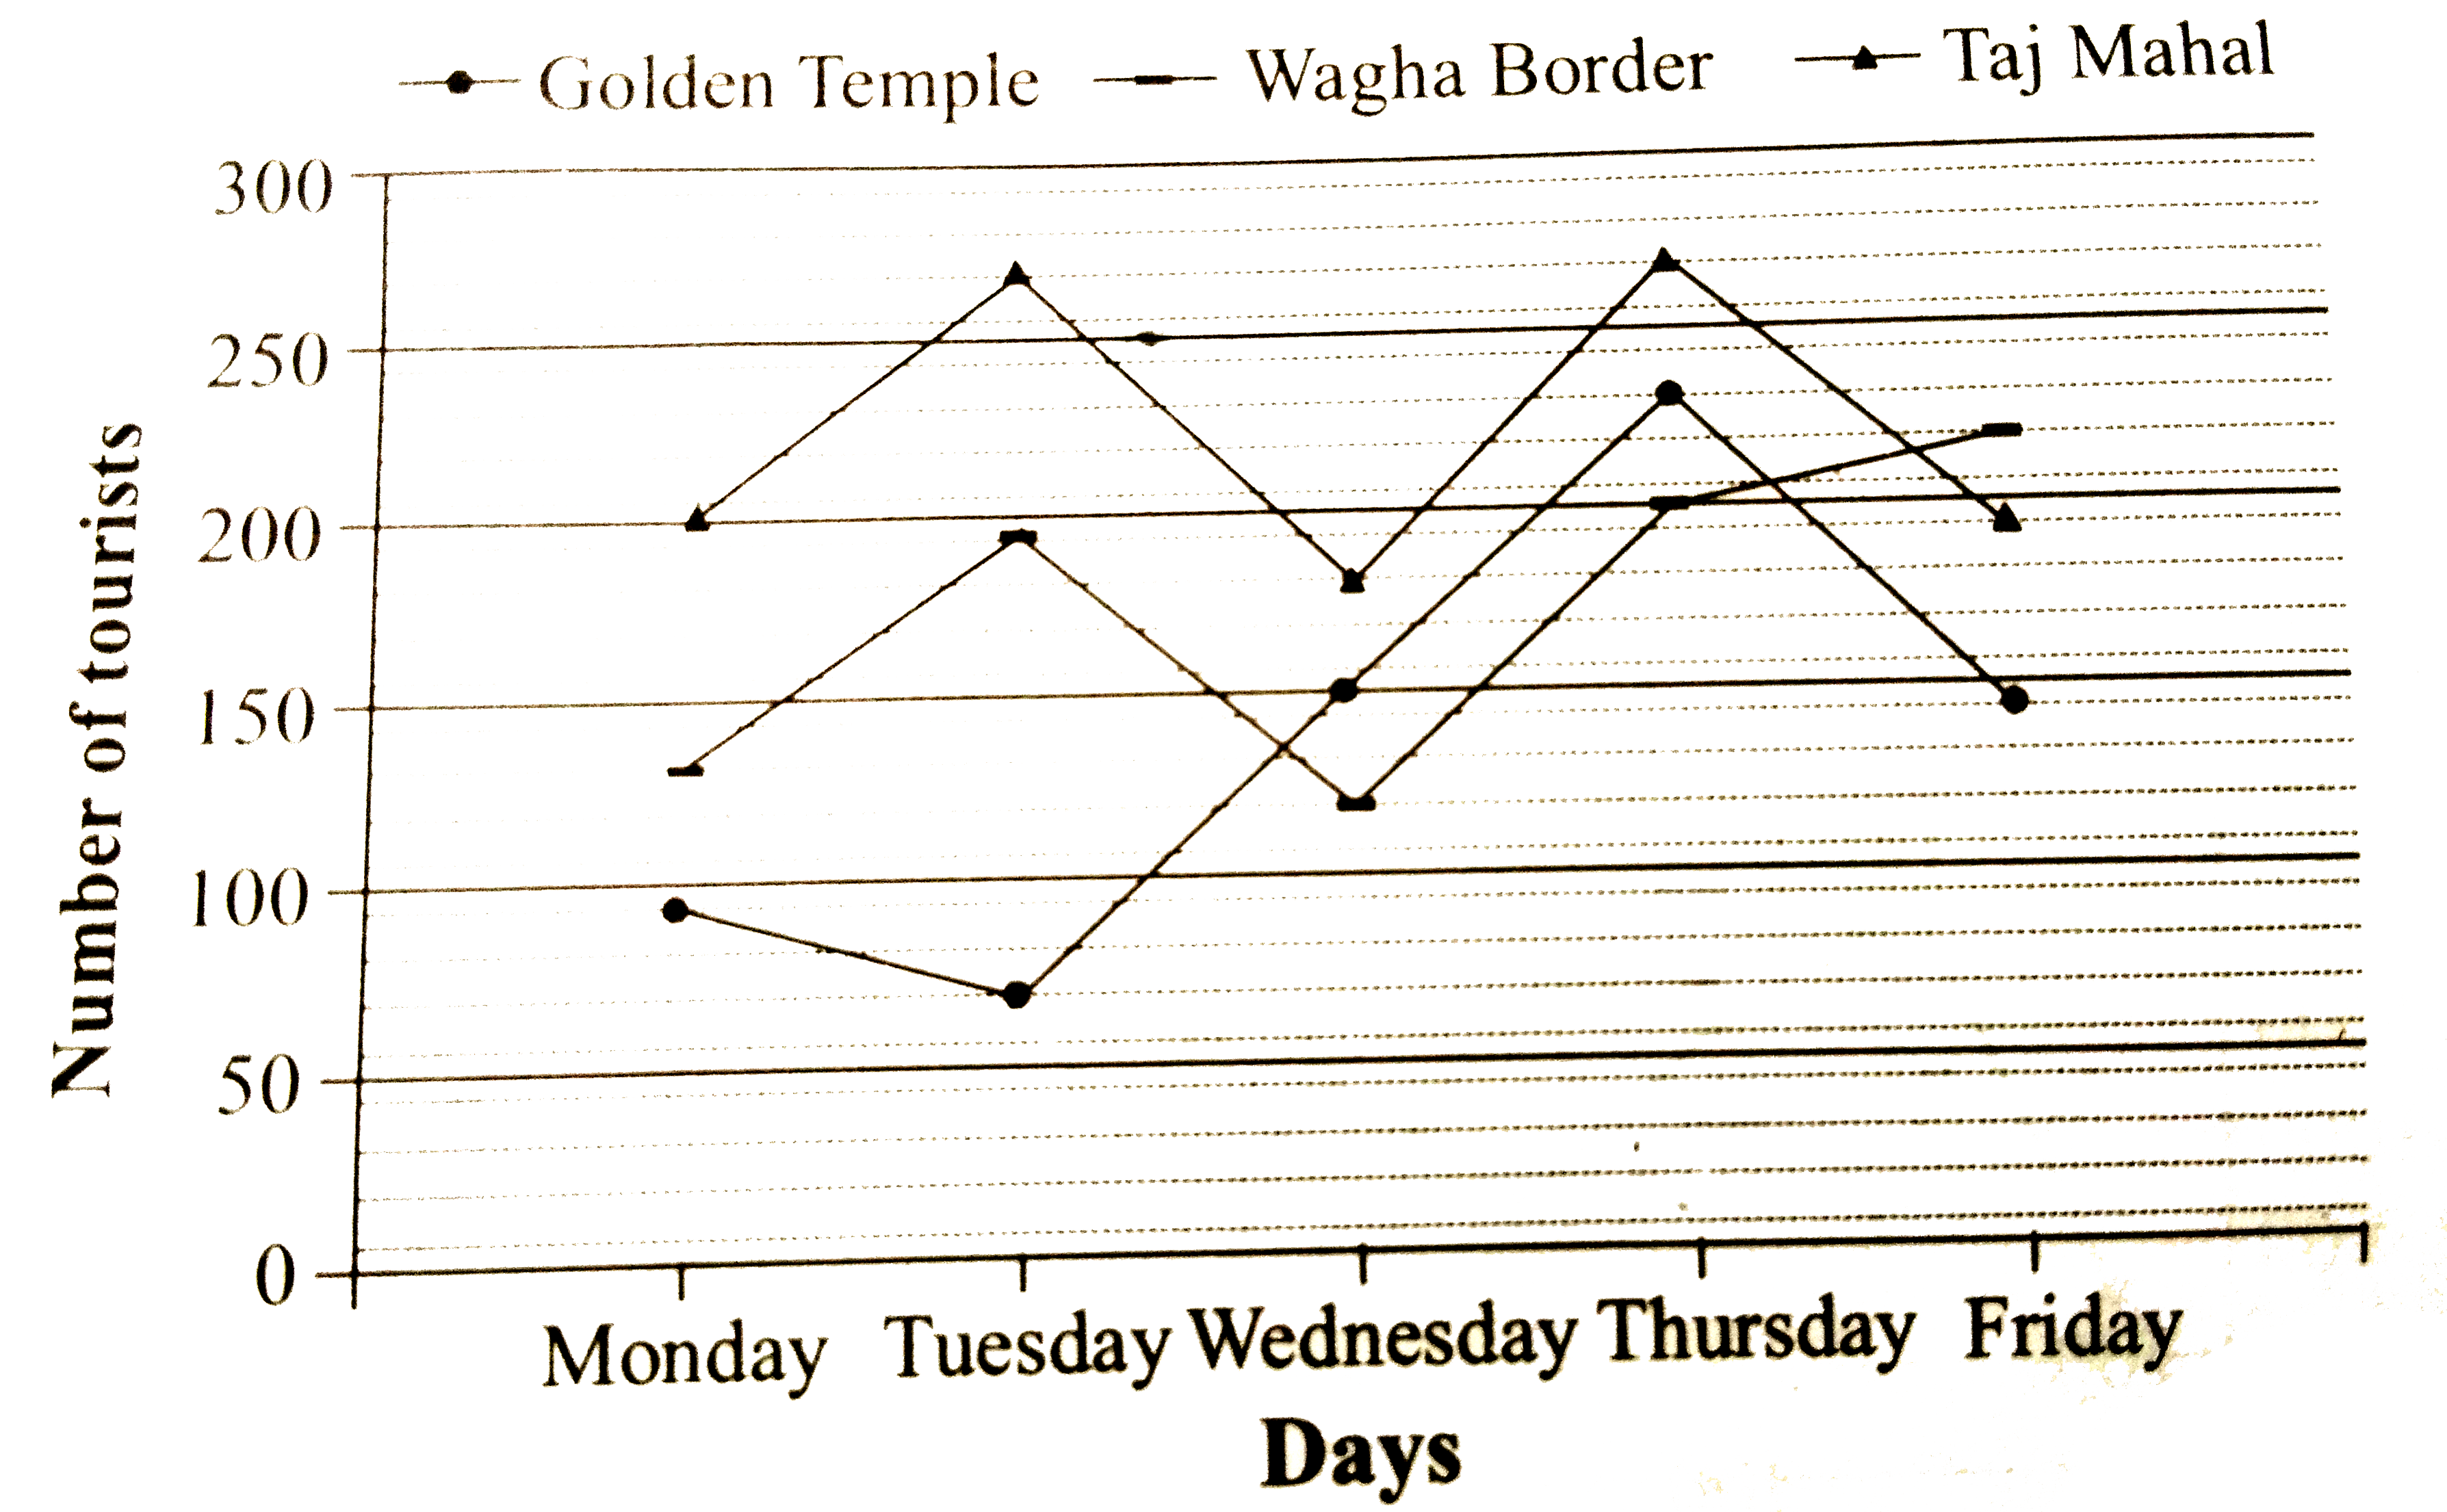
What is the respective ratio between the number of foreign tourists who visited Taj Mahal on Thursday and the number of foreign tourists who visited Golden Temple on Friday ?View SolutionAnswer the questions based on the information given below:
The given cascade bar graph provides the information about the number of girls and boys participated in a dance competition of NH Goel school on five different days of a week and the table give the details about the percentage of students participated on different days who lost the competition.
Total number of students participated in a day = Number of girls participated in a day + Number of boys participated in a day
Total number of students participated = Total number of students who lost the competition participated + Total number of students who won the competition participated
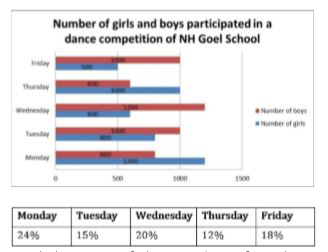
Find the ratio of the number of students who lost the competition on Tuesday to the number of students who won the competition on Wednesday.View SolutionAnswer the questions based on the information given below:
The given cascade bar graph provides the information about the number of girls and boys participated in a dance competition of NH Goel school on five different days of a week and the table give the details about the percentage of students participated on different days who lost the competition.
Total number of students participated in a day = Number of girls participated in a day + Number of boys participated in a day
Total number of students participated = Total number of students who lost the competition participated + Total number of students who won the competition participated
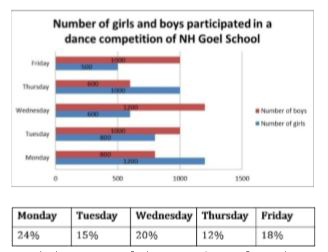
Find the ratio between the number of students who won on Wednesday to the number of students who won on ThursdayView SolutionStudy the following piechart and table carefully to answer the questions that follow.
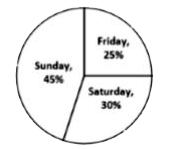
Percentage of visitors (male and female) in a museum on the given 3 days-Friday, Saturday and Sunday is depicted in the pie chart given below.
Total number of visitors on the given three days = 400
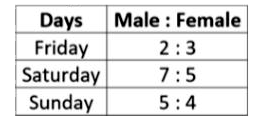
Ratio of male visitors to female visitors on the given three days is depicted in the table given below:
On Tuesday, the number of female visitors was 1/5 more than that of Saturday. If the respective ratio between the number of male visitors and that of female visitors on Tuesday is 11 : 6, then what was the total number of visitors (male and female) on Tuesday?View SolutionStudy the following piechart and table carefully to answer the questions that follow.
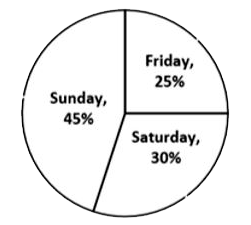
Percentage of visitors (male and female) in a museum on the given 3 days-Friday, Saturday and Sunday is depicted in the pie chart given below.
Total number of visitors on the given three days = 400
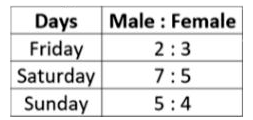
Ratio of male visitors to female visitors on the given three days is depicted in the table given below:
The number of female visitors on Friday was what percentage of the number of female visitors on Sunday?View Solution


