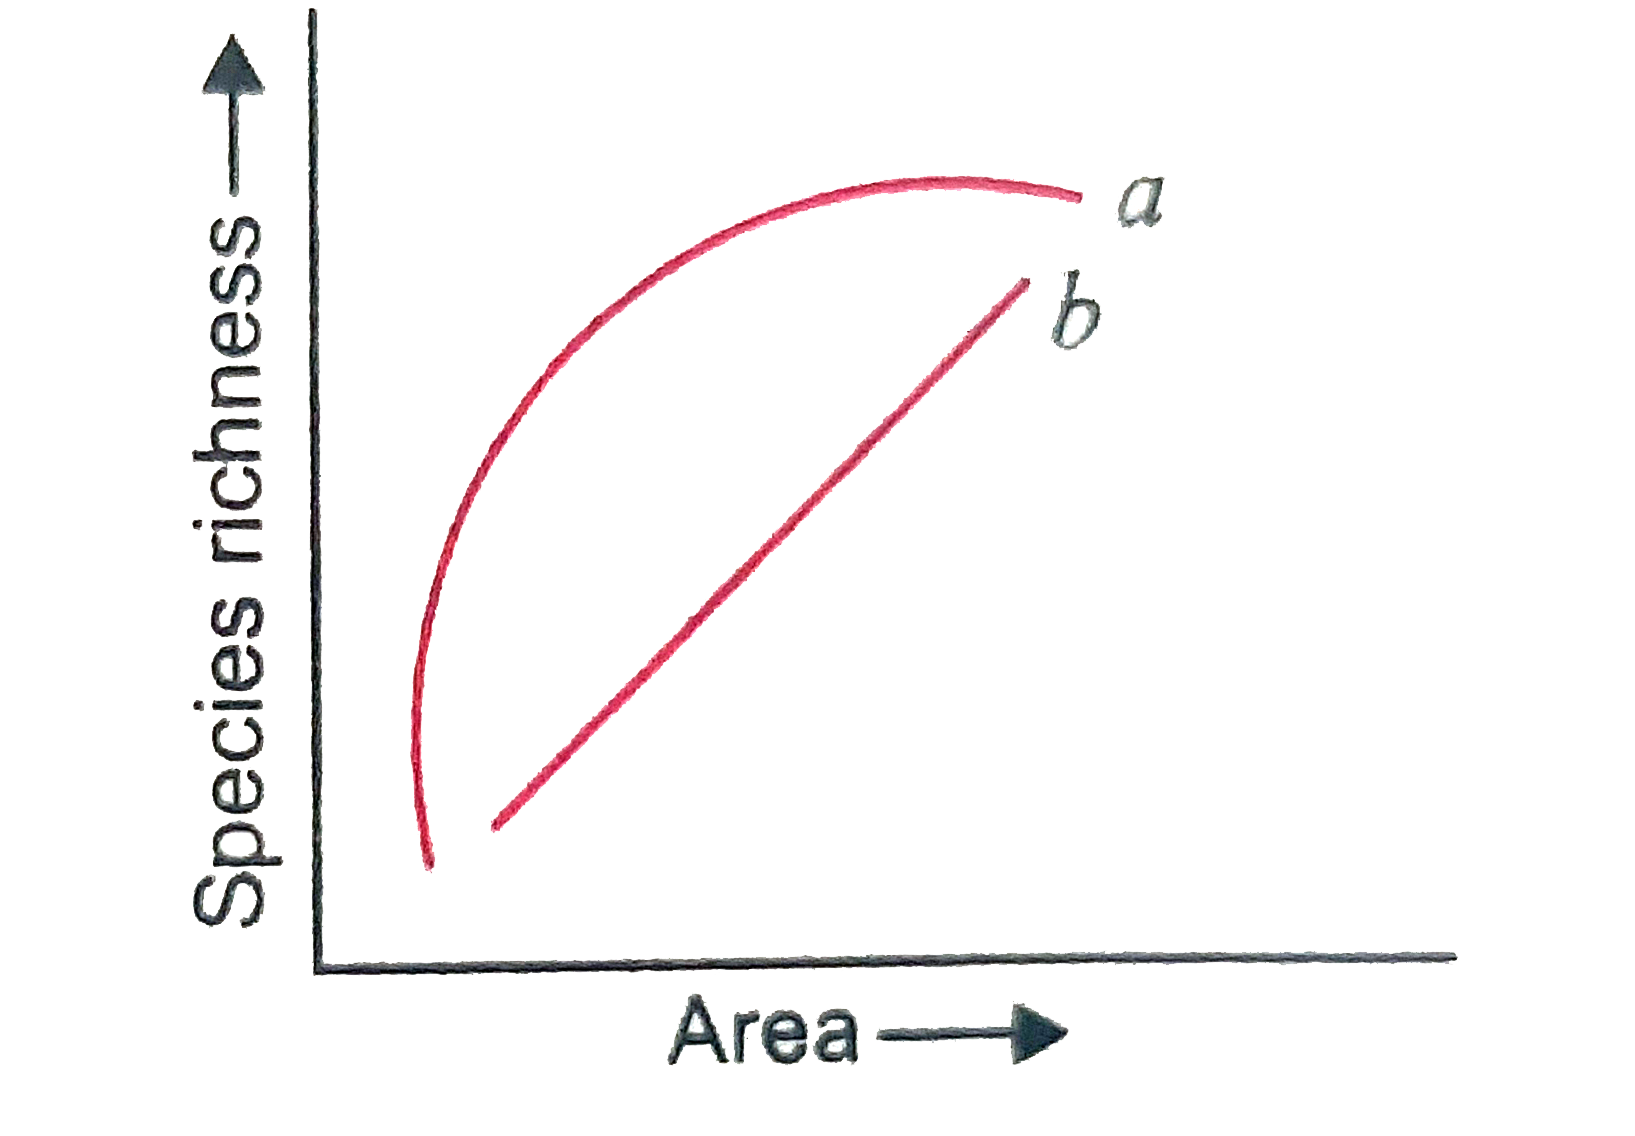
The graph given below shows species-area relationship of a certain region.
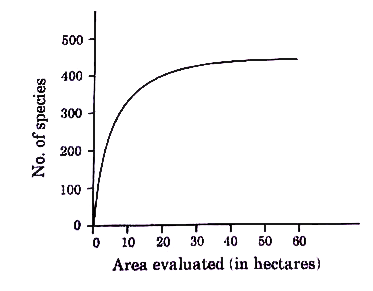
Study the graph and explain what it represents.
Step by step video & image solution for The graph given below shows species-area relationship of a certain region. Study the graph and explain what it represents. by Biology experts to help you in doubts & scoring excellent marks in Class 12 exams.
Updated on:21/07/2023Topper's Solved these Questions
- QUESTION PAPER 2022 SET-3BOOK - XII BOARDS PREVIOUS YEARCHAPTER - QUESTION PAPER 2022 SET-3EXERCISE - SECTION C
8 Videos
- QUESTION PAPER 2022 SET-3BOOK - XII BOARDS PREVIOUS YEARCHAPTER - QUESTION PAPER 2022 SET-3EXERCISE - SECTION C
8 Videos
- QUESTION PAPER 2022 SET-2BOOK - XII BOARDS PREVIOUS YEARCHAPTER - QUESTION PAPER 2022 SET-2EXERCISE - SECTION C
2 Videos
- QUESTION PAPER 2022 TERM 1 SET 1BOOK - XII BOARDS PREVIOUS YEARCHAPTER - QUESTION PAPER 2022 TERM 1 SET 1EXERCISE - SECTION-C
12 Videos
Similar Questions
Knowledge Check
Species area relationship was given by
AAlexander von HumboldtBPaulCMayerDBoth (a) and (b)Species-Area relationship was given by
ABritish zoologist and geographer David TilmanBGerman botanist and geographer Alexander von HumboldtCGerman naturalist and geographer Alexander von HumboldtDBritish naturalist and geographer Alexander von HuboldtSpecies area relationship was given by :-
ARobert constranzaBAlexander von humboldtCAlexander flemmingDStamford ecologist Paul Ehrlich
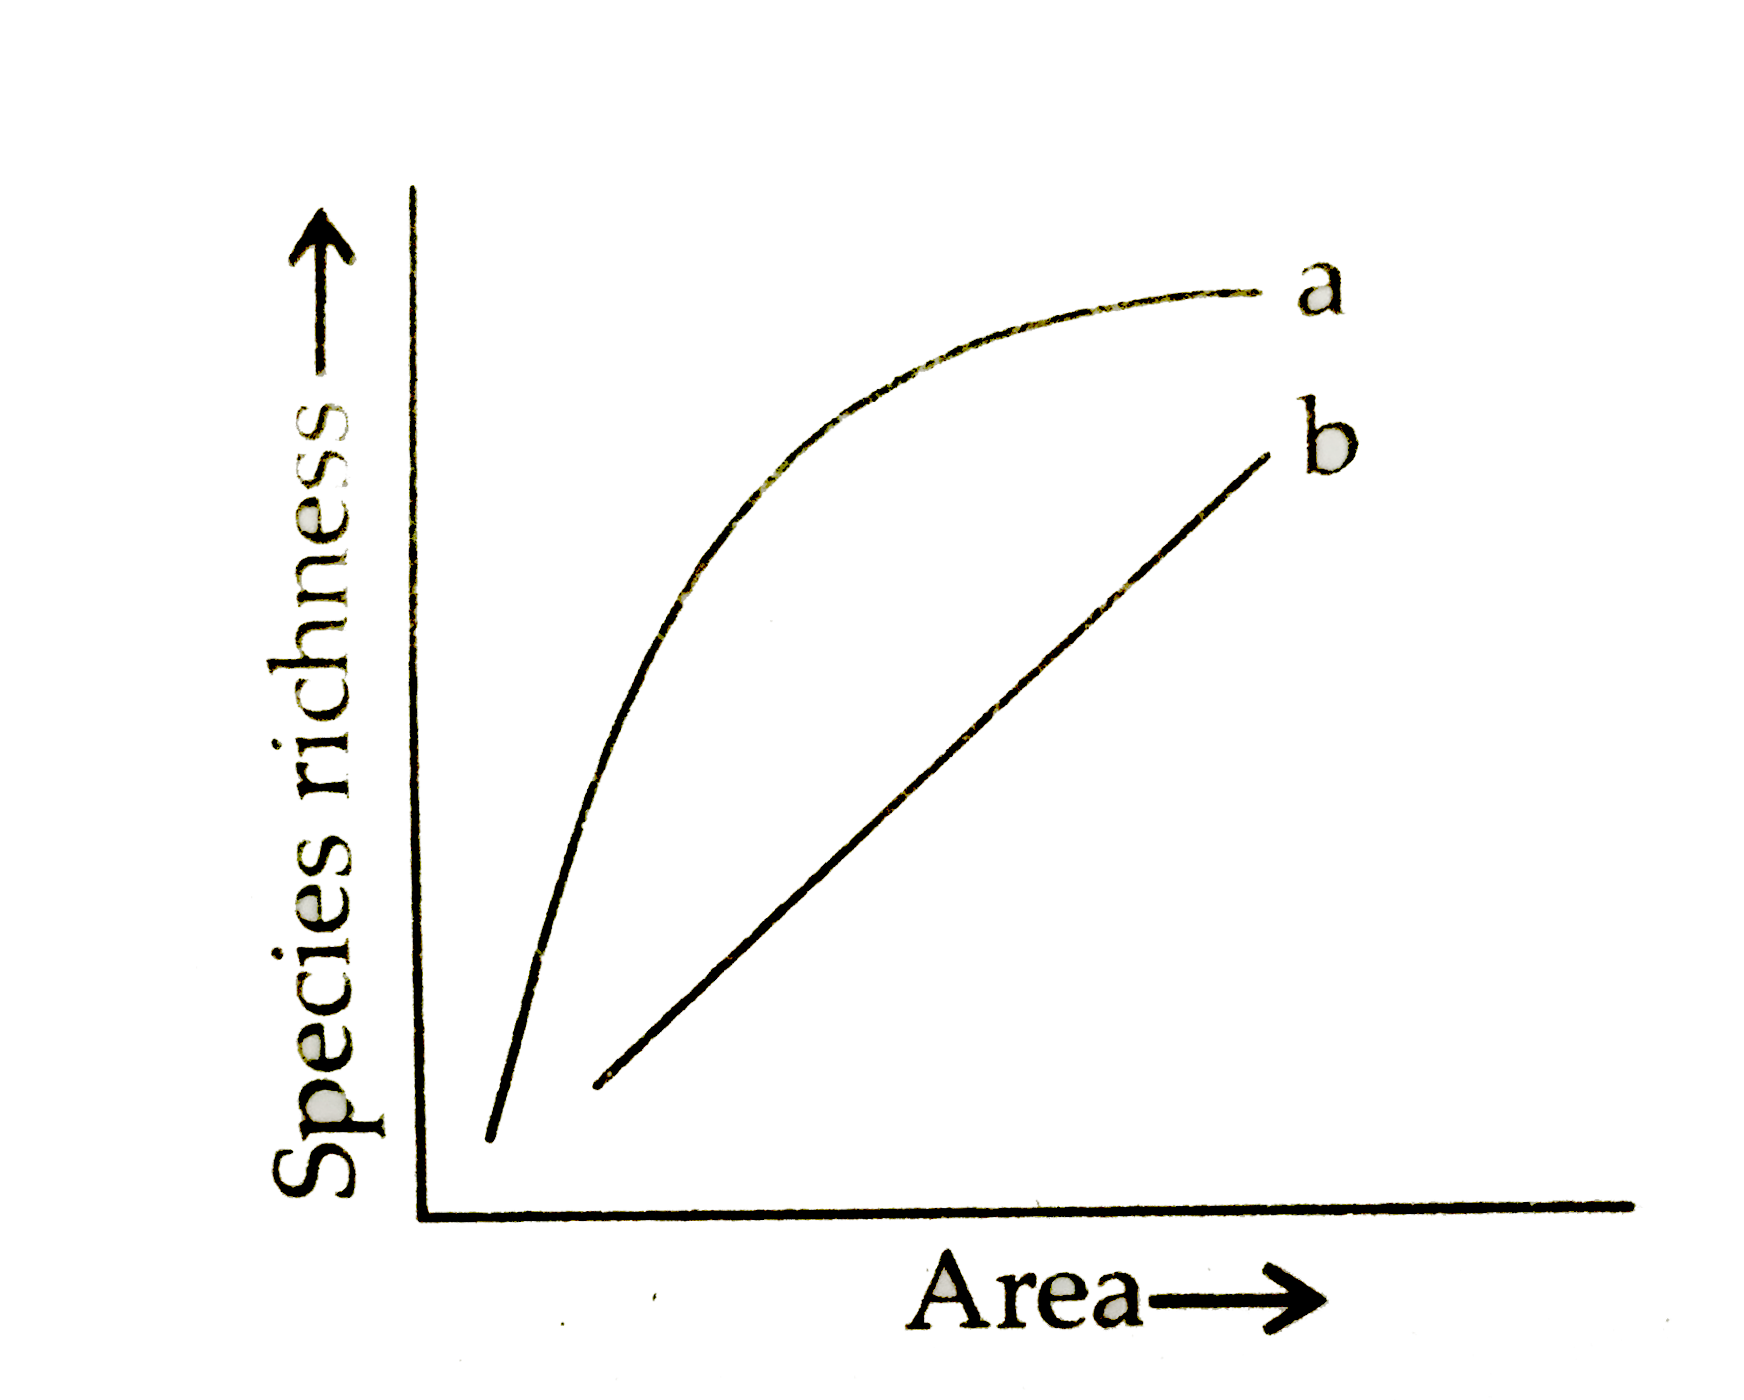
The above graph show Species-Area relationship. Write the equation of the curve a and explain.
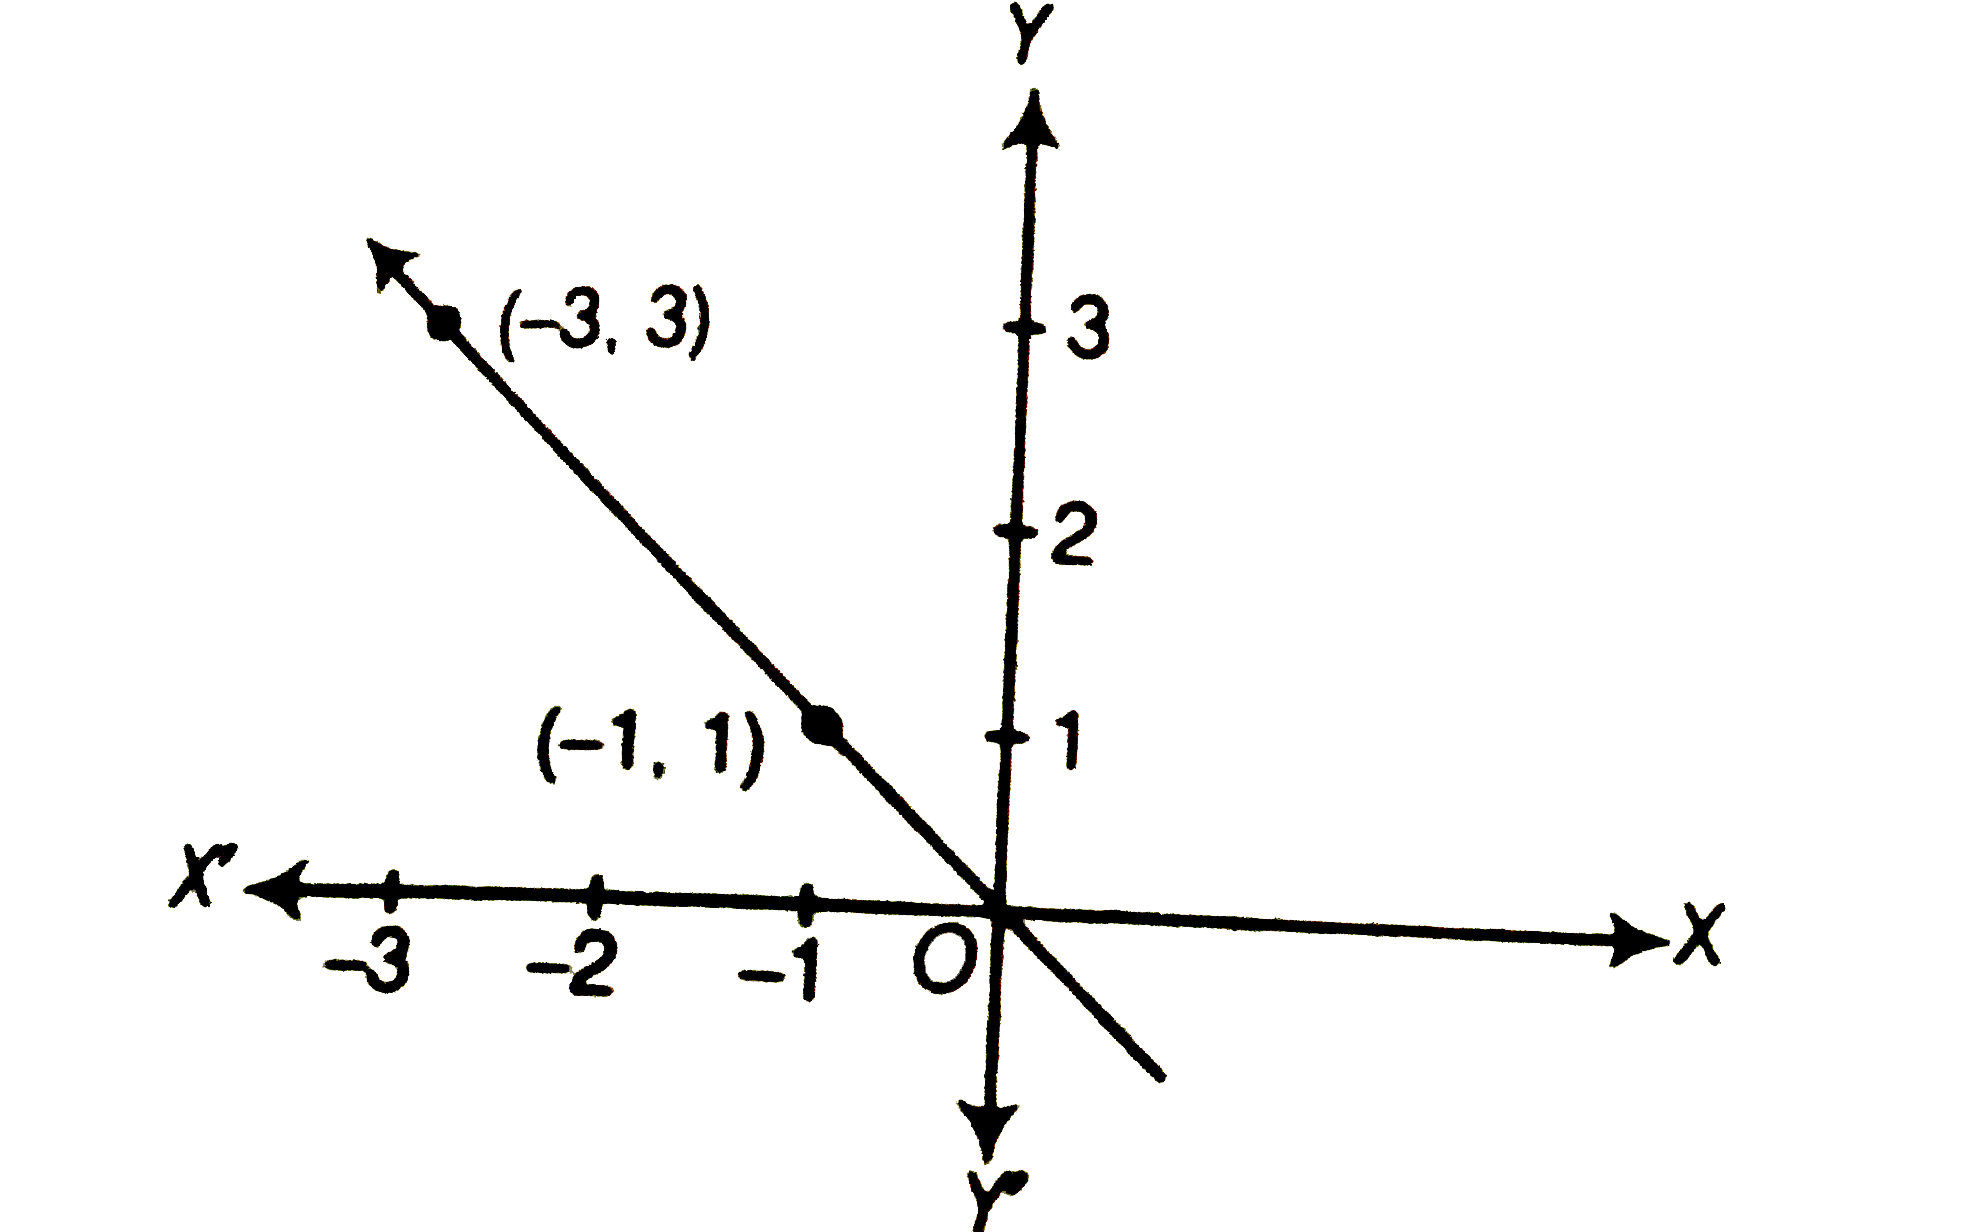
View SolutionThe graph given below represents the linear equation x+y=0.
View SolutionThe bar graph given below represents the circulation of newspapers in different languages in a town. Study the bar graph and answer the following questions:

What is the circulation of English newspaper?
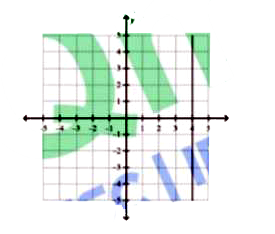
View SolutionThe equation of the graph given below is
View SolutionThe graph below shows the relationships of per capita population growth rate (r), fecundity (b) and age at first reproduction (α) in an animal speies
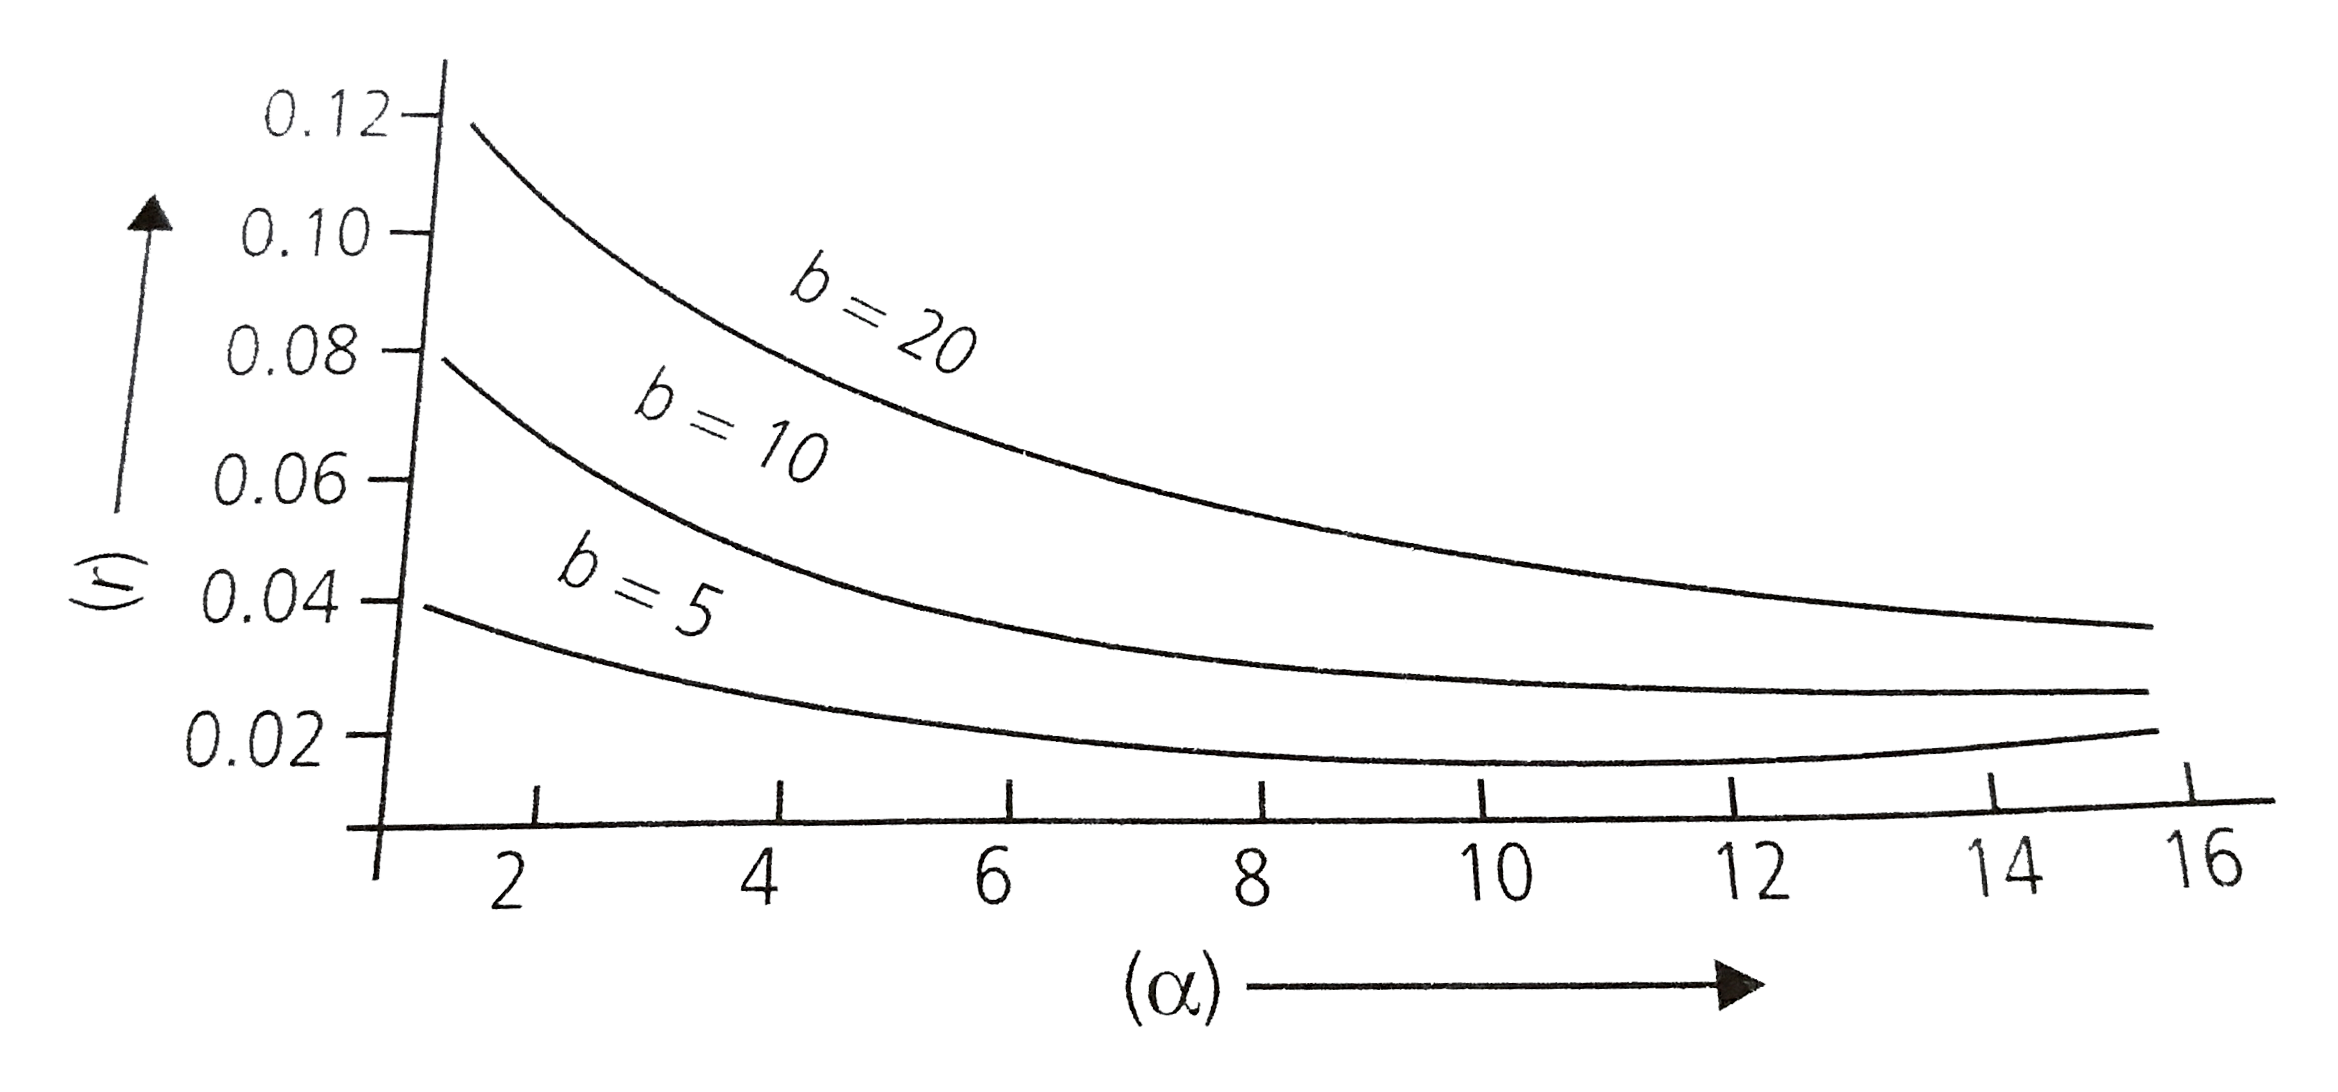
What is the most important conclusion to be drawn from the graph ?
View Solution

