The graph between PV vs P at constant temperature is linear parallel to the pressure axis.
Video Solution
Text Solution
1
|
Topper's Solved these Questions
- STATES OF MATTERBOOK - CENGAGE CHEMISTRY ENGLISHCHAPTER - STATES OF MATTEREXERCISE - Exercises (Fill In The Blanks)
25 Videos
- SOME BASIC CONCEPTS AND MOLE CONCEPTBOOK - CENGAGE CHEMISTRY ENGLISHCHAPTER - SOME BASIC CONCEPTS AND MOLE CONCEPTEXERCISE - Archives Subjective
11 Videos
- STOICHIOMETRYBOOK - CENGAGE CHEMISTRY ENGLISHCHAPTER - STOICHIOMETRYEXERCISE - Archives Subjective
33 Videos
Similar Questions
Knowledge Check
The graph of PV vs P for a gas is
AparabolicBhyperbolicCa straight line parallel to X-axisDa straight line passing through origin
The slope of the graph between log P and log V at constant temperature for a given mass of gas is
View SolutionThe plot of PV vs P at particular temperature is called isovbar.
View SolutionThe graph between (P/T) and T for a gas at constant volume will be:
View SolutionWhat is the type of graph between log P and log(1V) at constant temperature for a given amount of gas ?
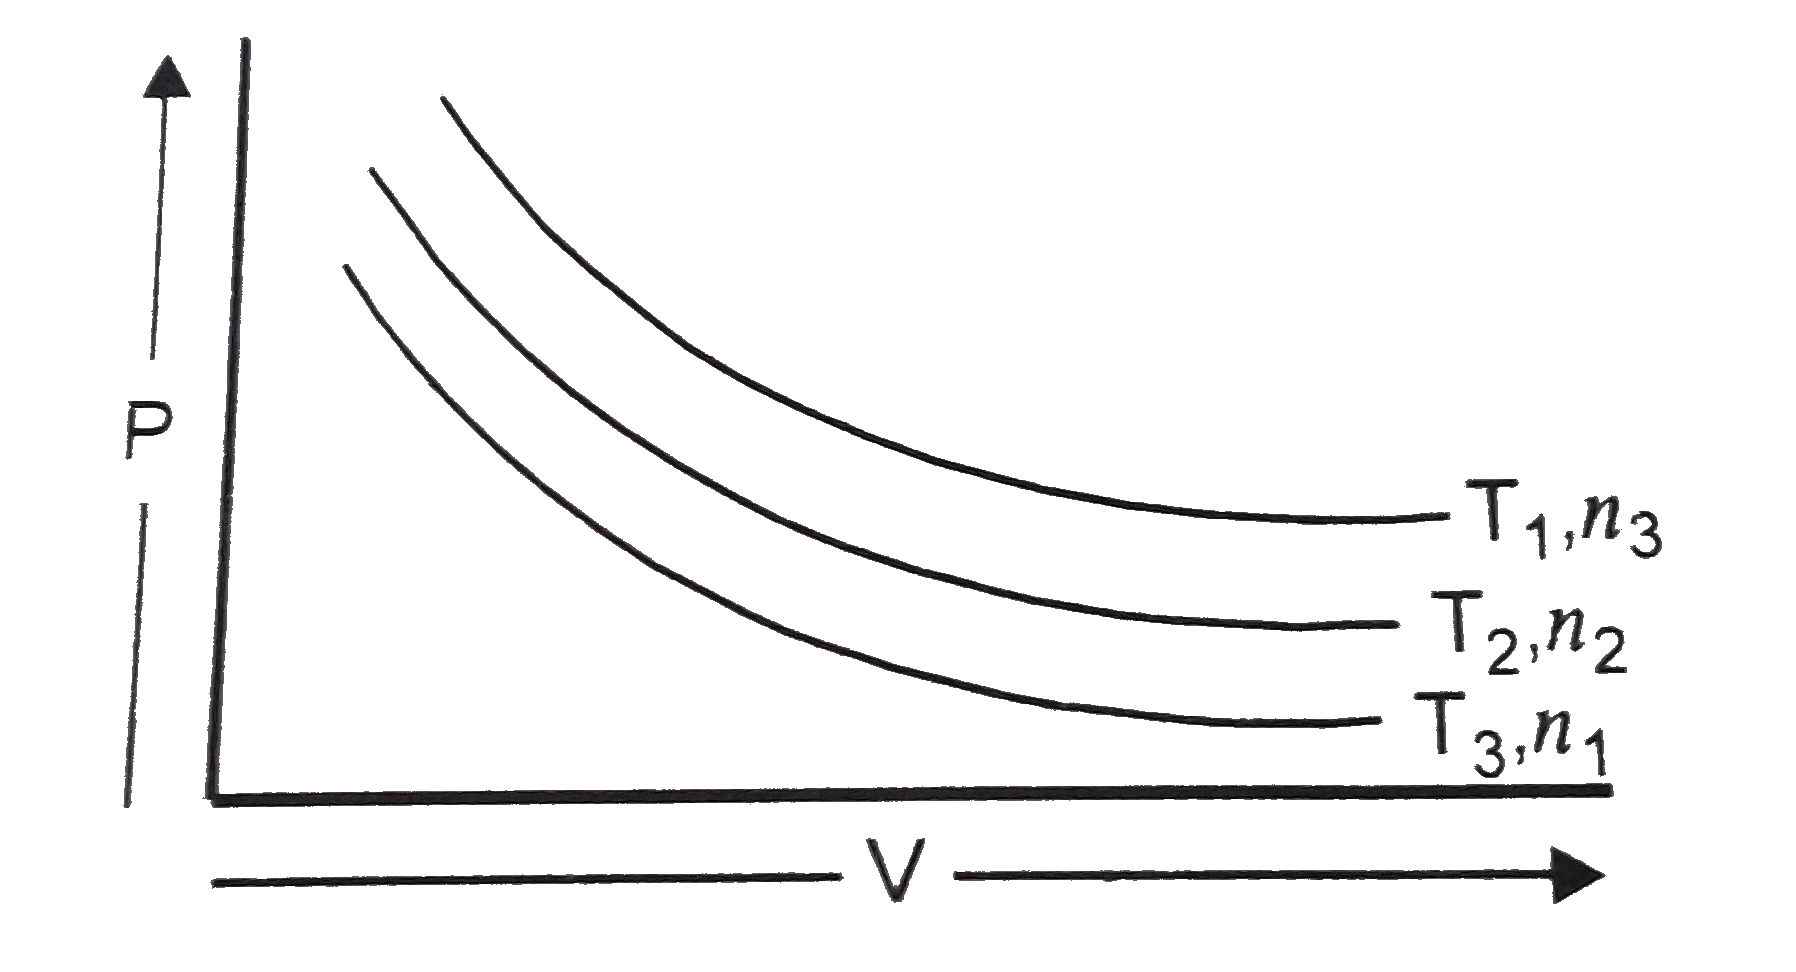
View SolutionThe graph of P vs V is given at temperature and number of moles :

The correct relationship is/are
View SolutionWhat is the type of graph between log P and log V at constant temperature?
View SolutionAssertion: The plot of volume (V) versus pressure (P) at constant temperature is a hyperbola in the first quadrant.
Reason: V∝1/P at constant temperature.
View Solution