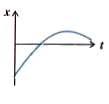
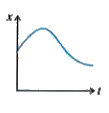
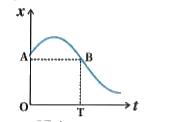
Among the four graph shown in the figure there is only one graph for which average velocity over the time interval (O,T) can vanish for a suitably chosen T. Which one is it ? Solution in Gujrati


The correct Answer is:B
In graph (b) there are tgwo positions for one value of displacement. Hence for one time, the average velocity id positive and for another time it is negative.
Hence, there are opposite velocities in the interval 0 to T so, average velocity can vanish in (b). This can be seen in the figure given below

Here, (same displacement) for two different points of time.
Topper's Solved these Questions
- MOTION IN A STRAIGHT LINE BOOK - KUMAR PRAKASHANCHAPTER - MOTION IN A STRAIGHT LINE EXERCISE - SECTION-E
71 Videos
- MOTION IN A STRAIGHT LINE BOOK - KUMAR PRAKASHANCHAPTER - MOTION IN A STRAIGHT LINE EXERCISE - SECTION-F
20 Videos
- MOTION IN A STRAIGHT LINE BOOK - KUMAR PRAKASHANCHAPTER - MOTION IN A STRAIGHT LINE EXERCISE - SECTION-C
43 Videos
- MECHANICAL PROPERTIES OF FLUIDS BOOK - KUMAR PRAKASHANCHAPTER - MECHANICAL PROPERTIES OF FLUIDS EXERCISE - QUESTION PAPER (SECTION -C)
3 Videos
- OBJECTIVE QUESTIONS AS PER NEW PAPER STYLE BOOK - KUMAR PRAKASHANCHAPTER - OBJECTIVE QUESTIONS AS PER NEW PAPER STYLE EXERCISE - CHAPTER - 8 (Match Type questions)
5 Videos
Similar Questions
Velocity of a particle is given byv=(3t2+2t)ms. Find its average velocity between t = 0 to t=3s and also find its acceleration at t = 3s. Motion of the particle is in one dimension.
View SolutionDistance covered by ball thrown upwards with speed 'u' in last 't' seconds before it reaches max. height is .............
View SolutionWhat is acceleration ? What is the direction ? Also gives its unit.
View SolutionGlycerine flows steadily through a horizontal tube of length 1.5m and radius 1.0 cm . If the amount of glycerine collected per second at one is 4.0×10⁻³kgs−1 , what is the pressure difference between the two ends of the tube ? (Density of glycerine =1.3×10103kgm−3 and viscosity of glycerine =0.83 Pa s). [ you may also like to check if the assumption of laminar flow in the tube is correct]
View SolutionType of satellites are given in Column-I and their uses are given in Column-II. Match them properly :
Column-IColumn-II(1) Polar satellite(a) Tele communication(2) Geo-stationary satellite(b) Investigation(c) For information about atmosphere
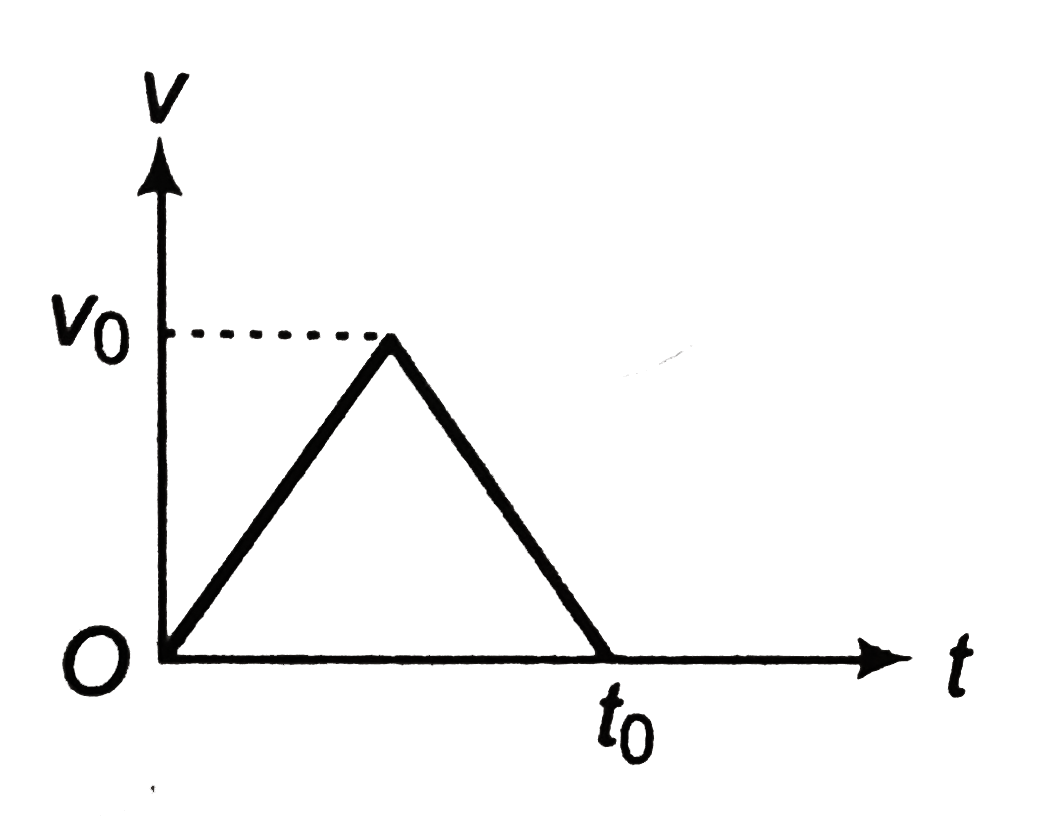
View SolutionAssertion : In v-t graph shown in figure, average velocity in time interval from 0→t0 depends only on v0. It is independent of t0.
Reason : In the given time interval average velocity is v02.

View SolutionAmong the four graphs shown in the figure there is only one graph for which average velocity over the time interval (0,T) can vanish for a suitably chosen T . Which one is it ?
View SolutionPosition time graph is shown which is a semicircle form t = 2 to t = 8sec . Find time t at which the instantaneous velocity, is equal to average velocity over first t second.
View Solution
Figure shows the displacement tiime (x-t) graph of a body moving in a straight line which one of the graph shown in figure represents the velocity- time (v-t) graph of the motion of the body.
View SolutionThe graph shown the variation with times t of the velocity v of an object . Which one of the following graphs best represents the variation of acceleration a of the object with time t ?
View SolutionPosition - time graph for a particle is shown in figure. Starting from t = 0, at what time t, the average velocity is zer?
View SolutionWhich among the four chi versus T graphs shown in the following figure is the correct one for a paramagnetic substsnace will look like ?
View SolutionOut of the four graphs, there is only one graph for which the average velocity can end at time (O, T) for a suitably chosen 7. which one is it?
View SolutionAmong the four graphs shown in the figure there is only one graph for which average velocity over the time interval (0,T) can vanish for a suitably chosen T. Which one is it ?
View SolutionAmong the four graphs shown in the figure there is only one graph for which average velocity over the time interval (0,T) can vanish for a suitably chosen T. Which one is it ?
View Solution
