Darw graphs showing variation of photoelctric current with applied voltage for two incident radiations of equal frequecny and different intensities. Mark the graph for the radiaiton of higher intensity.
To solve the question, we need to draw graphs that show the variation of photoelectric current with applied voltage for two incident radiations of equal frequency but different intensities. Let's break down the steps to create the graph.
1. Understand the Variables:
- The x-axis will represent the applied voltage (V).
- The y-axis will represent the photoelectric current (I).
2. Identify the Conditions:
- Both radiations have the same frequency (f).
- The intensities of the two radiations are different (let's denote them as I1 and I2, where I2 > I1).
3. Draw the Axes:
- Draw a horizontal line for the x-axis (Applied Voltage).
- Draw a vertical line for the y-axis (Photoelectric Current).
4. Mark the Stopping Potential:
- Indicate the stopping potential on the x-axis, which is the voltage at which the photoelectric current becomes zero.
5. Plot the Graphs:
- For the lower intensity radiation (I1), draw a curve that starts from the origin, rises with increasing voltage, and approaches a maximum current value before leveling off.
- For the higher intensity radiation (I2), draw a similar curve that starts from the origin but rises higher than the curve for I1, indicating a greater photoelectric current due to higher intensity.
6. Label the Graphs:
- Label the curve for intensity I1 as "I1" and the curve for intensity I2 as "I2".
- Clearly mark which graph corresponds to the higher intensity (I2).
7. Final Touches:
- Ensure that the axes are labeled correctly and that the curves are distinct and easy to read.
Graph Summary:
- The graph will show two curves: one for lower intensity (I1) and one for higher intensity (I2).
- The curve for I2 will be above that of I1, indicating that the photoelectric current is greater for the higher intensity radiation.
- The x-axis will represent the applied voltage (V).
- The y-axis will represent the photoelectric current (I).
- Both radiations have the same frequency (f).
- The intensities of the two radiations are different (let's denote them as I1 and I2, where I2 > I1).
- Draw a horizontal line for the x-axis (Applied Voltage).
- Draw a vertical line for the y-axis (Photoelectric Current).
- Indicate the stopping potential on the x-axis, which is the voltage at which the photoelectric current becomes zero.
- For the lower intensity radiation (I1), draw a curve that starts from the origin, rises with increasing voltage, and approaches a maximum current value before leveling off.
- For the higher intensity radiation (I2), draw a similar curve that starts from the origin but rises higher than the curve for I1, indicating a greater photoelectric current due to higher intensity.
- Label the curve for intensity I1 as "I1" and the curve for intensity I2 as "I2".
- Clearly mark which graph corresponds to the higher intensity (I2).
- Ensure that the axes are labeled correctly and that the curves are distinct and easy to read.
- The graph will show two curves: one for lower intensity (I1) and one for higher intensity (I2).
- The curve for I2 will be above that of I1, indicating that the photoelectric current is greater for the higher intensity radiation.
Similar Questions
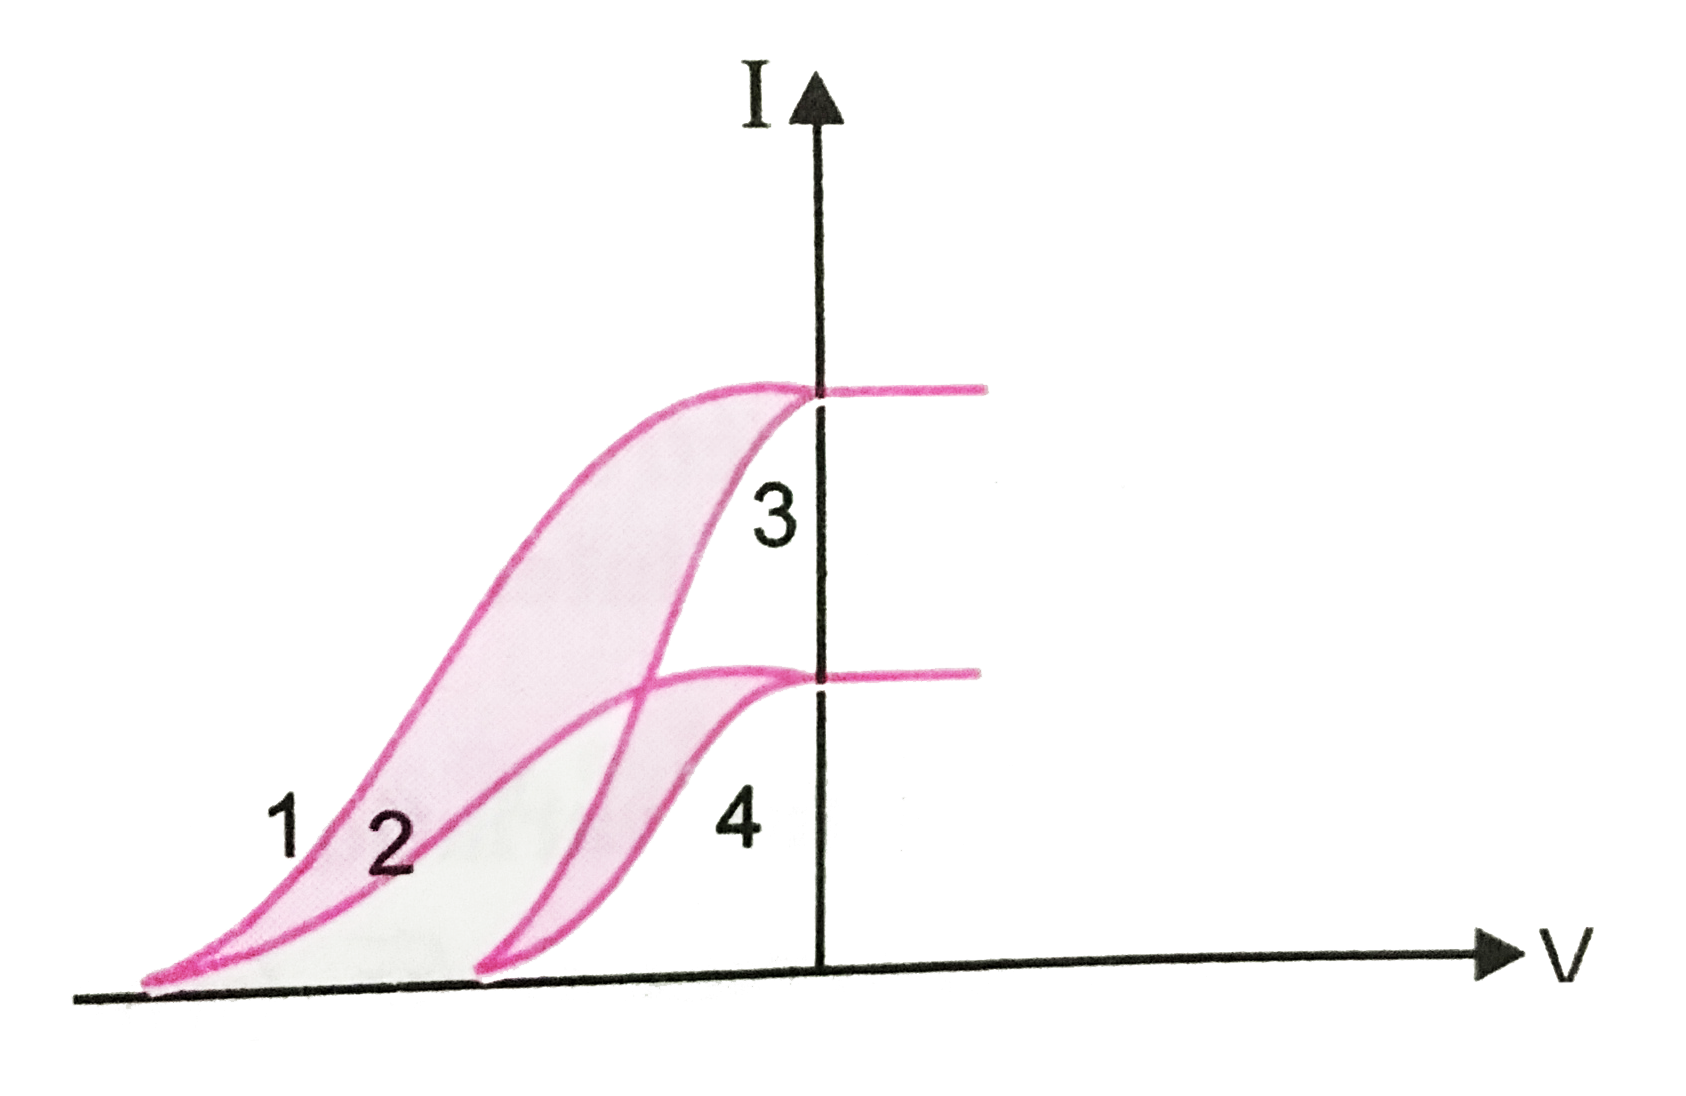
The graph of Fig. shows the variation of photoelectric current (I) versus applied voltage (V) for the two different photosensitive materials for two different intensities of the incident radiation. Identify the pairs of curves that correspond to different materials but same intensity of incident radiation.

View SolutionPlot a graph showing variation of current versus voltage for the material Ga.
View Solution
Knowledge Check
The stopping potential as a function of the frequency of the incident radiation is plotted for two different photoelectric surfaces A and B . The graphs show that work function of A is
 AlessBmoreCequalDnothing can be said
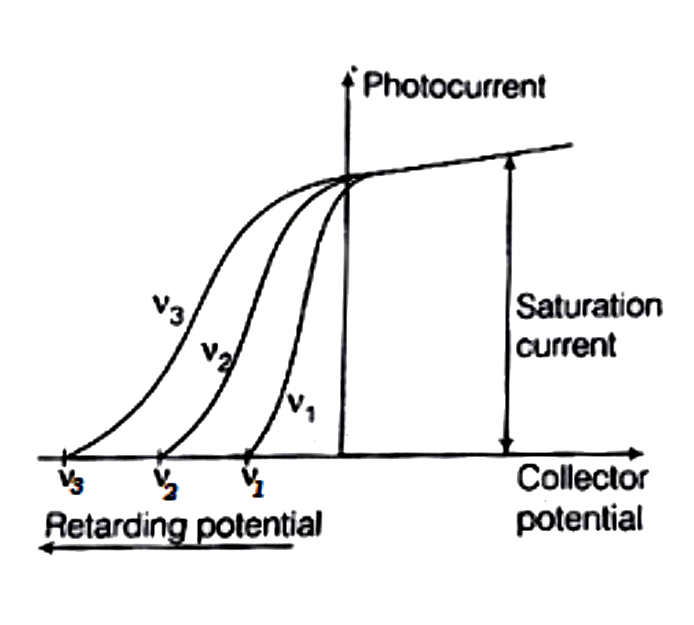
Draw a plot showing the variation of photoelectric current with collector plate potential for two different frequencies, v1>v2 of incident radiation having the same intensity. In which case will the stopping potential be higher? Justify your answer.
View SolutionWhat is the photoelectric effect? With the help of suitable graph show the variation of photocurrent with (i) the intensity of incident radiation. (ii) the voltage applied between cathode and anode. (iii) the frequency of incident radiation.
View SolutionThe variation of photocurrent with collector potential for different frequencies of incident radiation v1,v2,v3 is as shown in the the graph , then

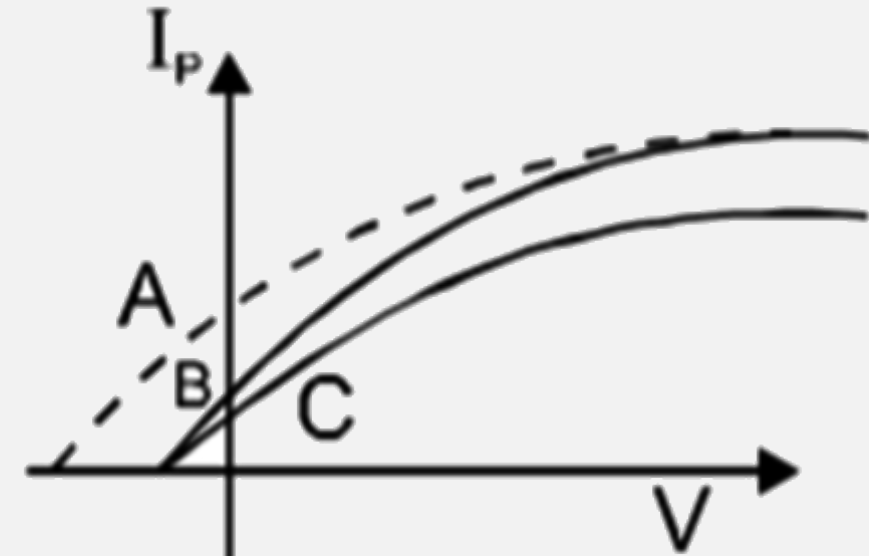
View SolutionThe graph shows the variation of photocurrent with the applied voltage in a photoelectric effect experiment for three different beams of light falling on identical metal surfaces, then which among the following is correct ?

View SolutionPlot a graph showing the variation of stopping potential with the frequency of incident radiation for two different photosensitive having work functions W1andW2(W1>W2) . On what factors does the (i) slope and (ii) intercept of the lines depend ?
View SolutionWhich one of the following graphs in figure shows the variation of photoelectric current (I) with voltage (V) between the electrodes in a photoelectric cell?
View SolutionA device X is connected across an ac source of voltage V=V0sinωt. The current throught X is given as I=I0sin(ωt+π2)
(a) Identify the device X and write the expression for its reactance.
(b) Draw graph showing variation of voltage and current with time over one cycle of ac, for X.
How does the reactance of the device X vary with frequency of the ac? Show this variation graphically.
(d) Draw the phasor diagram for the device X.
View Solution
