Draw P-V diagrams to show (i) isobaric process and (ii) isochoric process.
To solve the question of drawing P-V diagrams for (i) isobaric process and (ii) isochoric process, we will follow these steps:
Step 1: Understand the Isobaric Process
In an isobaric process, the pressure remains constant while the volume changes. According to the ideal gas law (PV = nRT), if pressure (P) is constant, then the relationship between volume (V) and temperature (T) can be expressed as V = (nRT)/P. As the temperature increases, the volume also increases while the pressure stays the same.
Step 2: Draw the P-V Diagram for Isobaric Process
1. Draw the axes: Label the vertical axis as Pressure (P) and the horizontal axis as Volume (V).
2. Draw a horizontal line: Since the pressure is constant, draw a horizontal line parallel to the Volume axis at a certain pressure level (let's say P1).
3. Label the line: This line represents the isobaric process where the pressure remains constant as the volume changes.
Step 3: Understand the Isochoric Process
In an isochoric process, the volume remains constant while the pressure changes. According to the ideal gas law, if the volume (V) is constant, then the pressure will change with temperature. As the temperature increases, the pressure also increases.
Step 4: Draw the P-V Diagram for Isochoric Process
1. Draw the axes: Again, label the vertical axis as Pressure (P) and the horizontal axis as Volume (V).
2. Draw a vertical line: Since the volume is constant, draw a vertical line parallel to the Pressure axis at a certain volume level (let's say V1).
3. Label the line: This line represents the isochoric process where the volume remains constant as the pressure changes.
Final Diagrams
- For the isobaric process, you will have a horizontal line at pressure P1.
- For the isochoric process, you will have a vertical line at volume V1.
In an isobaric process, the pressure remains constant while the volume changes. According to the ideal gas law (PV = nRT), if pressure (P) is constant, then the relationship between volume (V) and temperature (T) can be expressed as V = (nRT)/P. As the temperature increases, the volume also increases while the pressure stays the same.
1. Draw the axes: Label the vertical axis as Pressure (P) and the horizontal axis as Volume (V).
2. Draw a horizontal line: Since the pressure is constant, draw a horizontal line parallel to the Volume axis at a certain pressure level (let's say P1).
3. Label the line: This line represents the isobaric process where the pressure remains constant as the volume changes.
In an isochoric process, the volume remains constant while the pressure changes. According to the ideal gas law, if the volume (V) is constant, then the pressure will change with temperature. As the temperature increases, the pressure also increases.
1. Draw the axes: Again, label the vertical axis as Pressure (P) and the horizontal axis as Volume (V).
2. Draw a vertical line: Since the volume is constant, draw a vertical line parallel to the Pressure axis at a certain volume level (let's say V1).
3. Label the line: This line represents the isochoric process where the volume remains constant as the pressure changes.
- For the isobaric process, you will have a horizontal line at pressure P1.
- For the isochoric process, you will have a vertical line at volume V1.
Topper's Solved these Questions
- INTERNAL ENERGY BOOK - ICSECHAPTER - INTERNAL ENERGY EXERCISE - VERY SHORT ANSWER QUESTIONS
17 Videos
- INTERNAL ENERGY BOOK - ICSECHAPTER - INTERNAL ENERGY EXERCISE - SELECTED PROBLEMS (FROM FIRST LAW OF THERMODYNAMICS )
6 Videos
- INTERNAL ENERGY BOOK - ICSECHAPTER - INTERNAL ENERGY EXERCISE - LONG ANSWER QUESTIONS
8 Videos
- GRAVITATIONBOOK - ICSECHAPTER - GRAVITATIONEXERCISE - FROM THE HUBBLE TELESCOP
2 Videos
- MOTION IN FLUIDS BOOK - ICSECHAPTER - MOTION IN FLUIDS EXERCISE - SELECTED PROBLEMS (FROM POISEUILLE.S FORMULA)
19 Videos
Similar Questions
During an isochoric process
View SolutionAssertion Any straight line on V-T diagram represents iisobaric process.
Reason In isobaric process, if V is doubled, then T will also become two times.
View SolutionDistinguish between isobaric and isochoric process.
View SolutionFor an isobaric process, ΔP=0.
View SolutionDraw the P-T and V-T diagrams for an isobabaric process of expansion, corresponding to n moles of an ideal gas at pressure P0 from V0 to 2V0
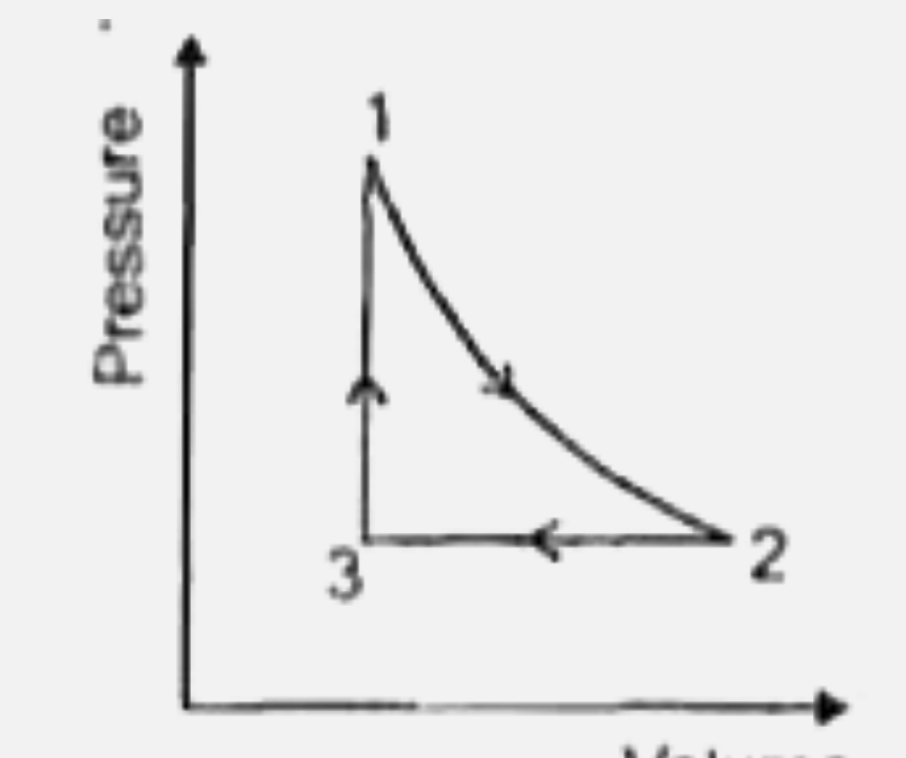
View SolutionGiven here is a cyclic process on P -V diagram. Process 1-2 is isothermal, 2-3 is isobaric and 3-1 is an isochoric process. Plot this T - P diagram.

View Solution
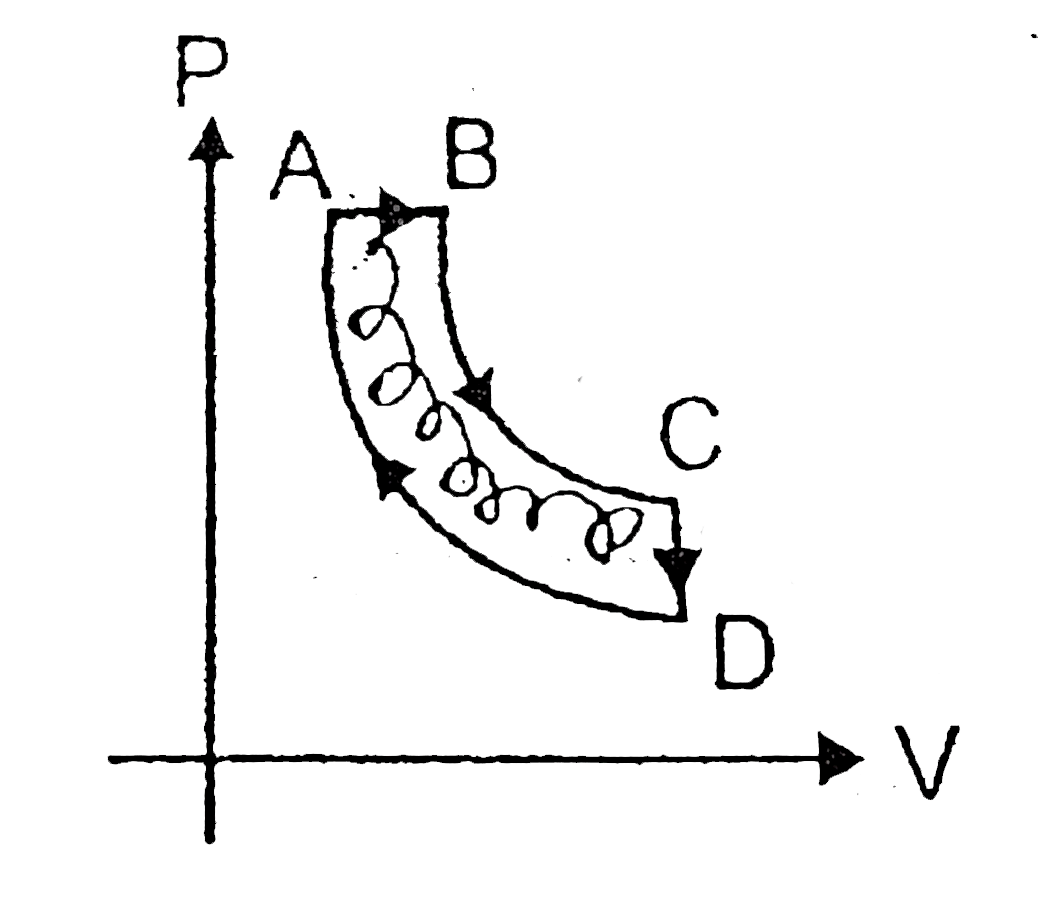
n moles of a monoatomic gas undergoes a cyclic process ABCDA as shown. Process AB is isobaric, process BC is adiabatic process CD is isochoric and process DA is isothermal the maximum temperature and minimum temperature in cycle are 4T0 and T0 respectively. Then:
View Solution
n moles of a monoatomic gas undergoes a cyclic process ABCDA as shown. Process AB is isobaric, process BC is adiabatic process CD is isochoric and process DA is isothermal the maximum temperature and minimum temperature in cycle are 4T0 and T0 respectively. Then:
View SolutionDraw at P-T curve for isochoric process.
View SolutionDraw at P-T curve for isochoric process.
View Solution
