Show graphically variation of AC with time. Explain the nature of the graph.

See Fig. In this case, the frequency of the alternating current (AC) produced is 50 Hz. The coil completes 50 rotations every second. The time for second, It is called the one rotation of the coil is periodic time or simply the period of AC. Positive current means the current flows in one direction and negative current means the current flows In the opposite direction in the external circuit. Here the maximum value of AC is 5 A.
Topper's Solved these Questions
- BOOK - NAVNEET PUBLICATION - MAHARASHTRA BOARDCHAPTER - EFFECTS OF ELECTRIC CURRENT EXERCISE - Give scientific reasons :11videos
EFFECTS OF ELECTRIC CURRENT
- BOOK - NAVNEET PUBLICATION - MAHARASHTRA BOARDCHAPTER - EFFECTS OF ELECTRIC CURRENT EXERCISE - Distinguish between the following :3videos
EFFECTS OF ELECTRIC CURRENT
- BOOK - NAVNEET PUBLICATION - MAHARASHTRA BOARDCHAPTER - EFFECTS OF ELECTRIC CURRENT EXERCISE - Answer the following questions in one sentence each :4videos
EFFECTS OF ELECTRIC CURRENT
- BOOK - NAVNEET PUBLICATION - MAHARASHTRA BOARDCHAPTER - DISTINGUISH BETWEEN THE FOLLOWINGEXERCISE - Animal Classification1videos
DISTINGUISH BETWEEN THE FOLLOWING
- BOOK - NAVNEET PUBLICATION - MAHARASHTRA BOARDCHAPTER - EXPLANATION AND GIVING CONCEPTS EXERCISE - ANIMAL CLASSIFICATION2videos
EXPLANATION AND GIVING CONCEPTS
Similar Questions
Explain the term 'inductive reactance'.Show graphically the variation of inductive reactance with frequency of the applied alternating voltage.
An a.c. voltage E=E0sinωt is applied across a pure inductor L.Show mathematically that the current flowing through it lags behind the applied voltage by a phase angle of π/2.View SolutionExplain the term 'capacitive reactance'.Show graphically the variation of capacitive reactance with frequency of the applied alternating voltage.
An a.c. voltage E=E0sinωt is applied a across a pure capacitor C.Show mathematically that the current flowing through it leads the applied voltage by a phase angle of π/2View Solution
Knowledge Check
- Question 1 - Select One
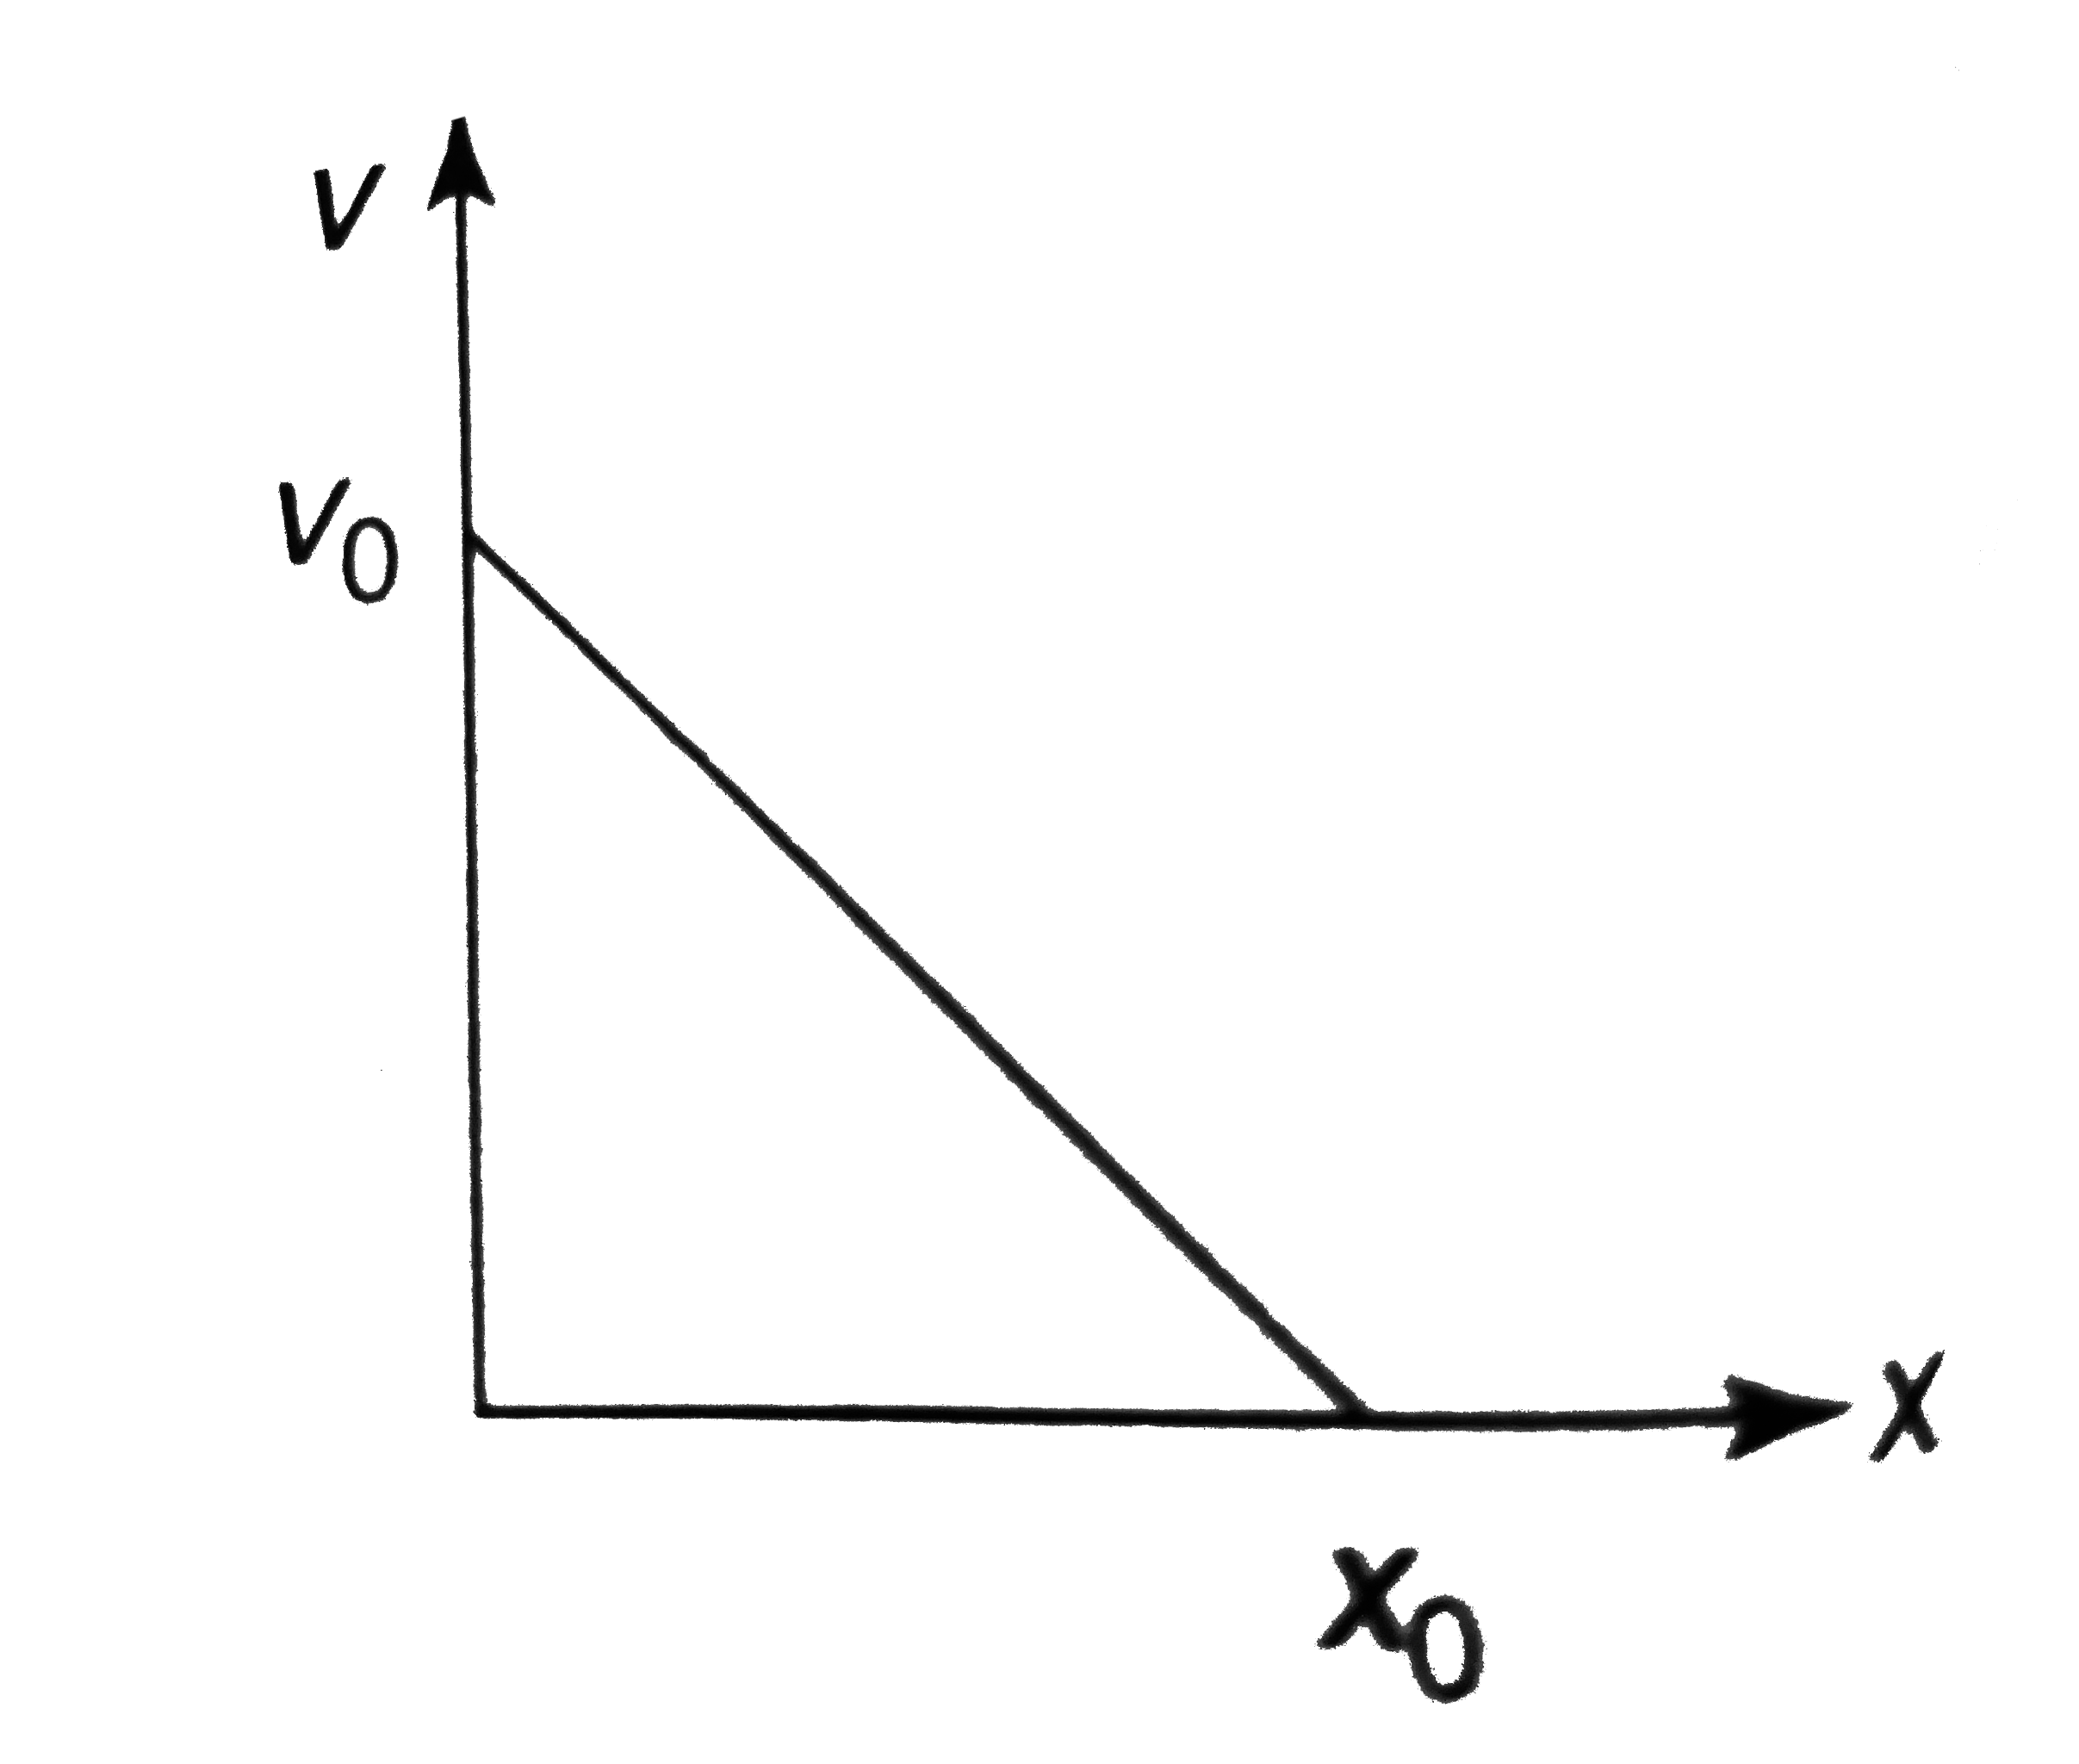
The given graph shows the variation of velocity with displacement. Which one of the graphs given below correctly represents the variation of acceleration with displacement ?
 A
A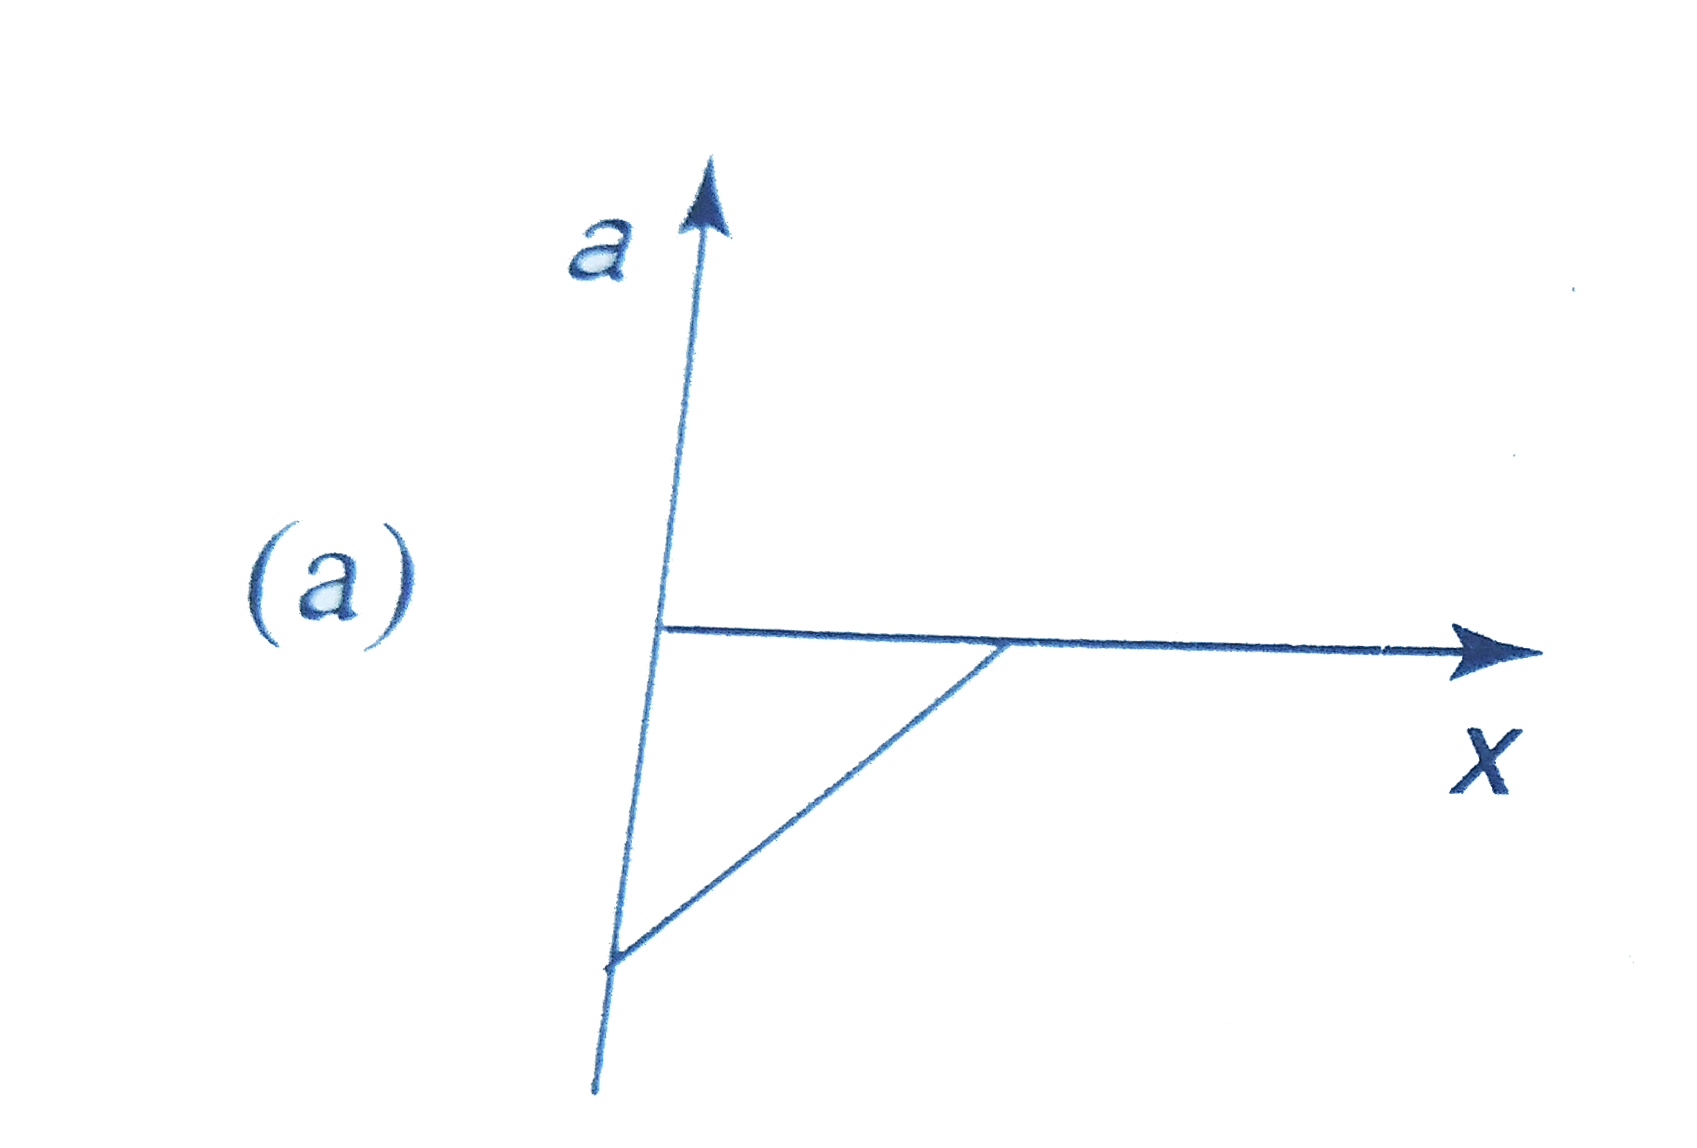 B
B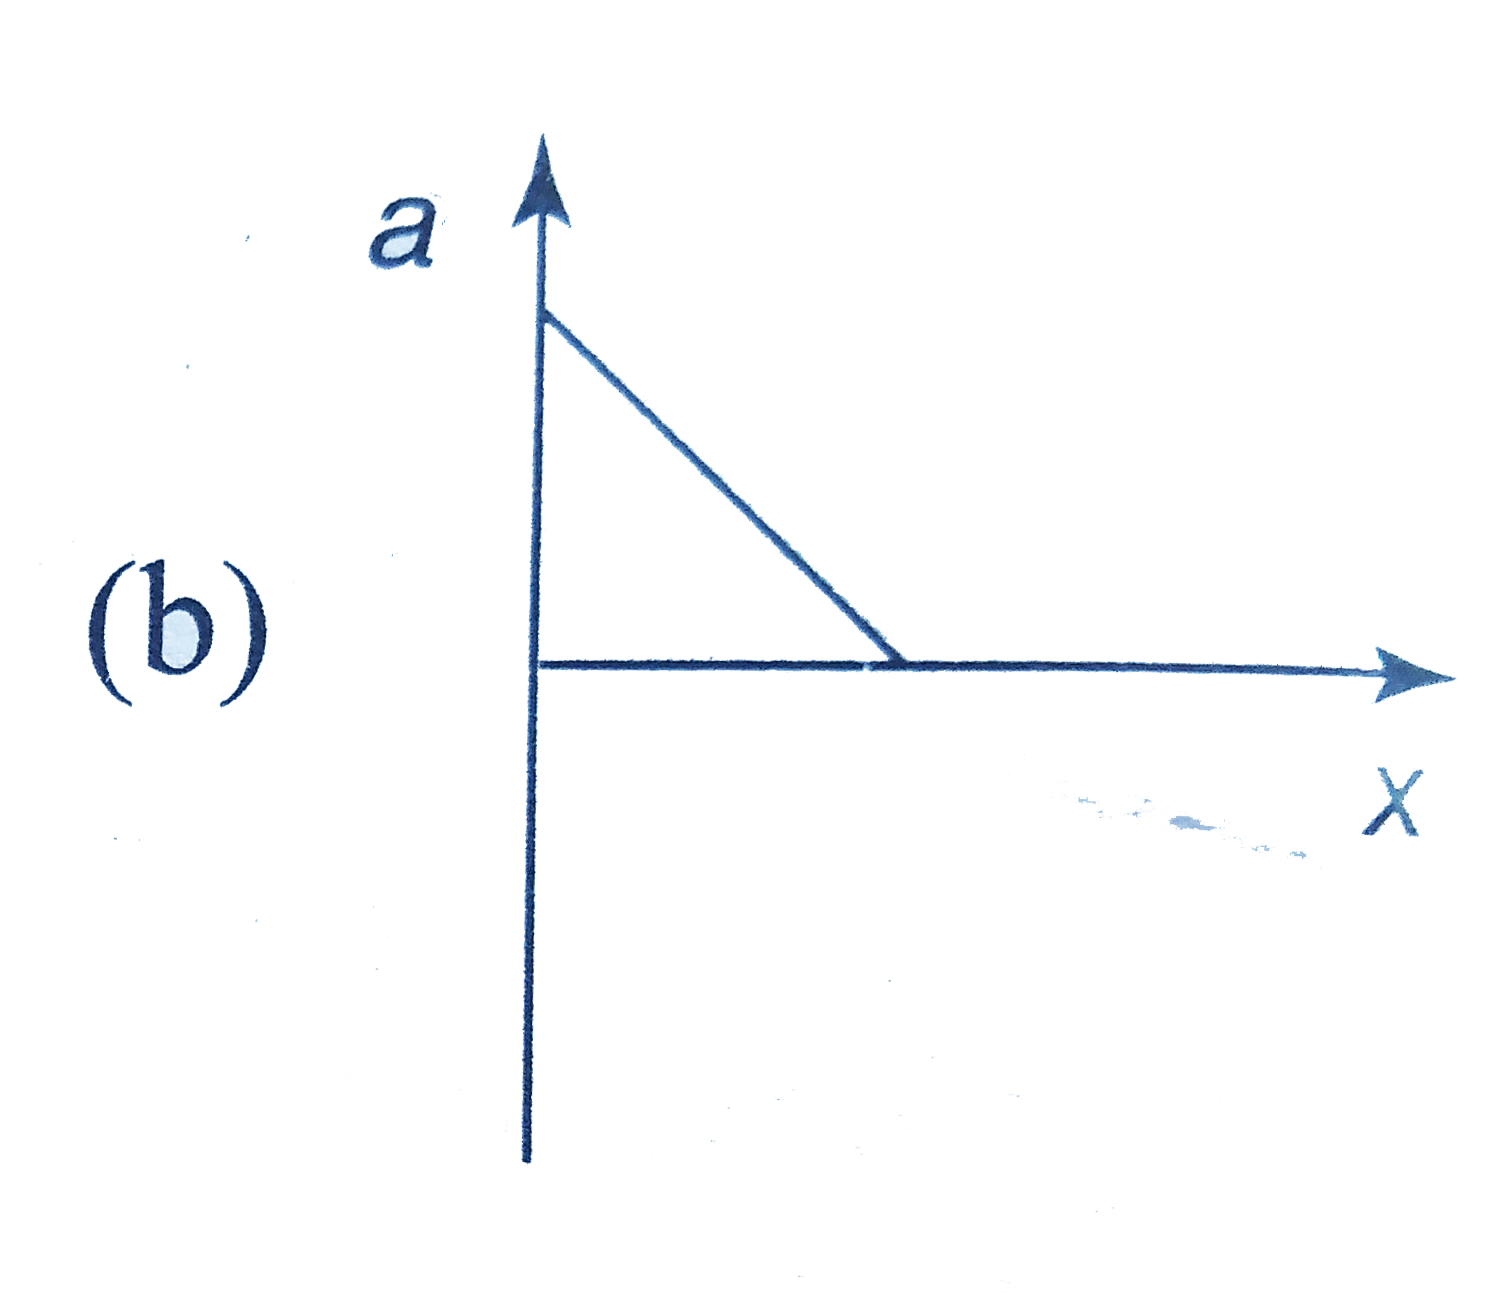 .C
.C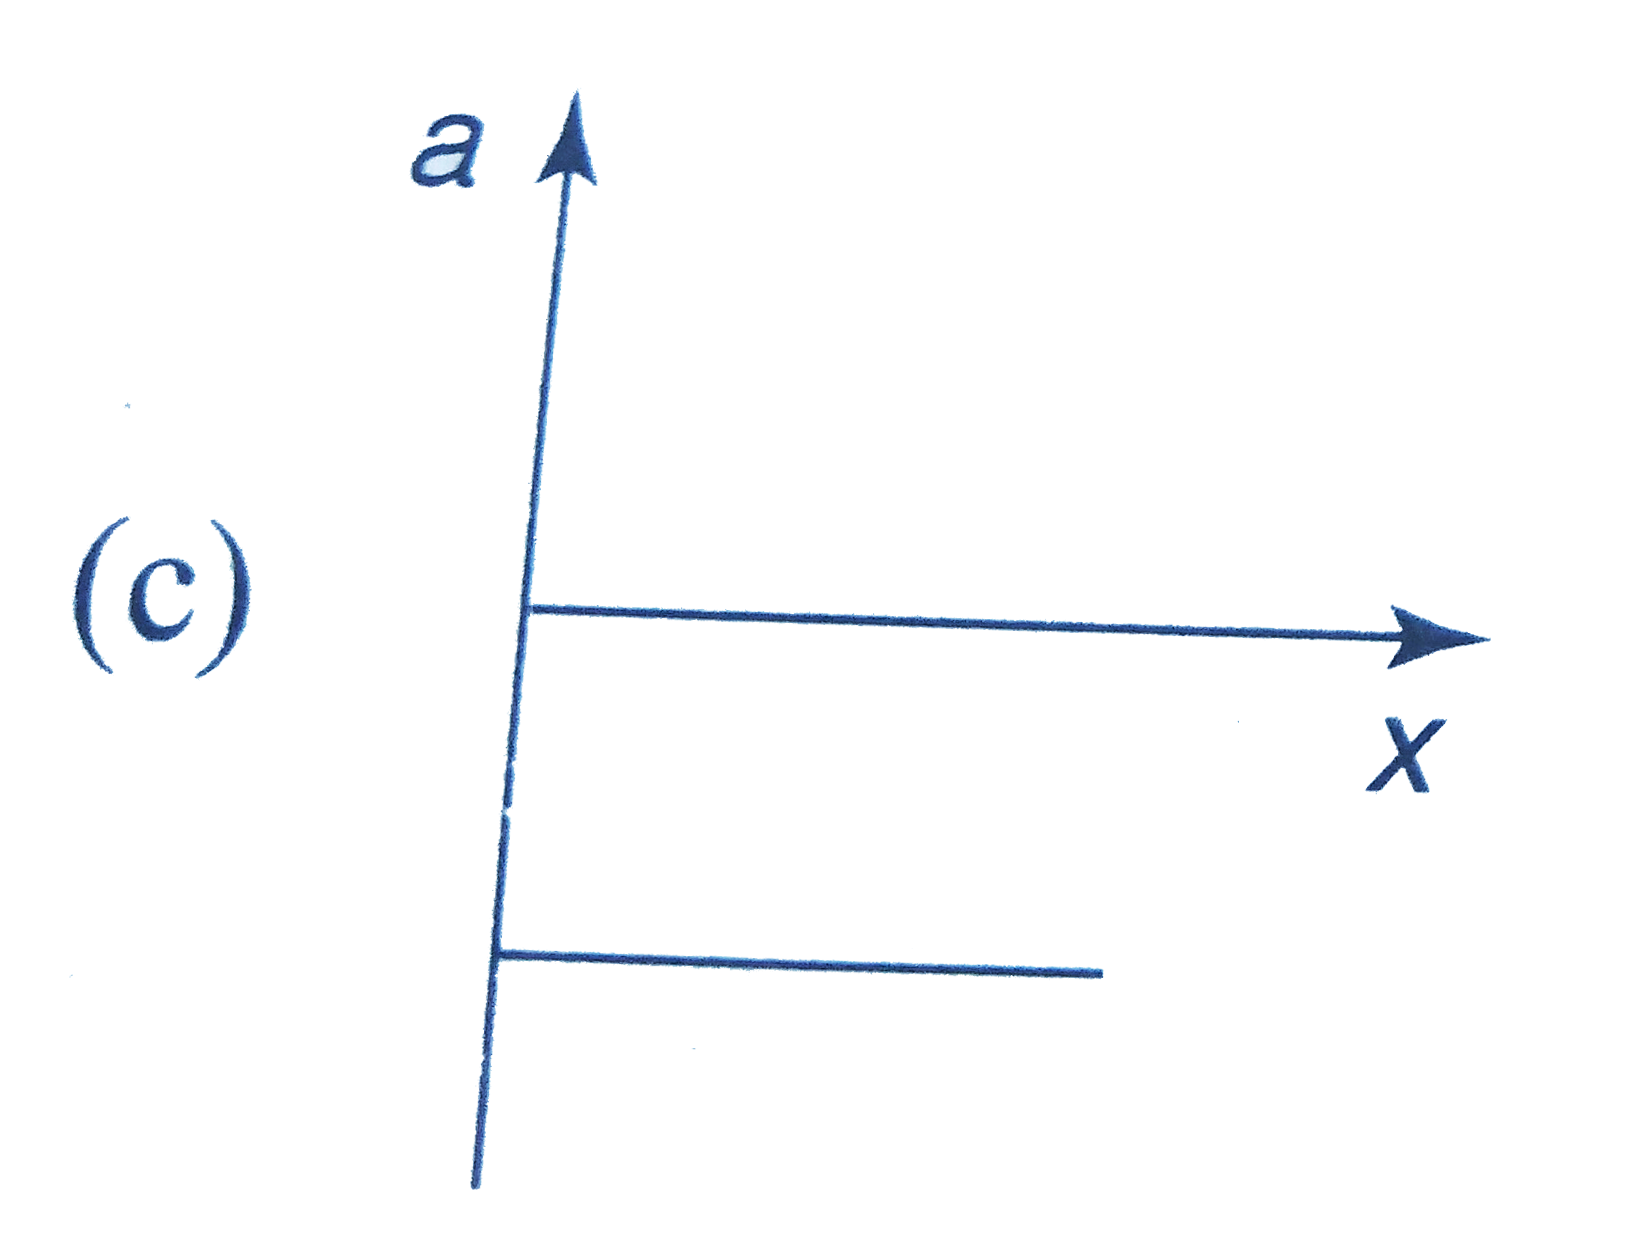 .D
.D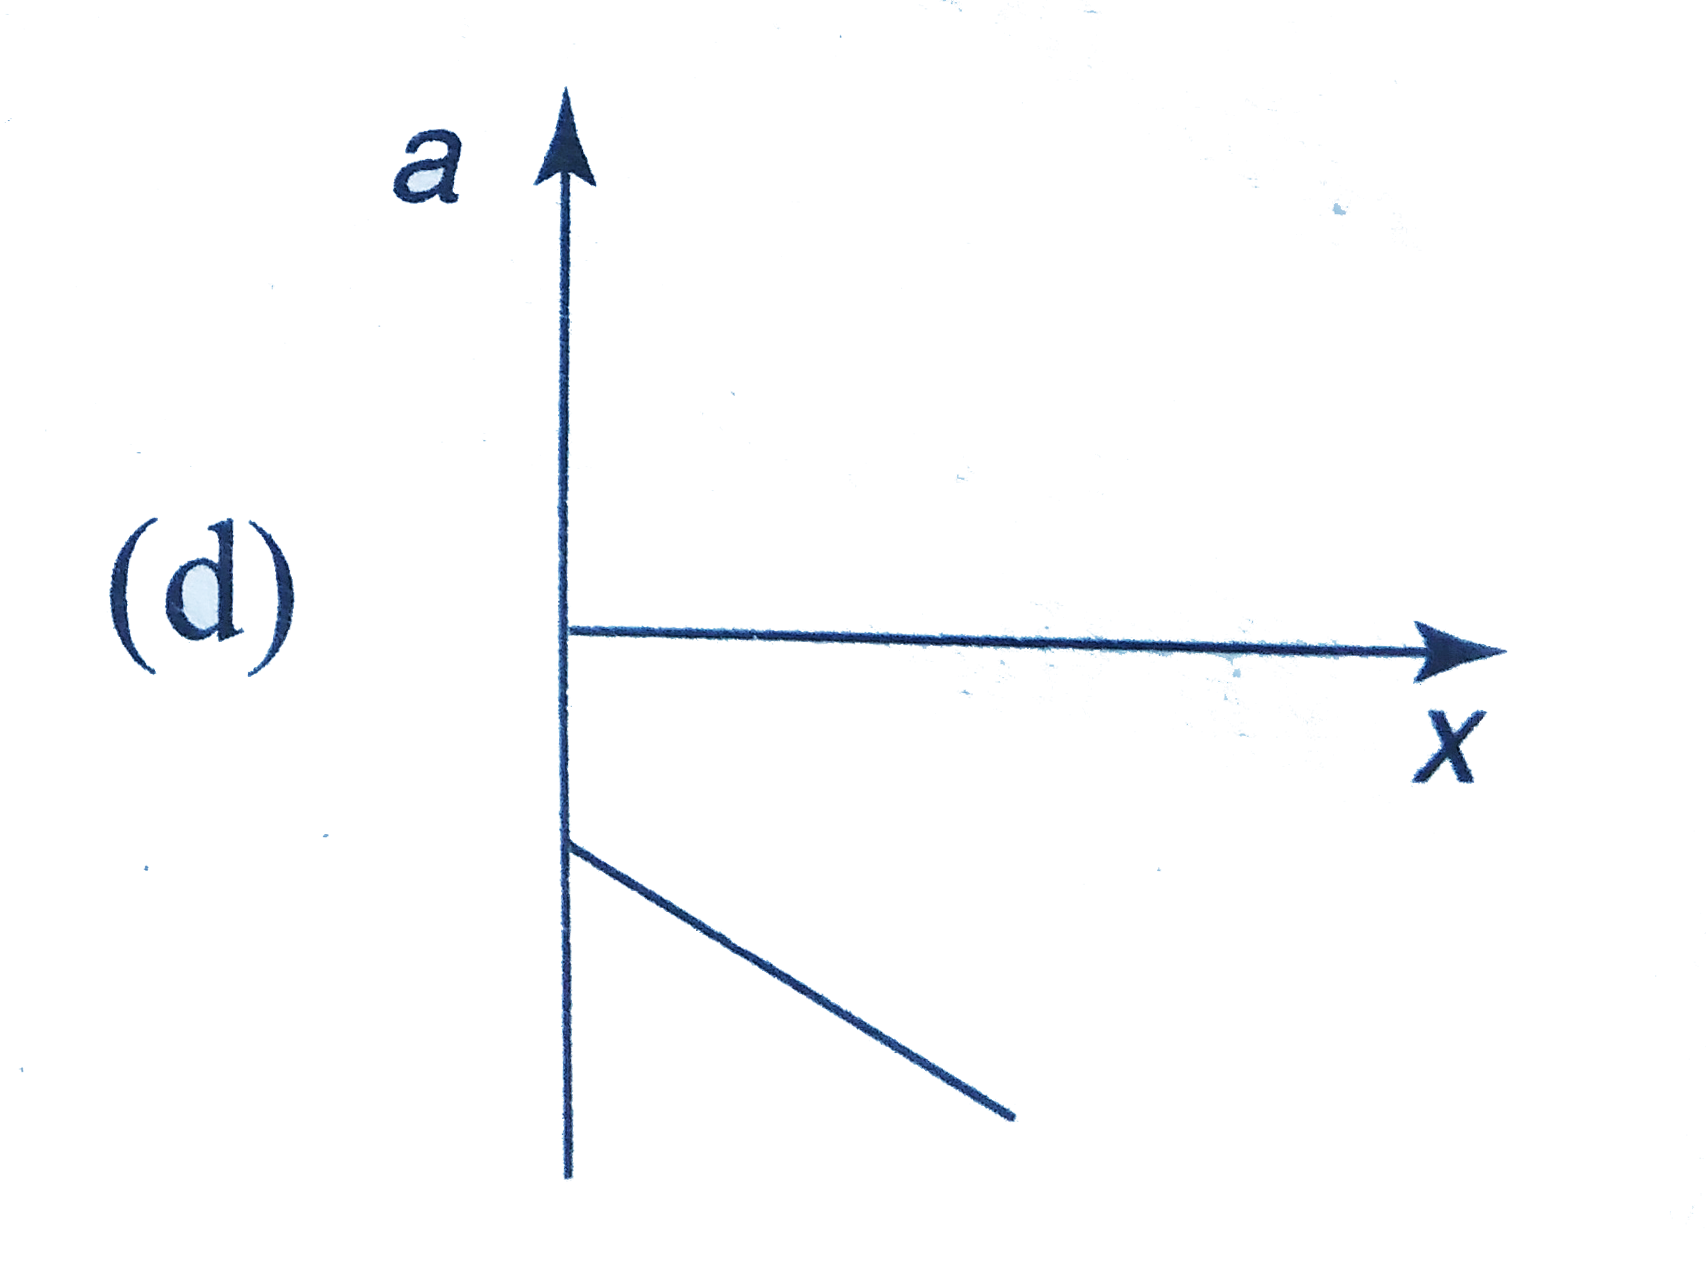 .
.
A partially plane polarised beam of light is passes thorugh a polaroid. Show graphically the variation of transmitted light with angle of rotation of polaroid.
View SolutionShow graphically the temperature variation with time associated with a colling hot body.
View SolutionShow graphically, the variation of the de-Broglie wavelength (λ) with the potential (V) through which an electron is accelerated from rest.
View SolutionDerive an expression for the total energy of a particle executing simple harmonic motion. Also, show graphically the variation of potential and kinetic energies with time in S.H.M.
View SolutionShow graphically, the variation of the de-Broglie wavelength (λ) with the potential (V) through which an electron is accelerated from rest.
View SolutionShow graphically the variation of potential energy of an object thrown vertically upwards w.r.t. its height.
View SolutionThe figure shows the graphical variation of the reactance of a capacitor with frequency of ac source. (a) find the capacitance of the capacitor (b)an ideal inductor has the same reactance at 100 Hz frequency as the capacitor has the same frequency find the value of the inductor. (c) draw the graph showing the variation of the reactance of this inductor with frequency
 View Solution

