The linear momentum of a particle varies with time as p=a0+at+bt2. Which of the following graph represents force and time relation ?
The correct Answer is:A
To solve the problem, we need to analyze the given expression for linear momentum and derive the corresponding force as a function of time.
1. Understand the Given Momentum Equation:
The momentum p of the particle is given by:
p=a0+at+bt2
where a0, a, and b are constants.
2. Relate Force to Momentum:
According to Newton's second law, the force F acting on an object is the time derivative of its momentum:
F=dpdt
3. Differentiate the Momentum Equation:
We will differentiate p with respect to time t:
dpdt=ddt(a0+at+bt2)
- The derivative of a0 (a constant) is 0.
- The derivative of at with respect to t is a.
- The derivative of bt2 with respect to t is 2bt.
So, we have:
F=0+a+2bt=a+2bt
4. Analyze the Force Equation:
The expression for force F can be rewritten as:
F=a+2bt
This indicates that the force is a linear function of time t with a slope of 2b and a y-intercept of a.
5. Determine the Graph of Force vs. Time:
Since F is a linear function of t, the graph of force versus time will be a straight line. The y-intercept is a (the value of force when t=0), and the slope is 2b.
Conclusion:
The graph that represents the relationship between force and time will be a straight line starting from a on the y-axis and increasing (or decreasing) depending on the sign of 2b.
The momentum p of the particle is given by:
p=a0+at+bt2
where a0, a, and b are constants.
According to Newton's second law, the force F acting on an object is the time derivative of its momentum:
F=dpdt
We will differentiate p with respect to time t:
dpdt=ddt(a0+at+bt2)
- The derivative of a0 (a constant) is 0.
- The derivative of at with respect to t is a.
- The derivative of bt2 with respect to t is 2bt.
F=0+a+2bt=a+2bt
The expression for force F can be rewritten as:
F=a+2bt
This indicates that the force is a linear function of time t with a slope of 2b and a y-intercept of a.
Since F is a linear function of t, the graph of force versus time will be a straight line. The y-intercept is a (the value of force when t=0), and the slope is 2b.
The graph that represents the relationship between force and time will be a straight line starting from a on the y-axis and increasing (or decreasing) depending on the sign of 2b.
Topper's Solved these Questions
- LAWS OF MOTIONBOOK - AAKASH SERIESCHAPTER - LAWS OF MOTIONEXERCISE - EXERCISE - II
136 Videos
- GEOMETRICAL OPTICSBOOK - AAKASH SERIESCHAPTER - GEOMETRICAL OPTICSEXERCISE - ADDITIONAL PRACTICE EXERCISE (LEVEL-II PRACTICE SHEET (ADVANCED) INTEGER TYPE QUESTIONS)
10 Videos
- LOGIC GATESBOOK - AAKASH SERIESCHAPTER - LOGIC GATESEXERCISE - Exercise (Very Short Answer)
10 Videos
Similar Questions
Knowledge Check
Which of the following energy-time graphs represents dajmped harmonic oscillator?
A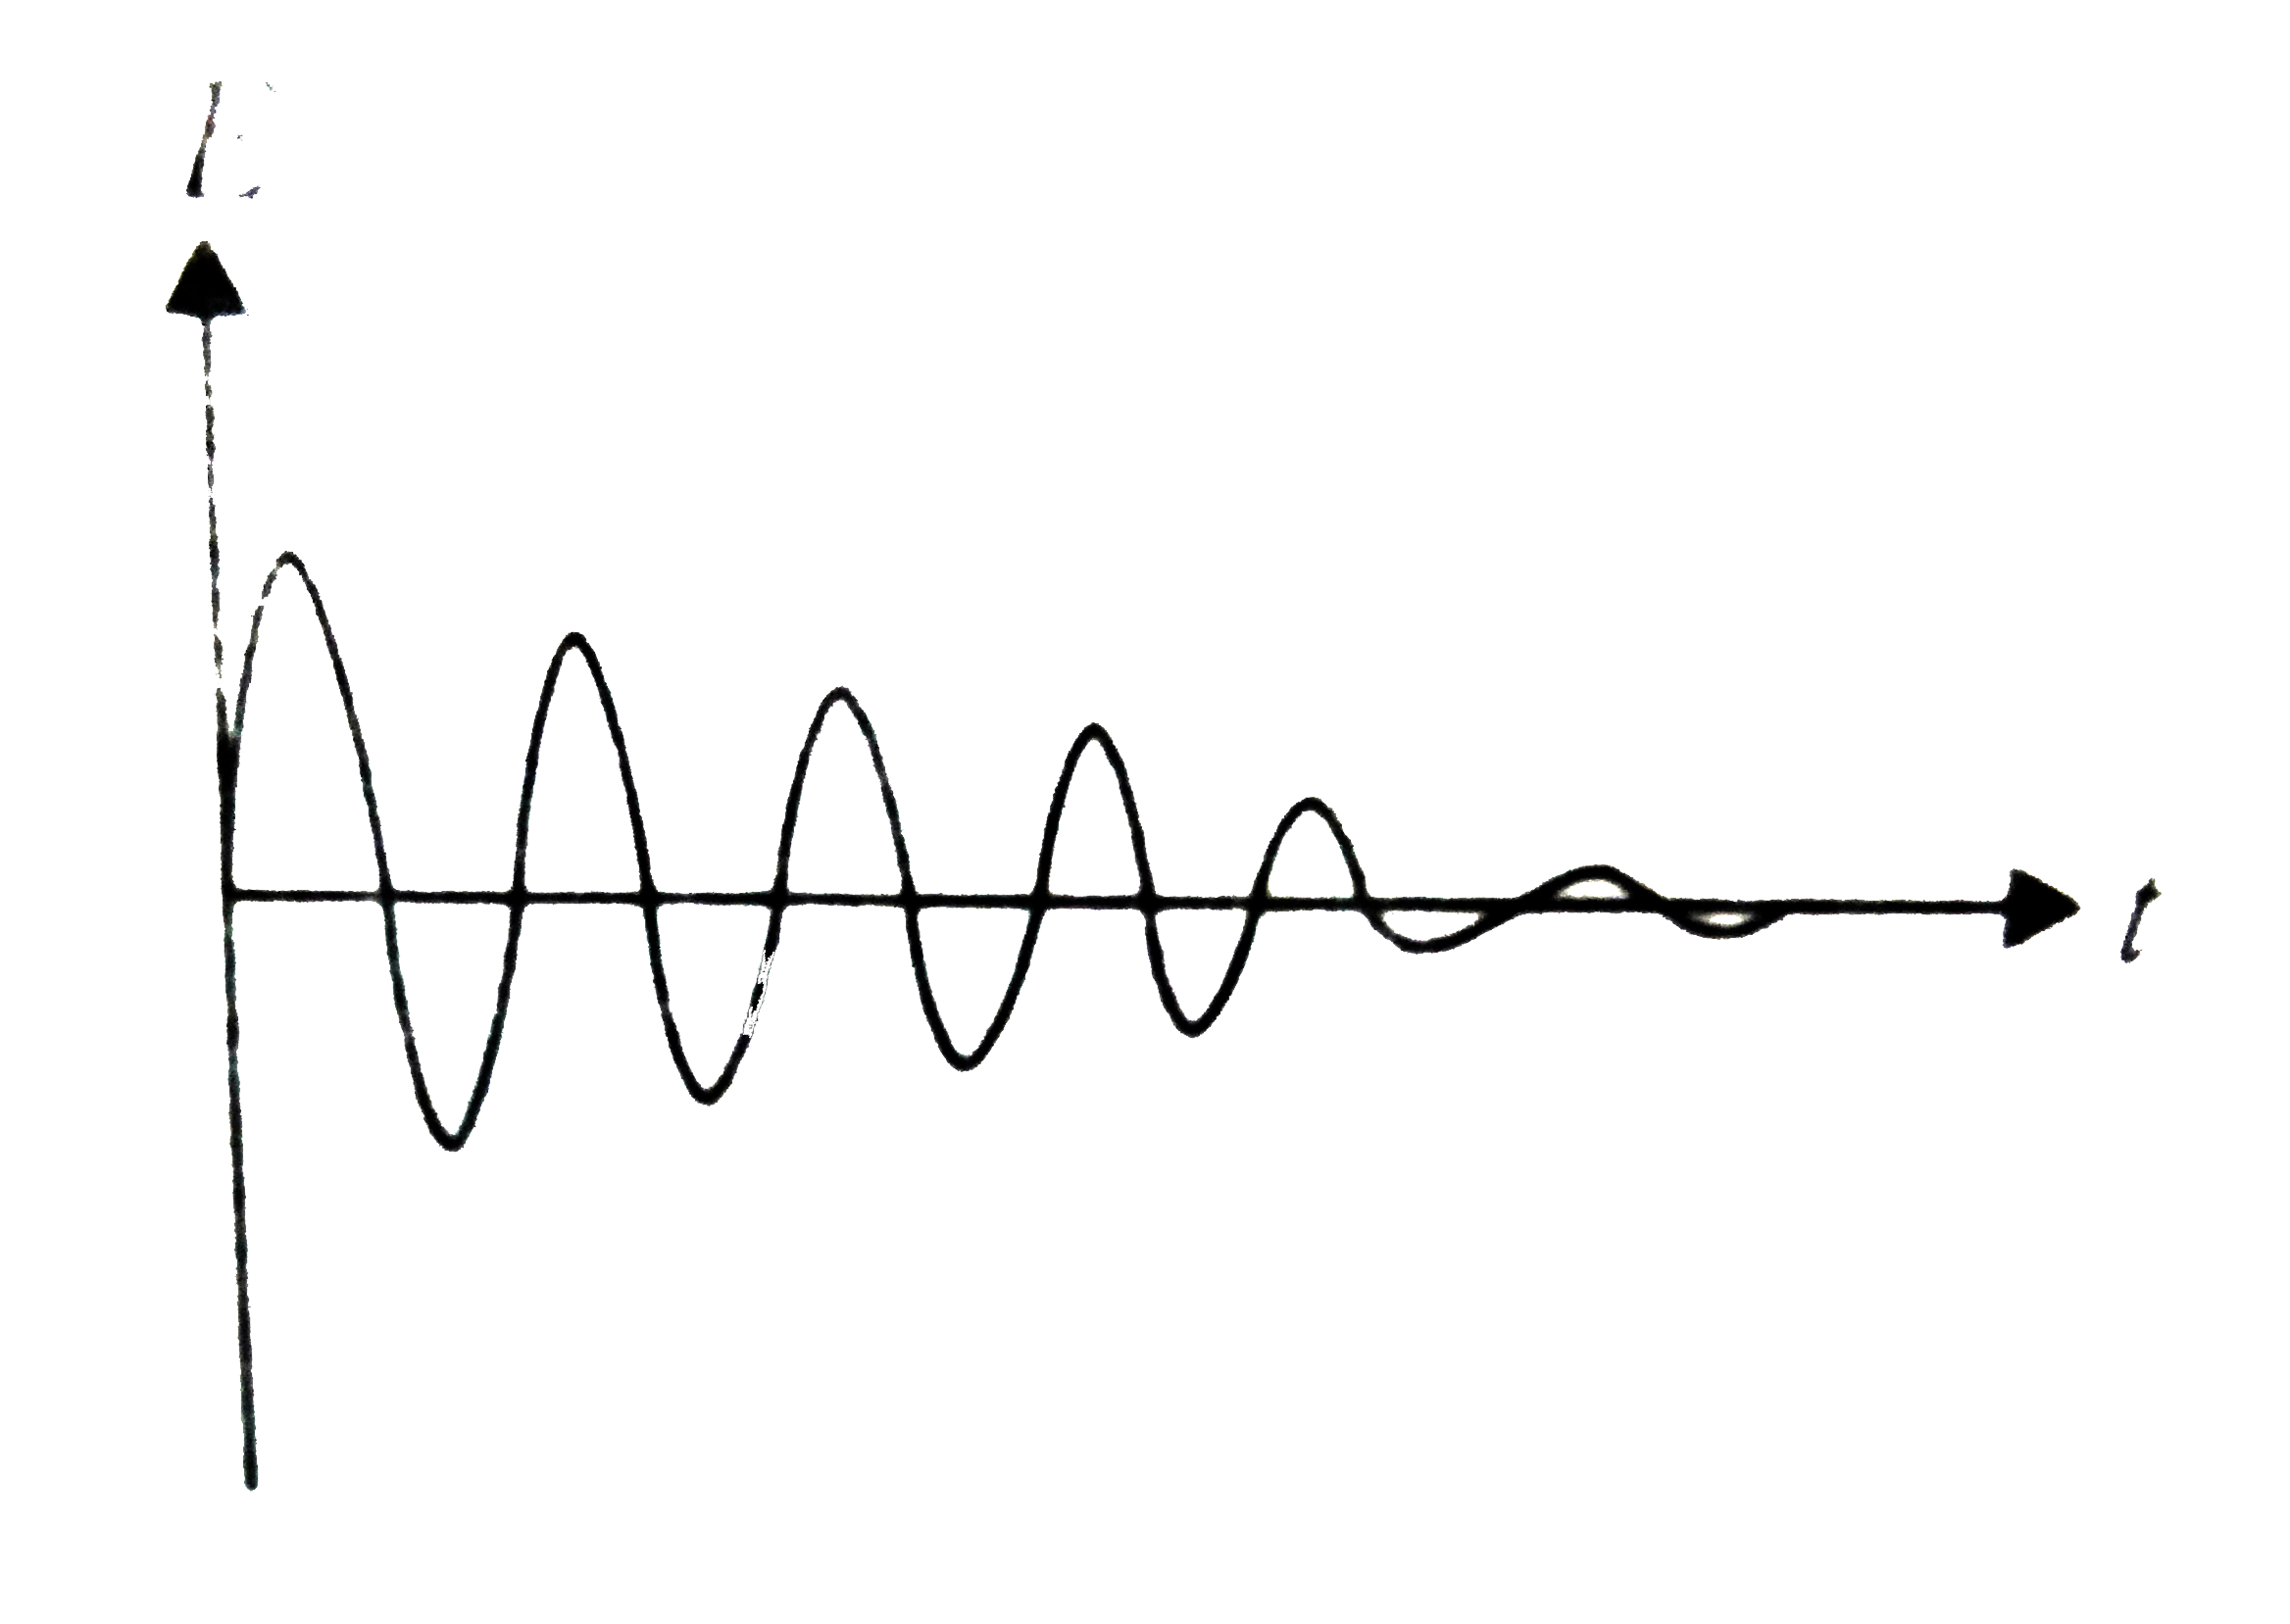 B
B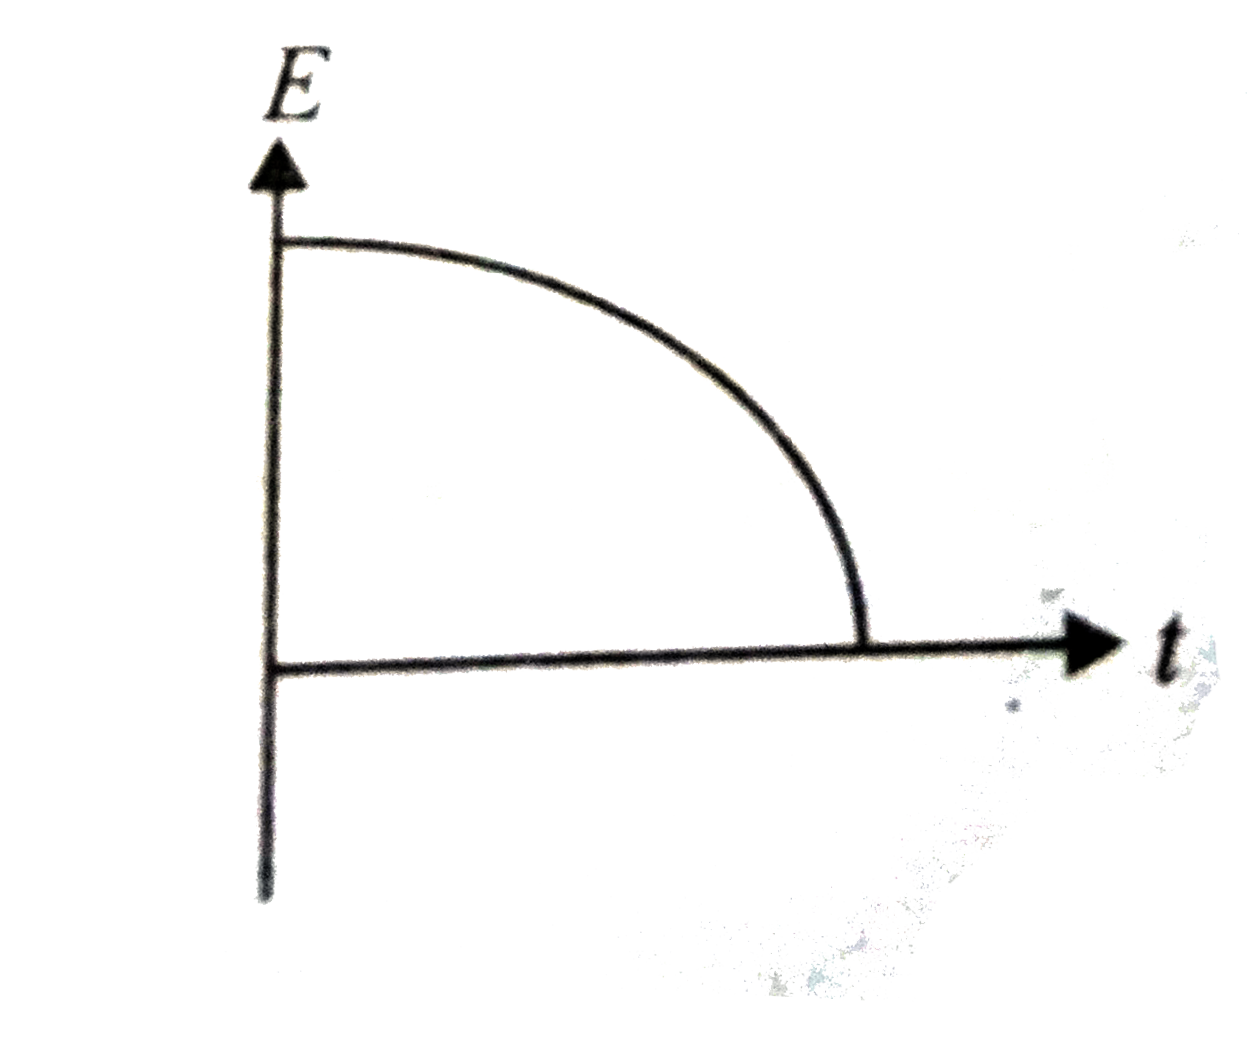 C
C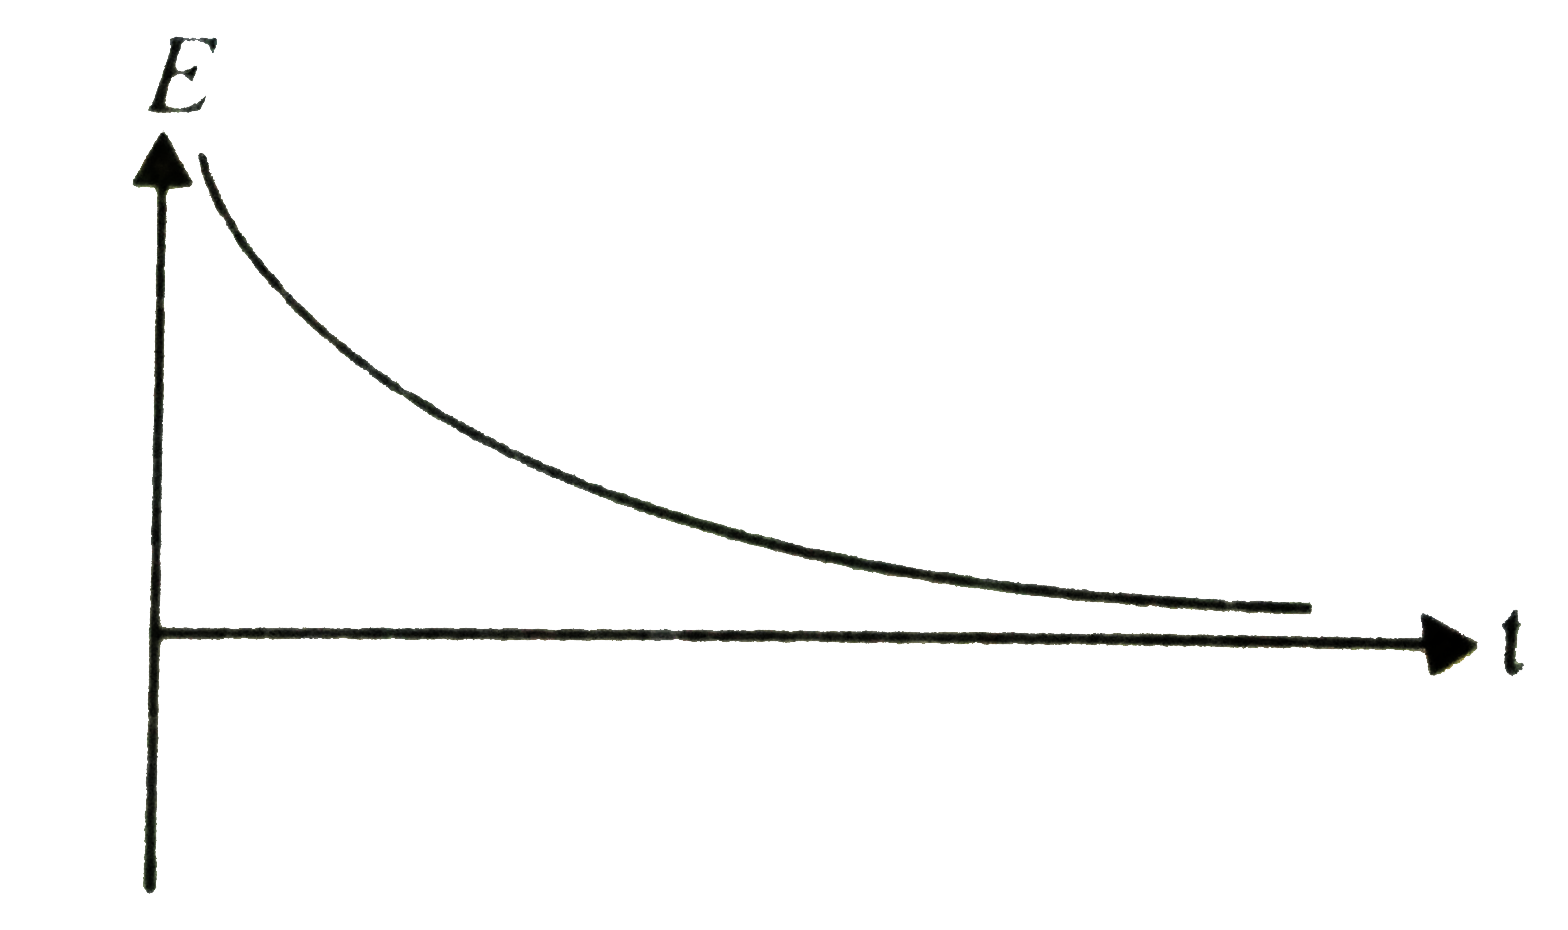 D
D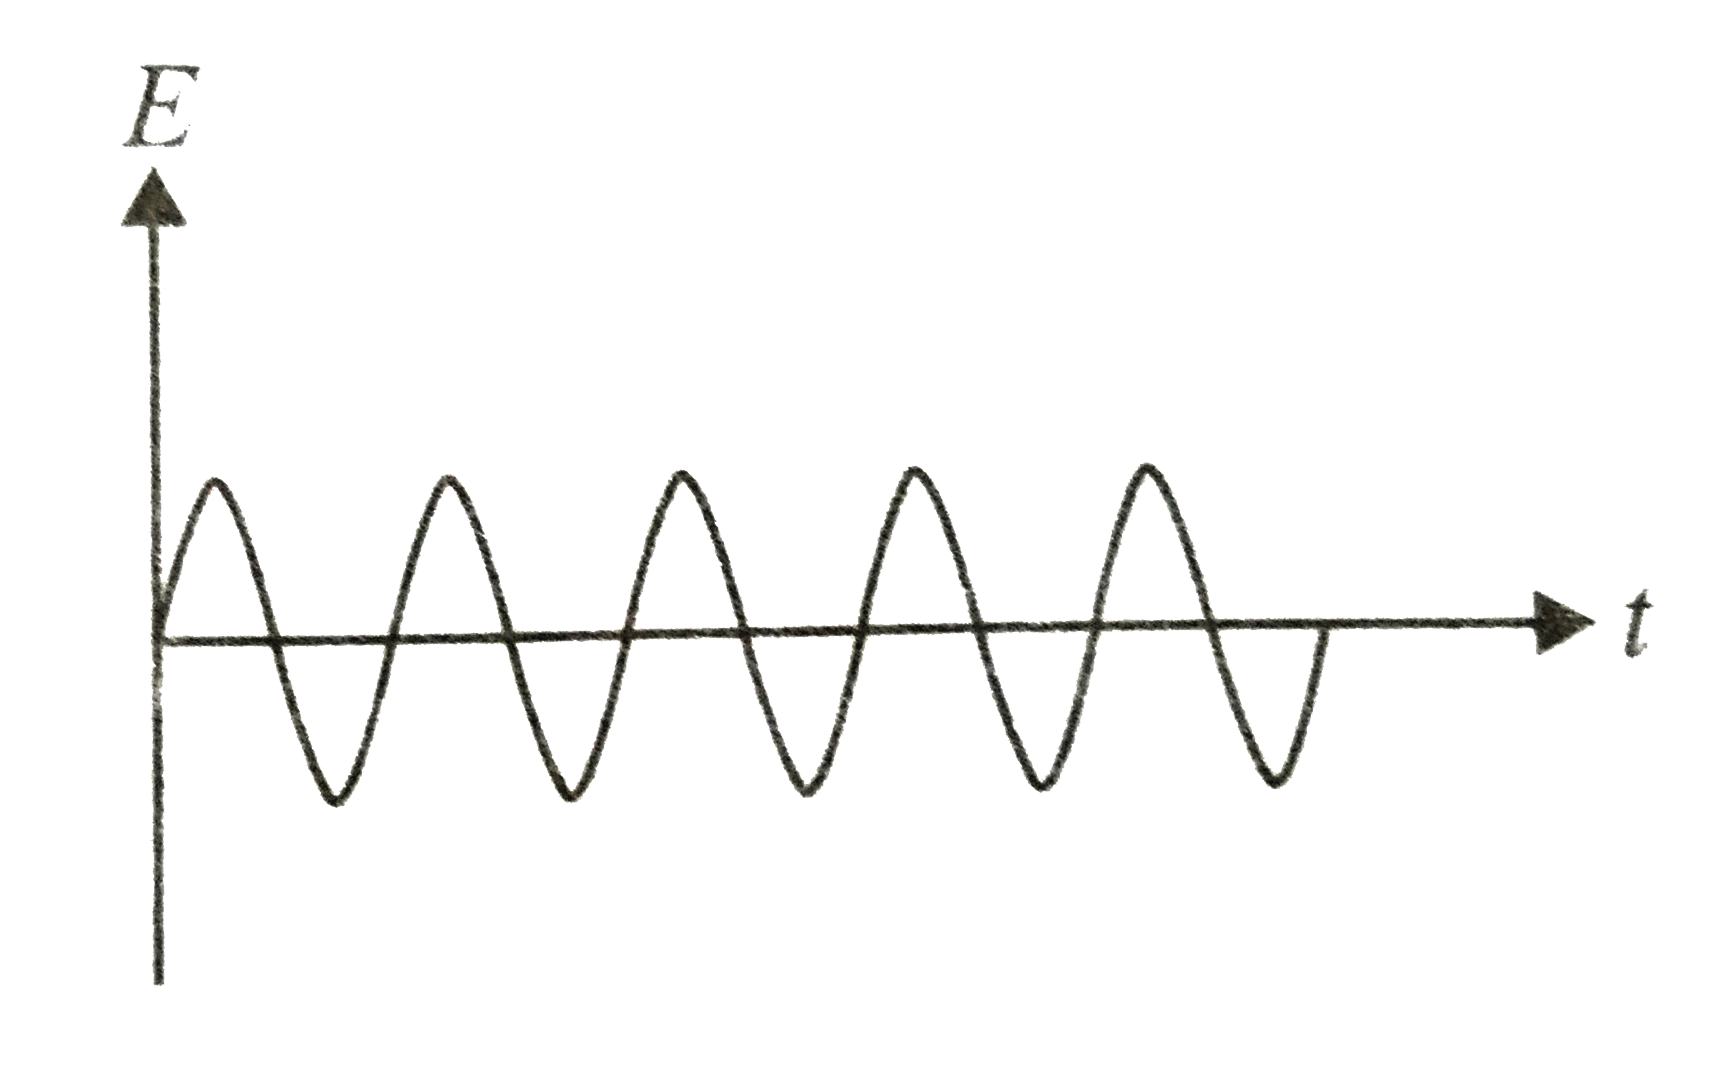
Which of the following displacement-time graphs represent damped harmonic oscillation?
A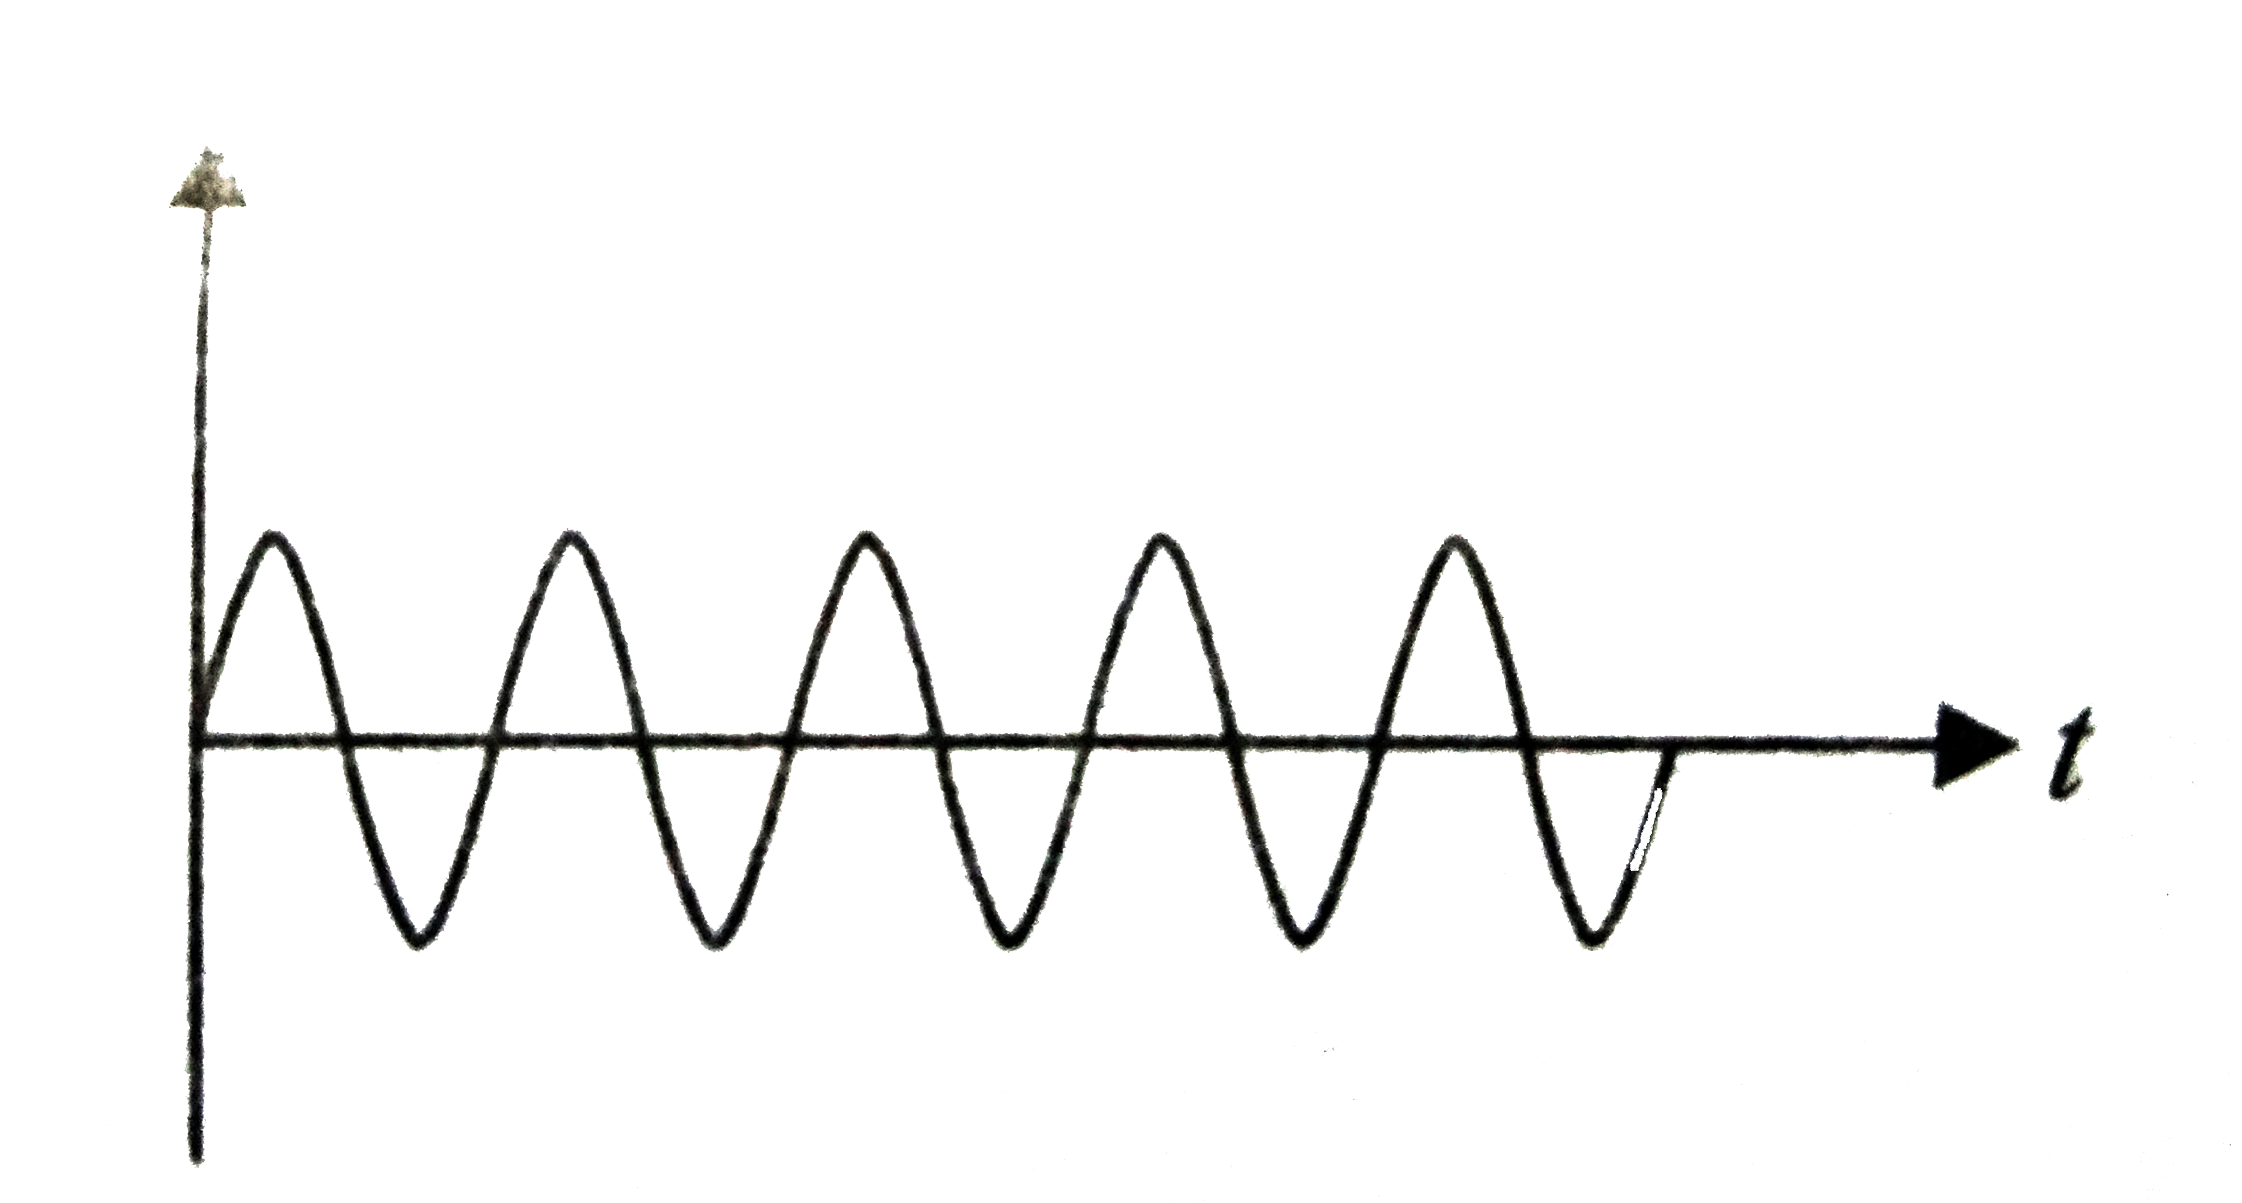 B
B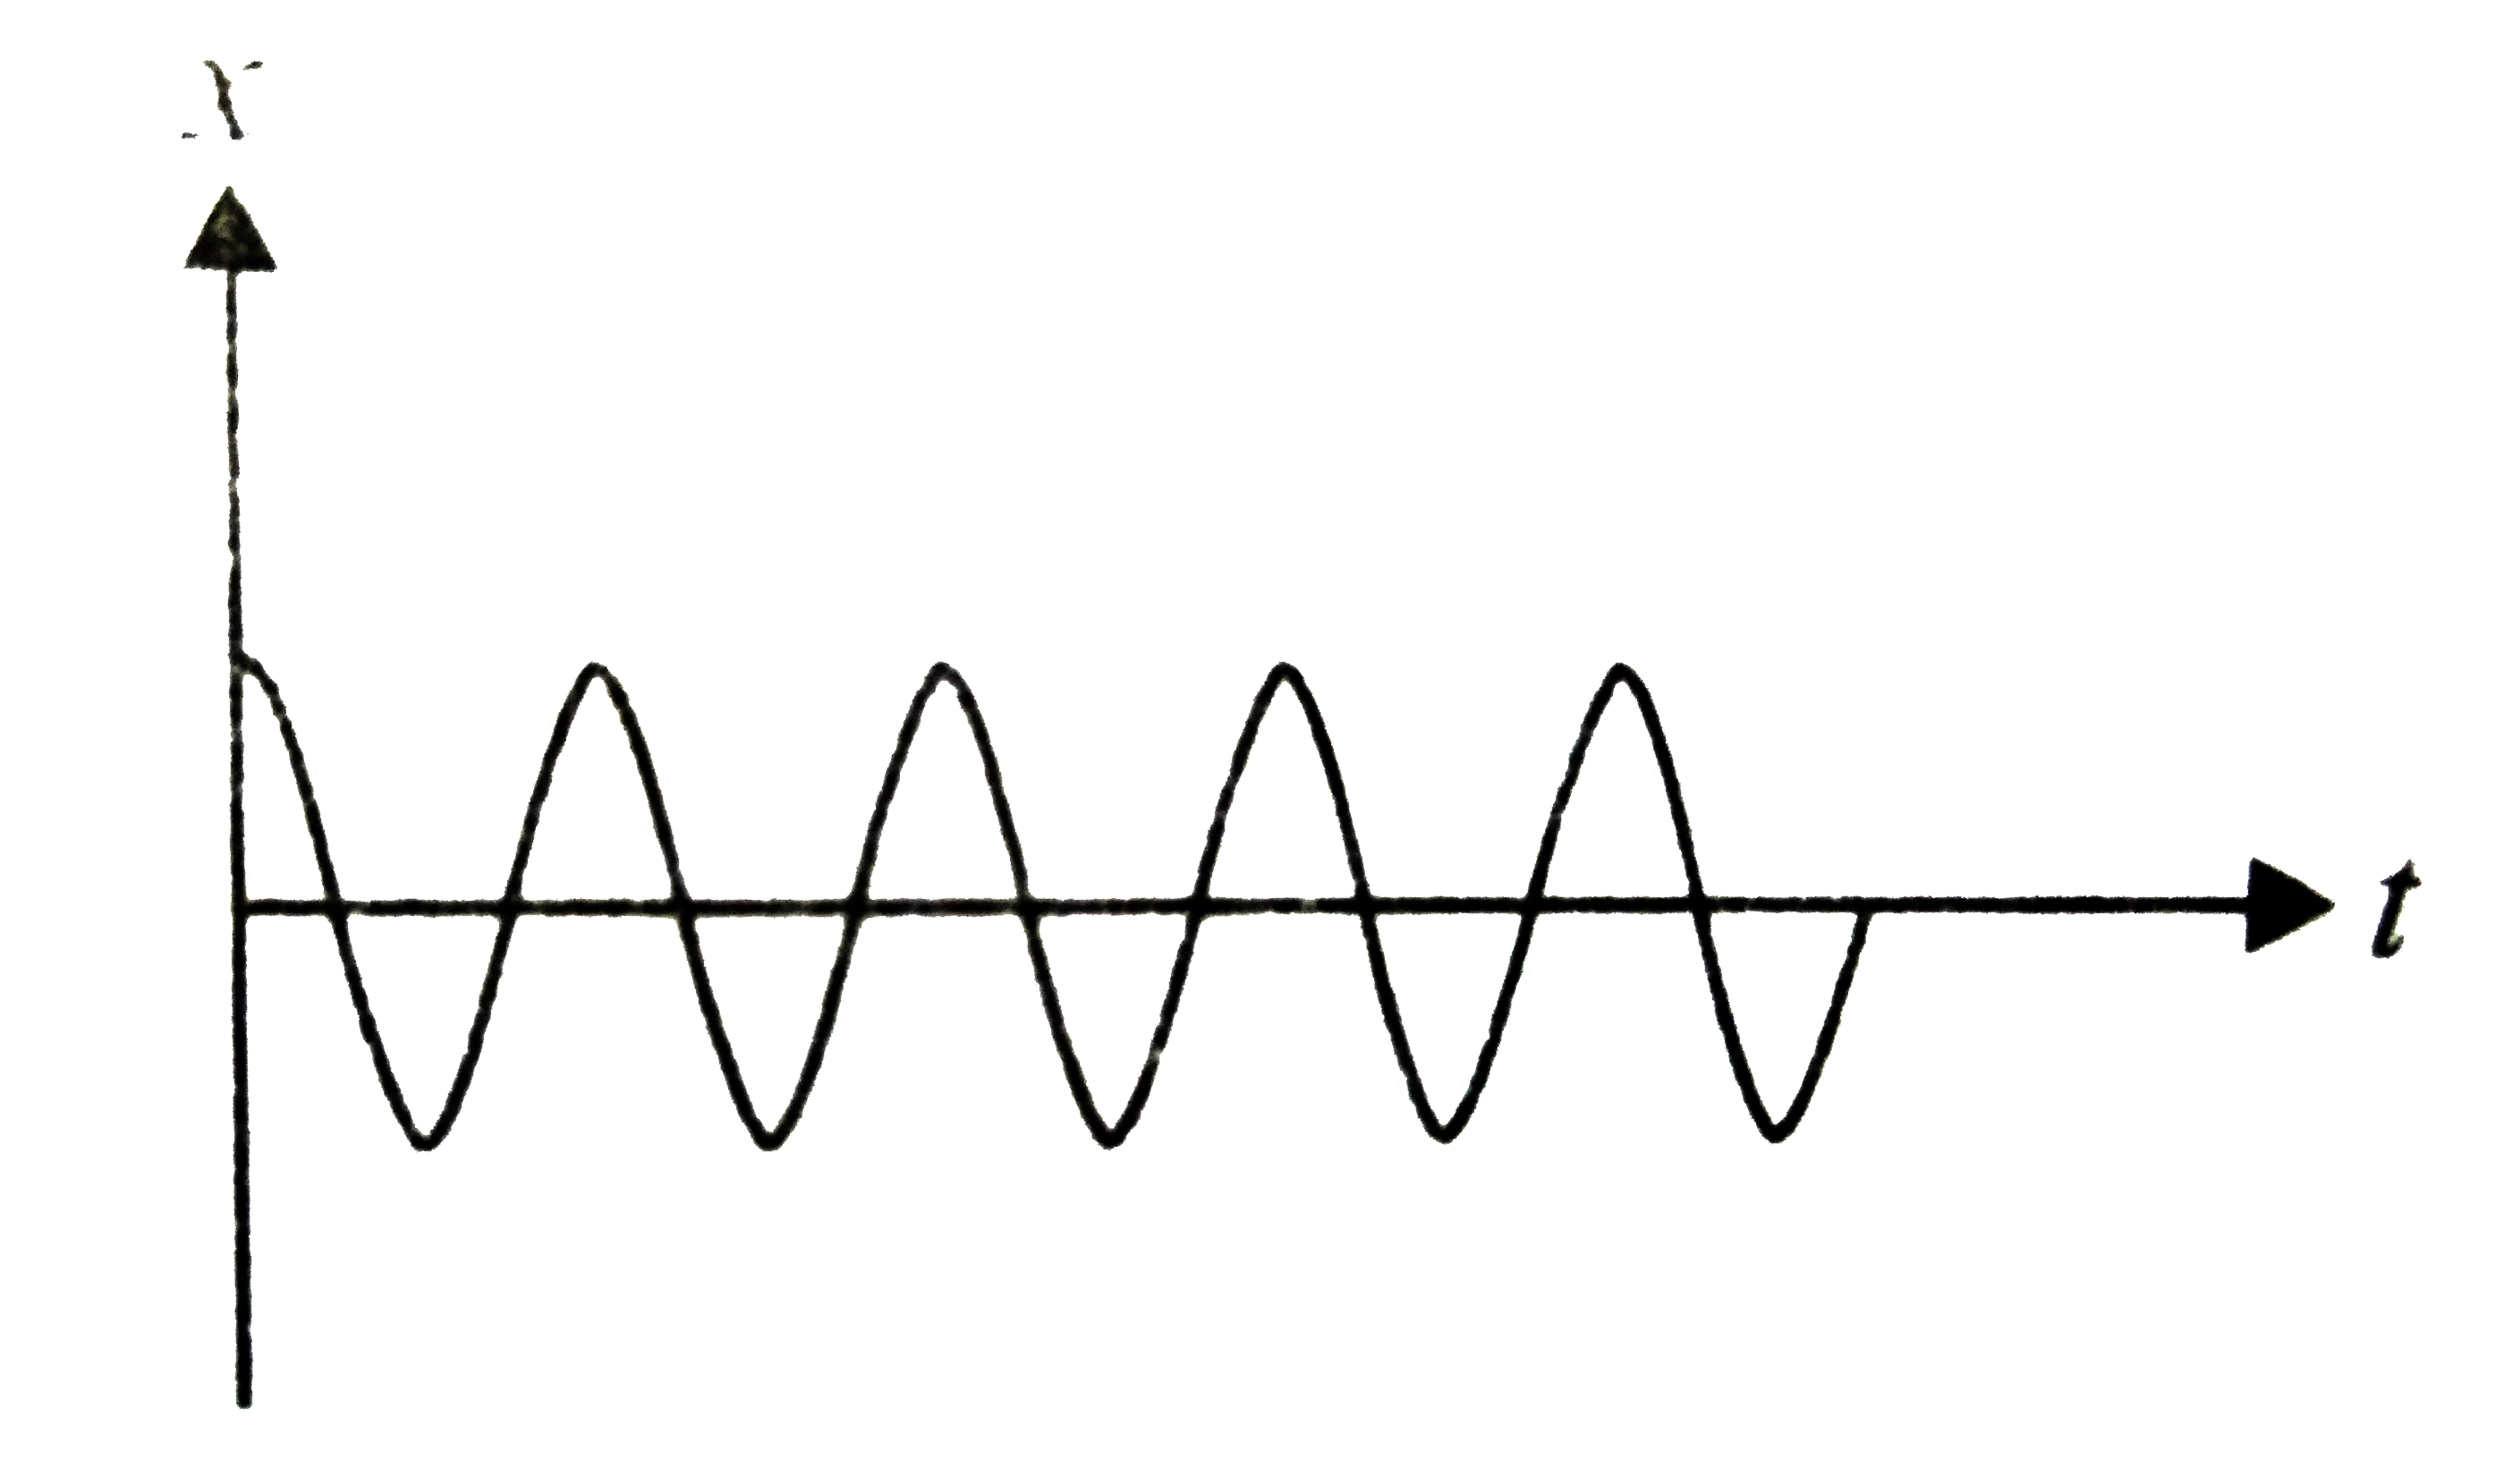 C
C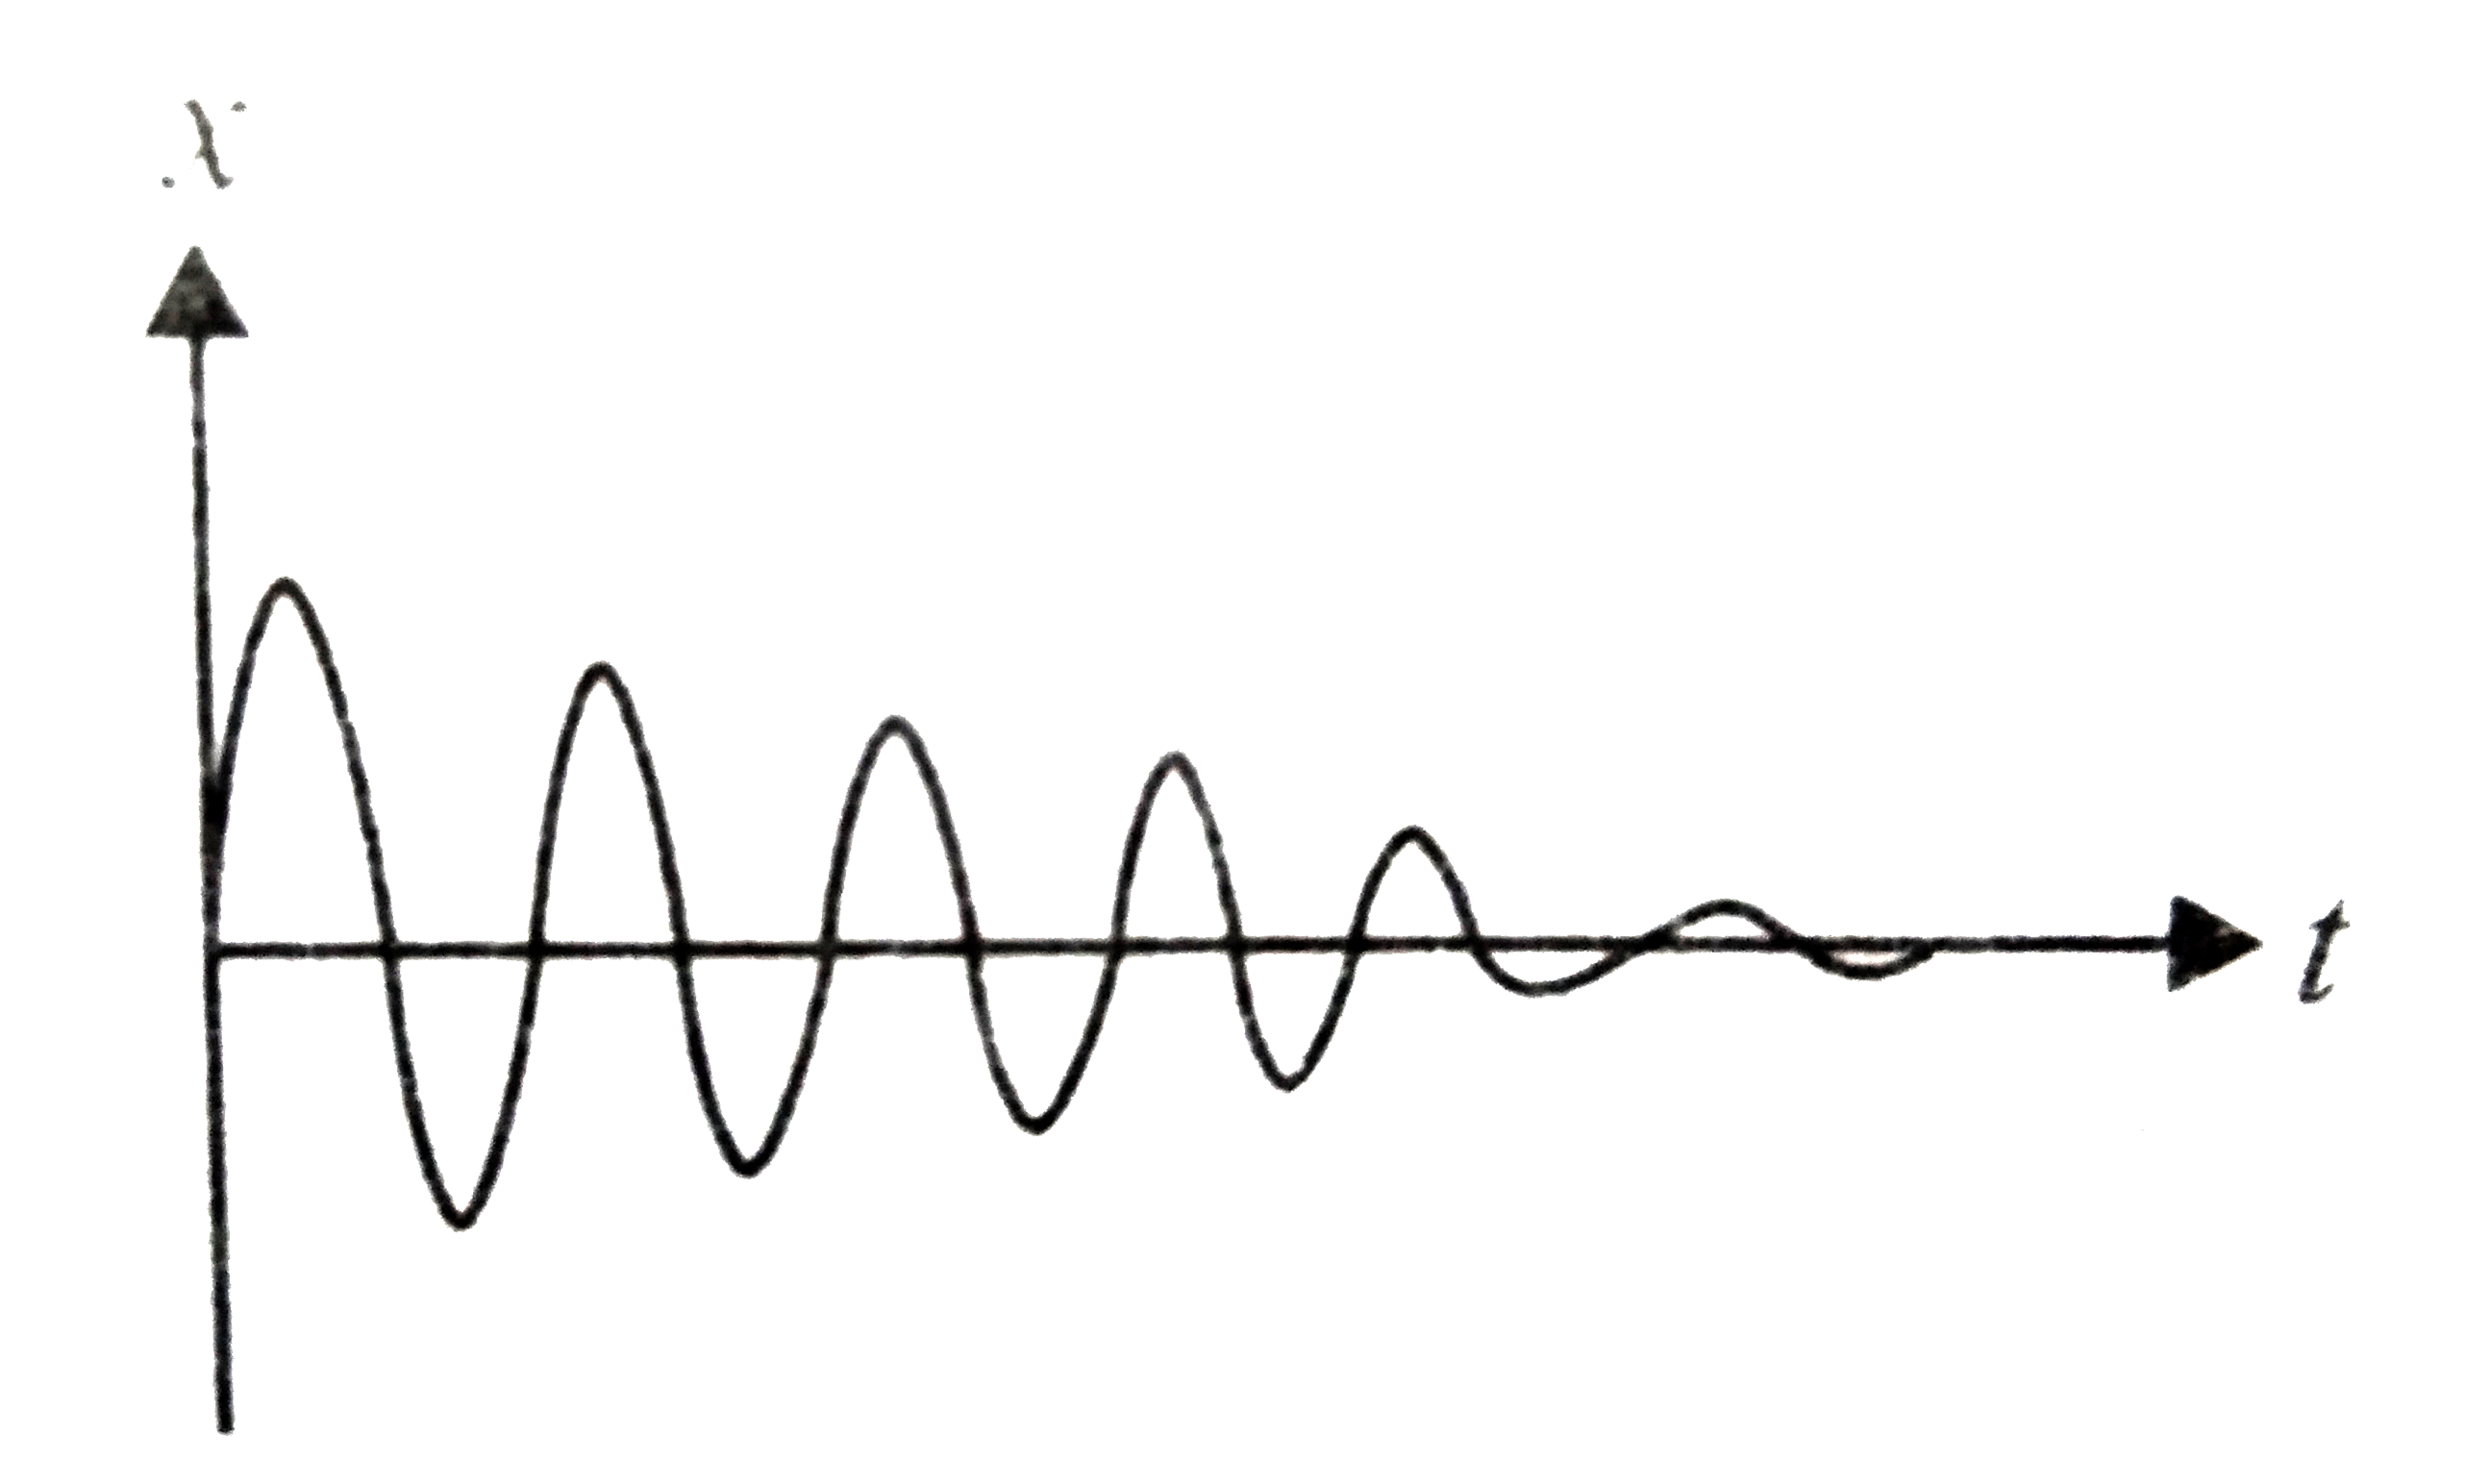 D
D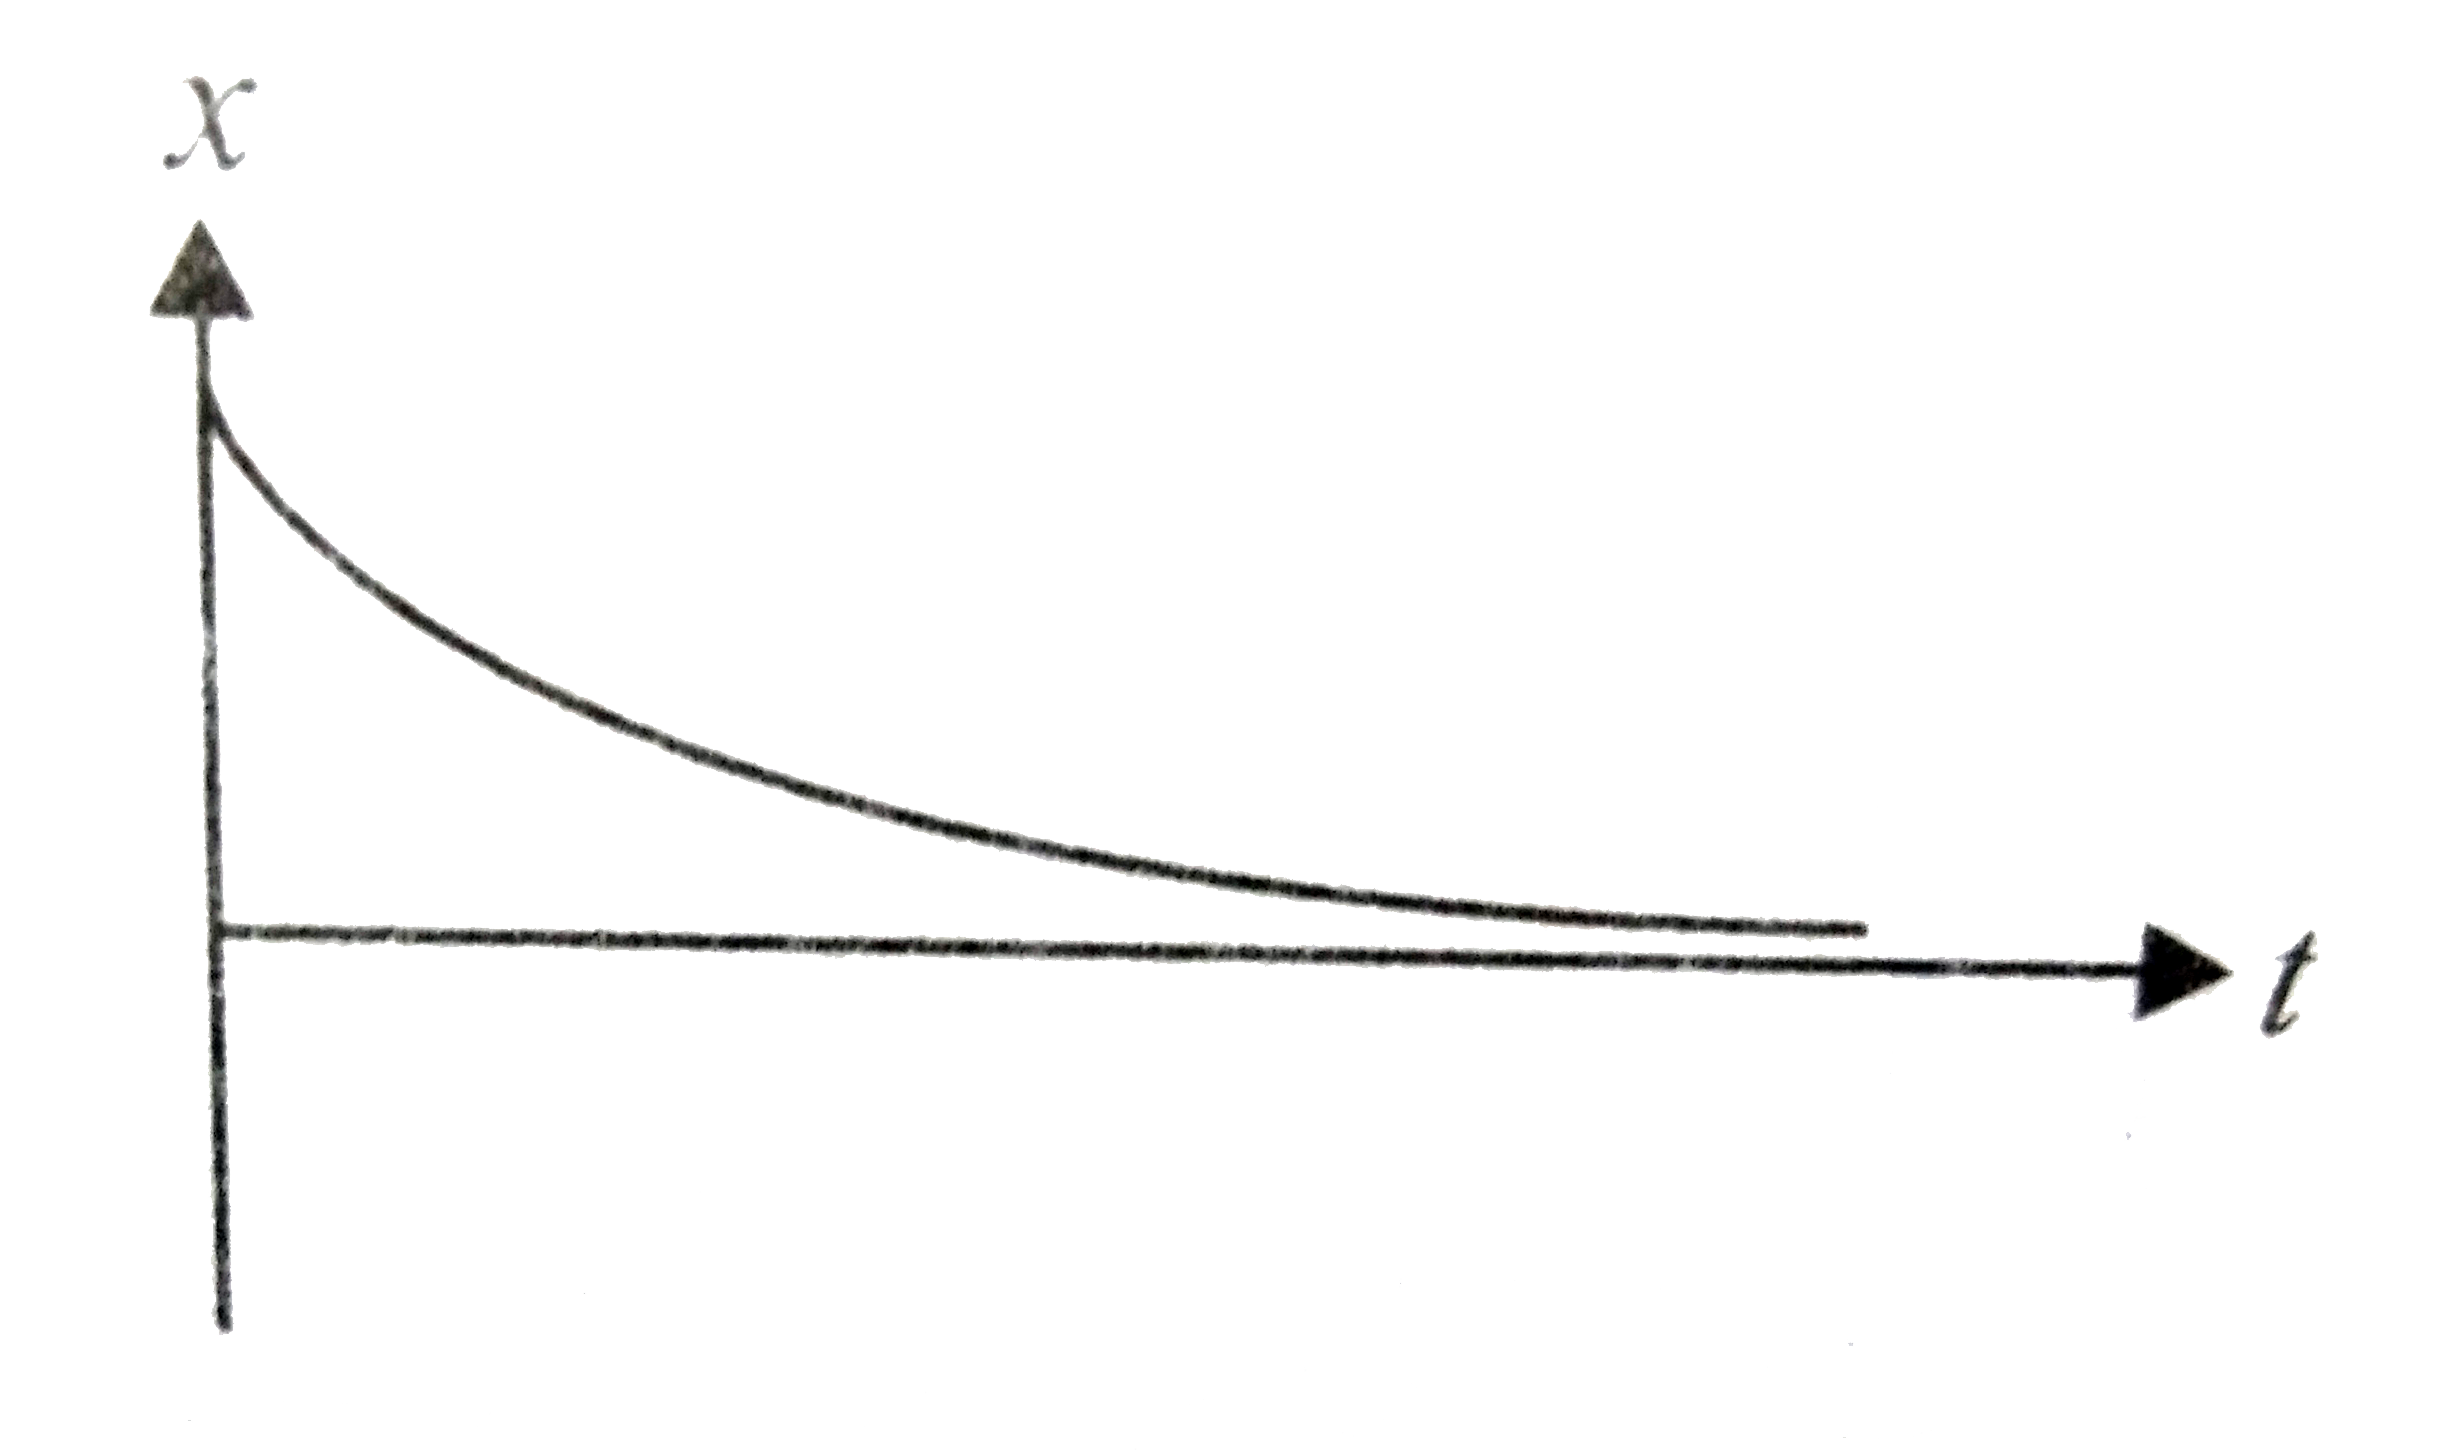
Which of the following velocity-time graphs represent uniform motion
View SolutionThe linear momentum P of a particle varies with time as follows P=a+bt2
Where a and b are constants. The net force acting on the particle is
View SolutionThe force acting on a particle moving along a straight line varies with time as shown in diagram.
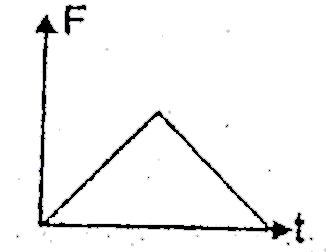
Which of the following graphs is best representative of its speed and time graphs. Initial velocity the particle is zero.
View SolutionThe force acting on a particle moving along a straight line varies with time as shown in diagram.

Which of the following graphs is best representative of its speed and time graphs. Initial velocity the particle is zero.
View SolutionThe graph in the figure shows how the displacement of a particle describing S.H.M. varies with time. Which one of the following statements is not true ?
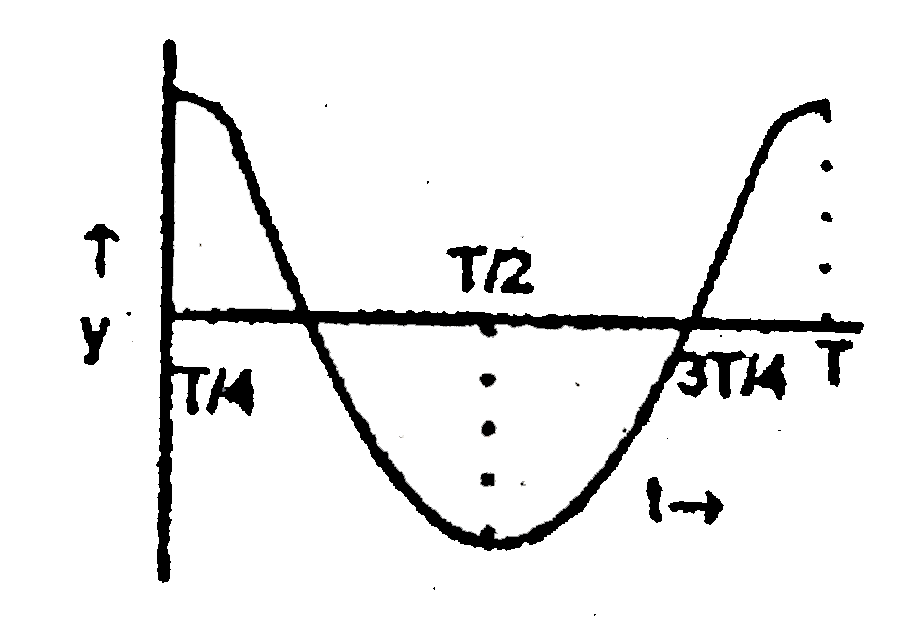
View SolutionThe charge flowing in a conductor varies with times as Q=at−bt2. Then, the current
View Solution
