which of the following graph represents the variation of resistivity () with temperature (T) for copper?
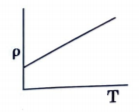
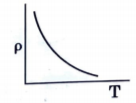
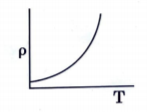
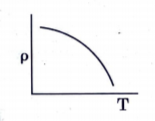
To determine the variation of resistivity (ρ) with temperature (T) for copper, we can follow these steps:
Step 1: Understand the relationship between resistivity and temperature for metals
- For metals like copper, resistivity increases with an increase in temperature. This is because, as temperature rises, the lattice ions in the metal vibrate more vigorously, leading to more frequent collisions with the conduction electrons. This results in a decrease in the mobility of the electrons, thereby increasing resistivity.
Hint: Recall that in metals, increased temperature leads to increased atomic vibrations, affecting electron flow.
Step 2: Analyze the nature of the graph
- The relationship between resistivity and temperature is not linear; instead, it is typically parabolic. This means that as temperature increases, resistivity does not just increase at a constant rate but accelerates as temperature rises.
Hint: Think about how a quadratic function behaves; it starts slow and then increases more rapidly.
Step 3: Evaluate the options given in the question
- We need to look for a graph that shows an upward curve (parabolic) as temperature increases.
- Option 1 and Option 2 would show either a linear or a decreasing trend, which is not correct for copper.
- Option 4 would also not represent the correct relationship.
- Therefore, we focus on Option 3, which should show a parabolic increase in resistivity with temperature.
Hint: Eliminate options that show a decrease or linear increase in resistivity.
Step 4: Conclusion
- Based on our analysis, the correct graph representing the variation of resistivity with temperature for copper is Option 3, which shows a parabolic increase.
Final Answer: The correct option is Option 3.
- For metals like copper, resistivity increases with an increase in temperature. This is because, as temperature rises, the lattice ions in the metal vibrate more vigorously, leading to more frequent collisions with the conduction electrons. This results in a decrease in the mobility of the electrons, thereby increasing resistivity.
- The relationship between resistivity and temperature is not linear; instead, it is typically parabolic. This means that as temperature increases, resistivity does not just increase at a constant rate but accelerates as temperature rises.
- We need to look for a graph that shows an upward curve (parabolic) as temperature increases.
- Option 1 and Option 2 would show either a linear or a decreasing trend, which is not correct for copper.
- Option 4 would also not represent the correct relationship.
- Therefore, we focus on Option 3, which should show a parabolic increase in resistivity with temperature.
- Based on our analysis, the correct graph representing the variation of resistivity with temperature for copper is Option 3, which shows a parabolic increase.
Topper's Solved these Questions
Similar Questions
Which one of the following given graphs represents the variation of rate constant (k) with temperature (t) for an endothermic reaction ?
View SolutionWhich one of the following given graphs represents the variation of rate constant (k) with temperature (f) for an endothermic reaction ?
View Solution
Knowledge Check
which of the following graph represents the variation of resistivity (ρ) with temperature (T) for copper?
A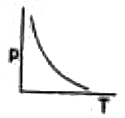 B
B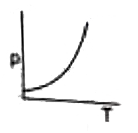 C
C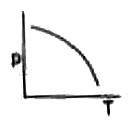 D
D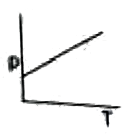
Arrhenius equation is :
k=Ae−E/RT
Which of the following graphs represents the variation of rate constant k against temperatureT ?A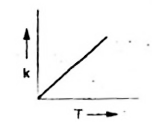 B
B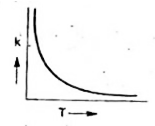 C
C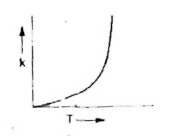 D
D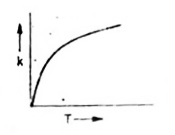
Which of the following graphs represents ohmic resistance?
A B
B C
C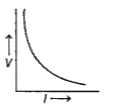 D
D
Show variation of resistivity of SI with temperature in a graph.
View SolutionArrehnius equation is :
k=Ae−Ea/RT
Which of the following graphs represents the variation of rate constant k against temerature T?
View SolutionWhich one of the following graphs represents the variation of surface tension of water with temperture for a small range of temperature ?
View SolutionWhich of the following curve represent variation of density of water with temperature best-
View SolutionWhich one of the following graphs represents variation of specific heat capacity of water with temperature?
View Solution
