Construct a histogram from a following
distribution of total marks obtained by 65
students of IX class in the final examination:

Text Solution
The given frequency distribution is not continuous. So, we first convert it into a continuous frequency distribution.
The difference between the lower limit of a class and the upper limit of the preceding class is
10 i.e. h=10
To convert the given frequency distribution into a continuous frequency distribution, we subtract h2=102=5 from each lower limit and add
h2=5 to each upper limit.
The distribution so obtained is as given below:


|
Topper's Solved these Questions
Similar Questions
Knowledge Check
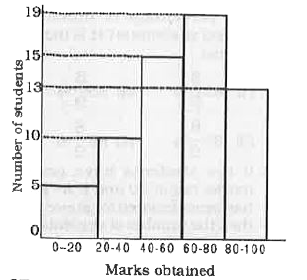
In each of the following questions, the following histogram shows the relationship between the marks obtained by the students and the number of students in an examination. Study the histogram and answer the questions.

The percentage of students who obtained 40 markks or less isA25Bless than 25, but not 15Cmore than 24D15In a class of 15 students, the total marks obtained by all the students in a test is 600. Find the average mark of the class.
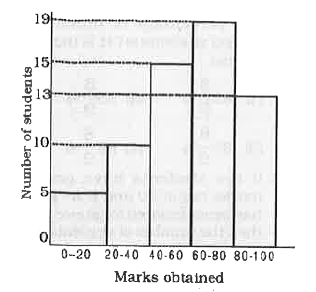
A35B30C45D40In each of the following questions, the following histogram shows the relationship between the marks obtained by the students and the number of students in an examination. Study the histogram and answer the questions.

The ratio of the number of students who obtained 60 or more marks to that of students who obtained 60 or less marks isA15:16B15:19C14:17D16:15
Construct a histogram for the following distribution:

View SolutionConstruct a histogram for the following frequency distribution :

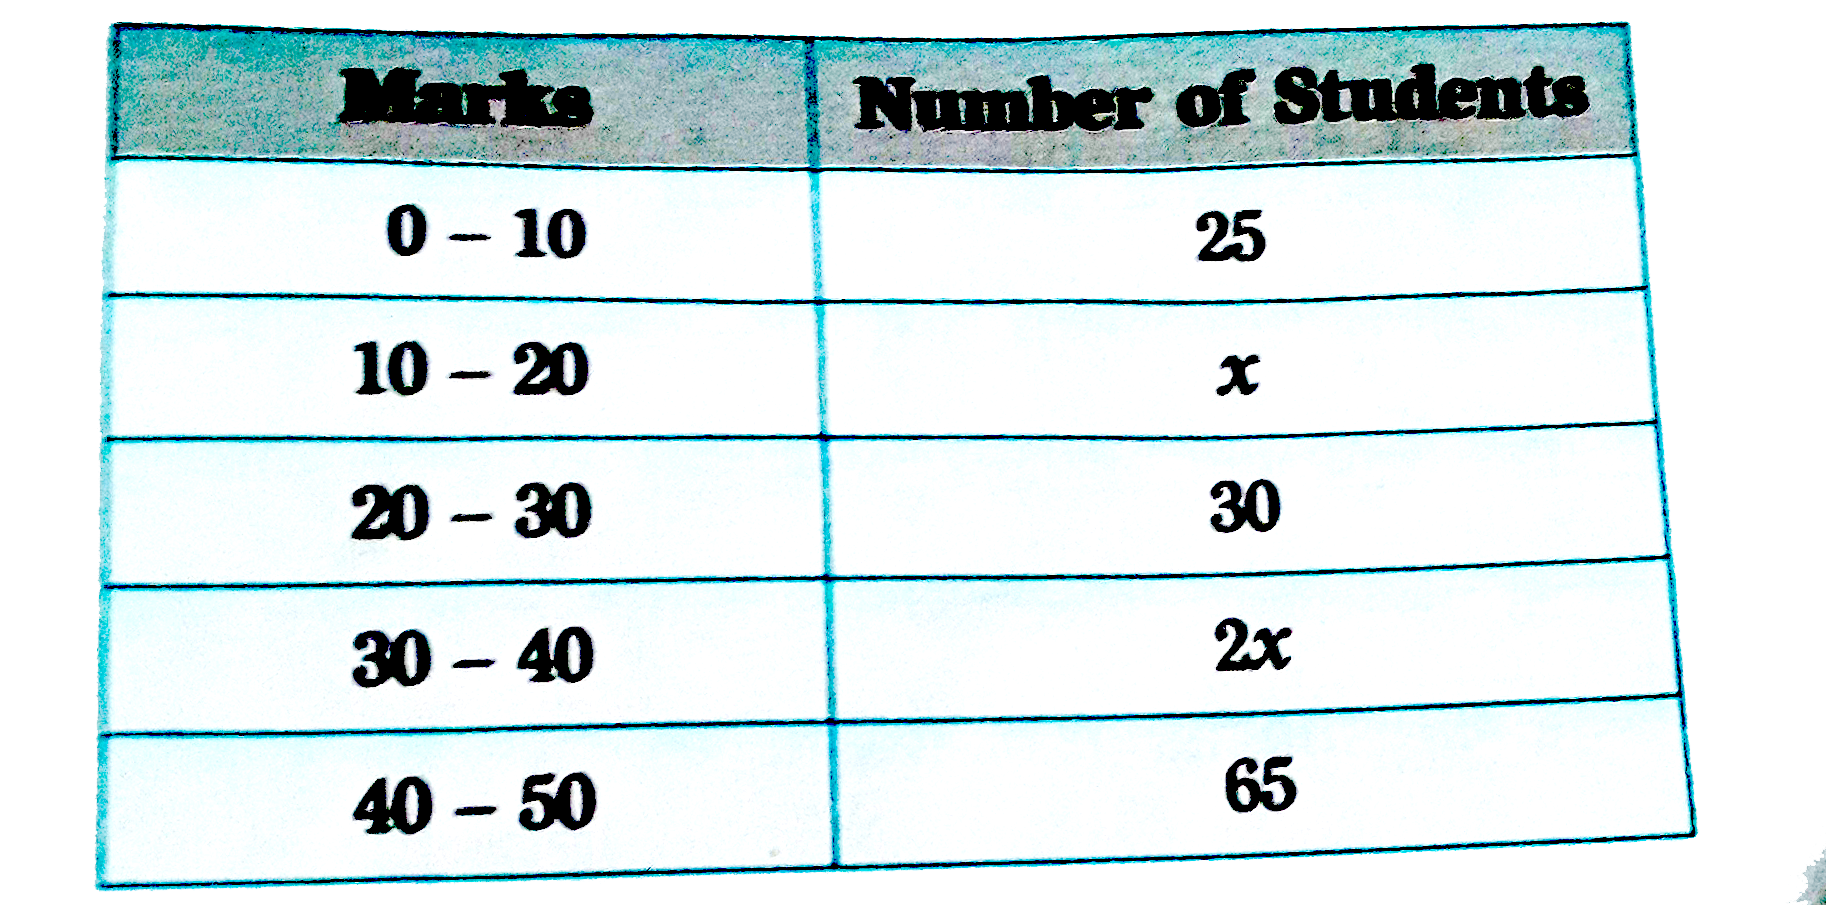
View SolutionThe following frequency distribution table shows marks obtained by 180 students in Mathematics examination :

Find the value of x.
Also draw a histogram representing the above informations.
View SolutionThere are 60 students in a class. The following is the frequency distribution of the marks obtained by the students in a test:

Where "p" is positive integer. Determine the mean and standard deviation of the marks.
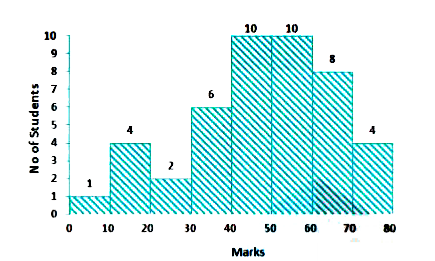
View SolutionThe histogram depicts the marks obtained by 45 students of a class. How many students obtained 50 or more marks and less than 70?

View Solution

