The results of pass percentage of Class X and XII
in C.B.S.E. examination for 5 years are given in the following table:

Draw bar graphs to represent the data.
Topper's Solved these Questions
Similar Questions
The results of pass percentage of Class X and XII in C.B.S.E examination for 5 years are given in the following table: Year, 1994-95, 1995-96, 1996-97, 1997-98, 1998-99 X, 90, 95, 90, 80, 98 XII, 95, 80, 85, 90, 95 Draw bar graphs to represent the data
View SolutionDraw a bar graph using the data given in the following table.
 View Solution
Knowledge Check
- Question 1 - Select One
The average pass percentage of girls in class XII examination in a school is 80 and that of boys is 75. The average pass percentage in class XII of that school is 76.5 Find the percentage of the number of boys in class XII of the school.
A72B60C70D65
The income of a family i different year are as follows. Draw a bar graph to represent the data
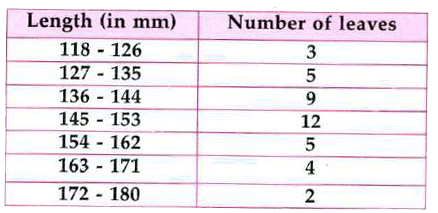
View SolutionThe length of 40 leaves of a plant are measured correct to one millimetre, and the obtained data is represented in the following table:

Draw a histogram to represent the given data. [Hint: First make the class intervals continuous]View SolutionThe expenditure of a family of different heads in a month is given below

Draw a bar graph to represent the data above.View SolutionGiven below is the data of school going students (boys and girls):

Draw the bar graph to represent the above data.View SolutionDraw a line graph to represent the runs made by different batsmen in a match whose details are given in the following table:
 View Solution
70 students from a locality use different modes of transport to go to school as given below:
 Draw the bar graph representing the above data.View Solution
70 students from a locality use different modes of transport to go to school as given below:

Draw the bar graph representing the above data.View Solution

