The following data shows the average age of men in
various countries in a certain year:

Represent the above information by a bar graph.
Topper's Solved these Questions
Similar Questions
The following data shows the average age of men in varicus countries in a certain year: Country, India, Nepal, China, Pakistan, U.K., U.S.A Average age (in years), 55, 52, 60, 50, 70, 75 Represent the above information by a bar graph.
View SolutionThe following table shows the marks obtained by Sumit in the annual examination.

Draw a bar graph to show the above information.View SolutionThe following table shows the number of fruits in a fruit shop. Represent the above data by a bar graph
View SolutionThe following data shows the number of students who attended the school on weekdays. Draw a bar graph to represent information by using appropriate scale.
 View Solution
The following table shows the number of illitrate persons in the age group (10-58 Years) in a town. Represents the given data by means of a histogram.
 View Solution
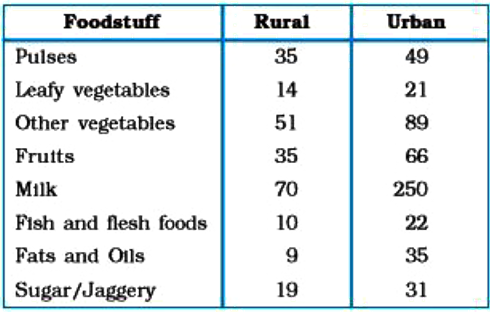
The following table shows the average intake of nutrients in calories by rural and urban groups in a particular year. Using a suitable scale for the given data, draw a double bar graph to compare the data.
 View Solution
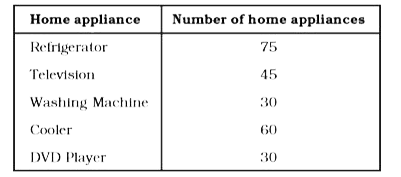
Home appliances sold by a shop in one month are given as below:

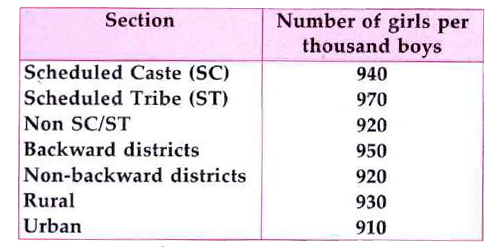
Draw a bar graph to represent the above information.View SolutionThe following data on the number of girls (to the nearest ten) per thousand boys in different sections of Indian society is given below

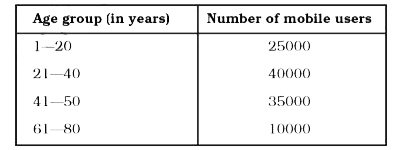
Represent the information above by a bar graph.View SolutionNumber of mobile phone users in various age groups in a city is listed below:

Draw a bar graph to represent the above information.View SolutionFollowing are the data about the number of men and women in different age groups in a society. Present the information in the form of a two-way table.
 View Solution

