Draw the graph of the relation y=|x|√1−x2
Video Solution
Text Solution
We have y=f(x)=|x|√1−x2
fx is defined if 1−x2≥0
or x∈[−1,1]
For x≥0,f(x)=x√1−x2
f(0)=0
f(x)=0∴x=0,1
Thus, the graph meets the x-axis at (0,0) and (1,0)
Also f(x)≥0 for x≥0
f′(x)=1.√1−x2−xx√1−x2
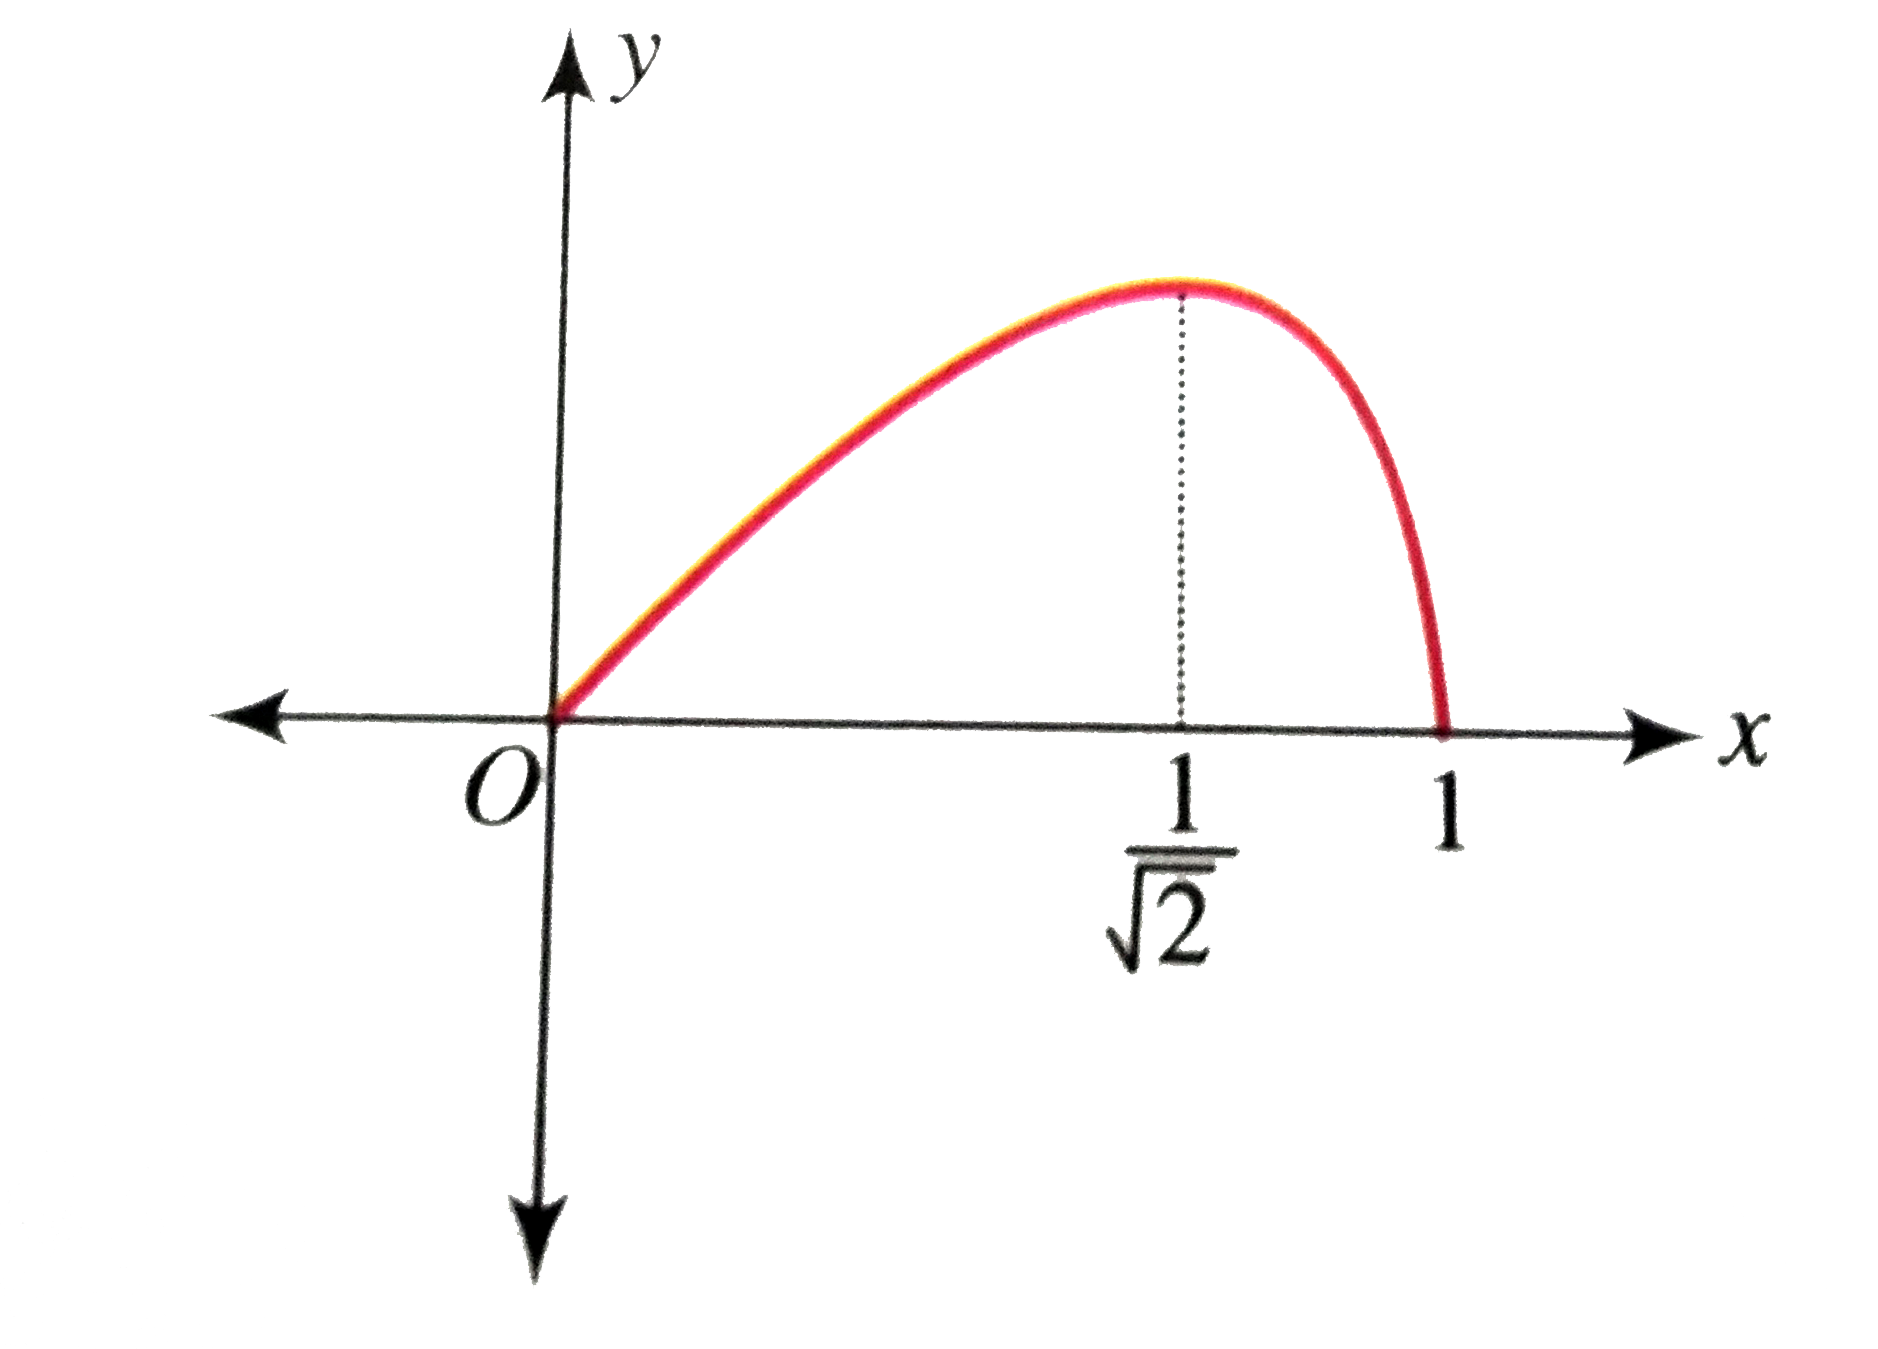
f′(x)=0∴x=1√2, which is the point of maxima.
So the graph of the function for x≥0 is as shown in the following figure.

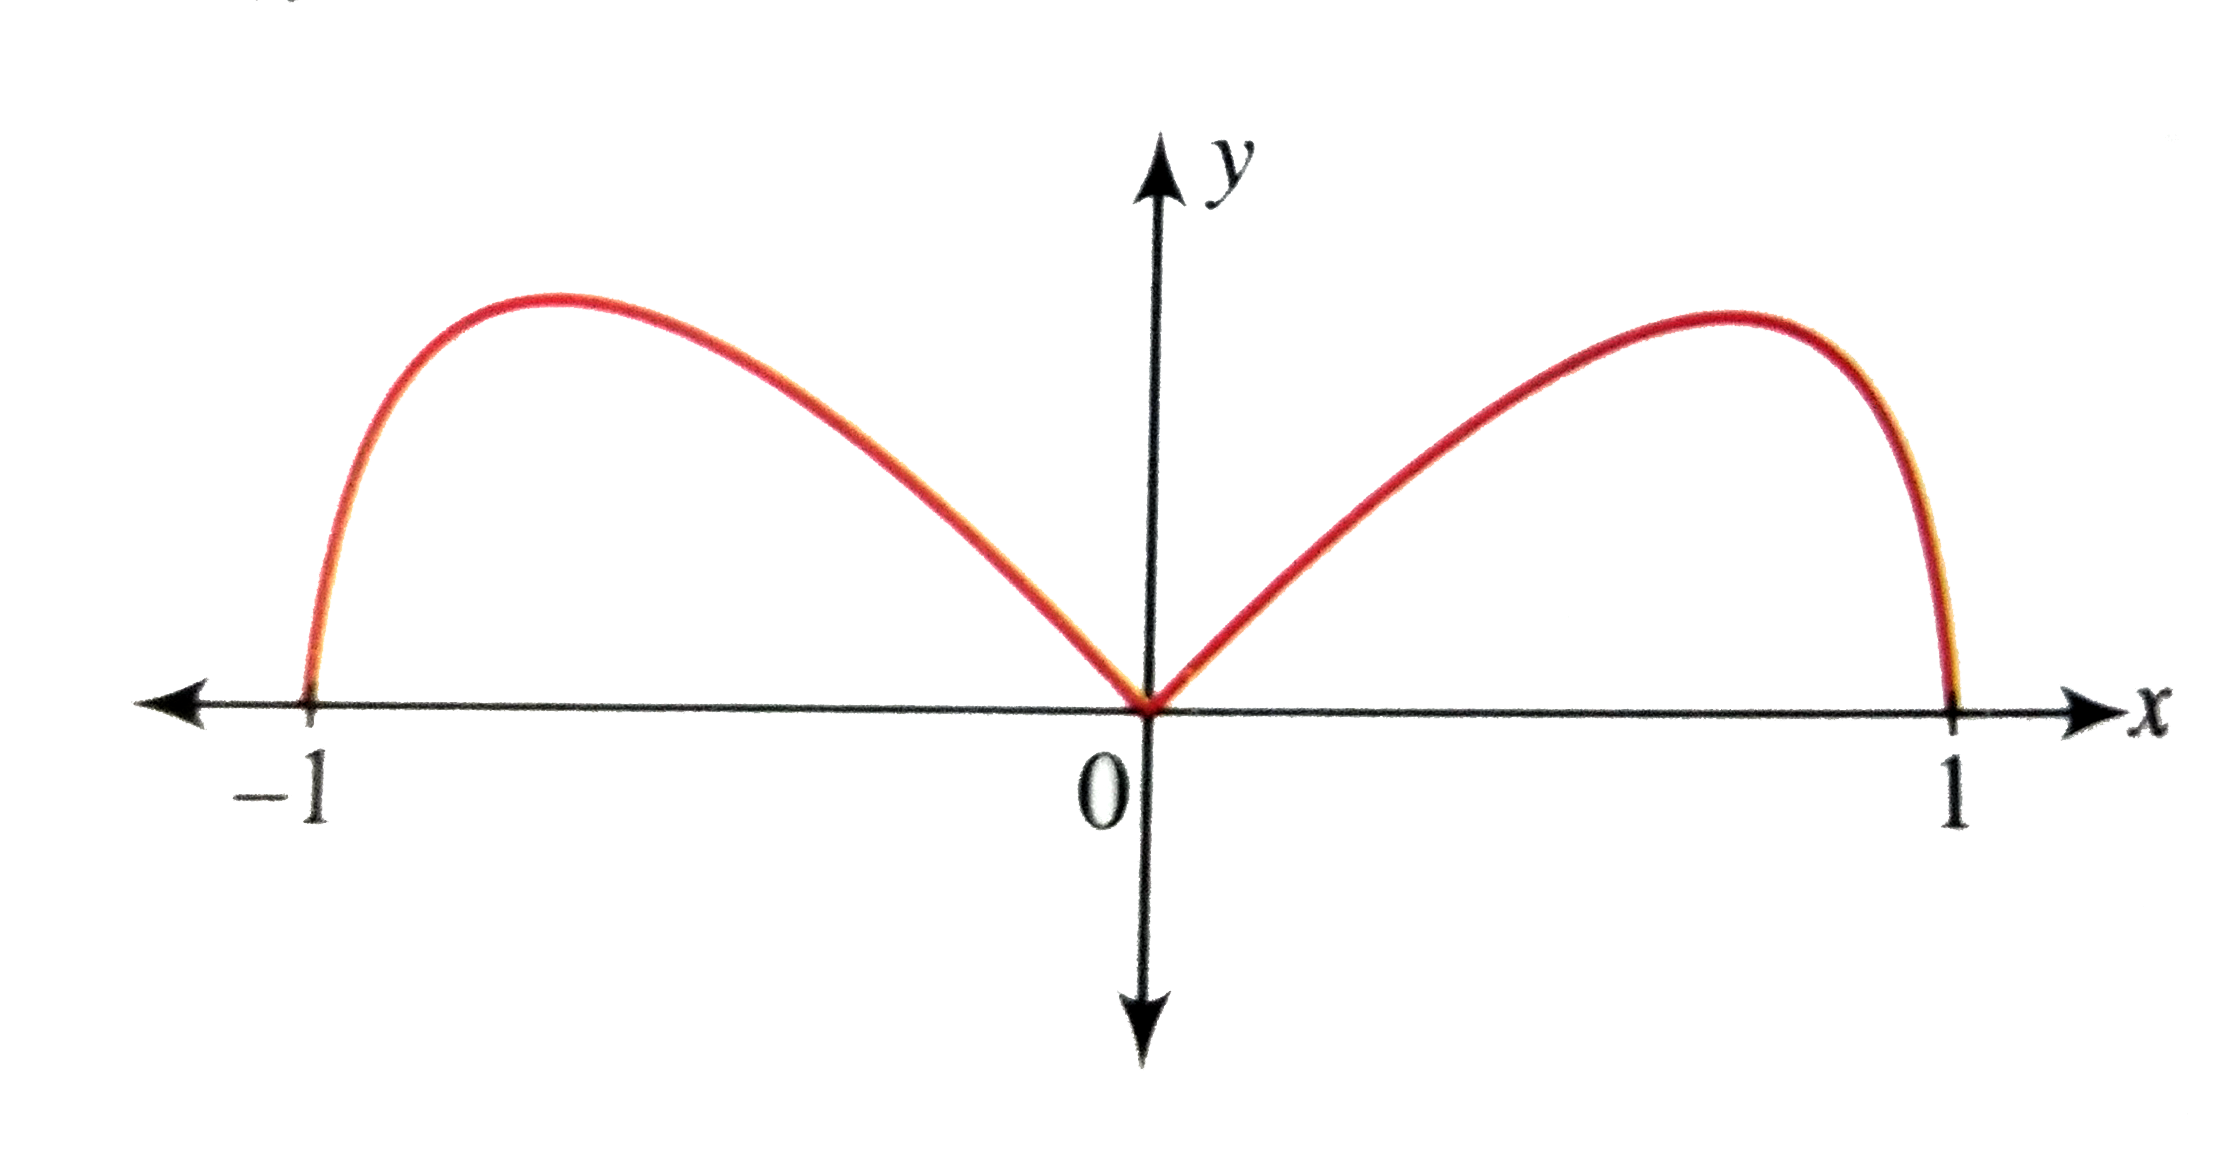
When x<0, y=−x√1−x2, graph of which can be obtained by reflecting the above graph in the y-axis.
Hence the graph of the function for its entire domain is as shown in the following figure.

|
Updated on:21/07/2023
Topper's Solved these Questions
Similar Questions
Draw the graph of the relation y2=x2(1−x)
View SolutionDraw the graph of the relation 4y2=x2(4−x2)
View SolutionDraw the graph of the relation y2=x5(2−x)
View SolutionDraw the graph of the relation (y−x)2=x3
View SolutionDraw the graph of y=2x.
View SolutionDraw the graph of y=|x|
View SolutionDraw the graph of the relation y2(x−1)=x2(1+x)
View SolutionDraw the graph of y=2x−1
View SolutionDraw the graph of y=x+1x
View SolutionDraw the graph of y=|x|+2
View Solution

