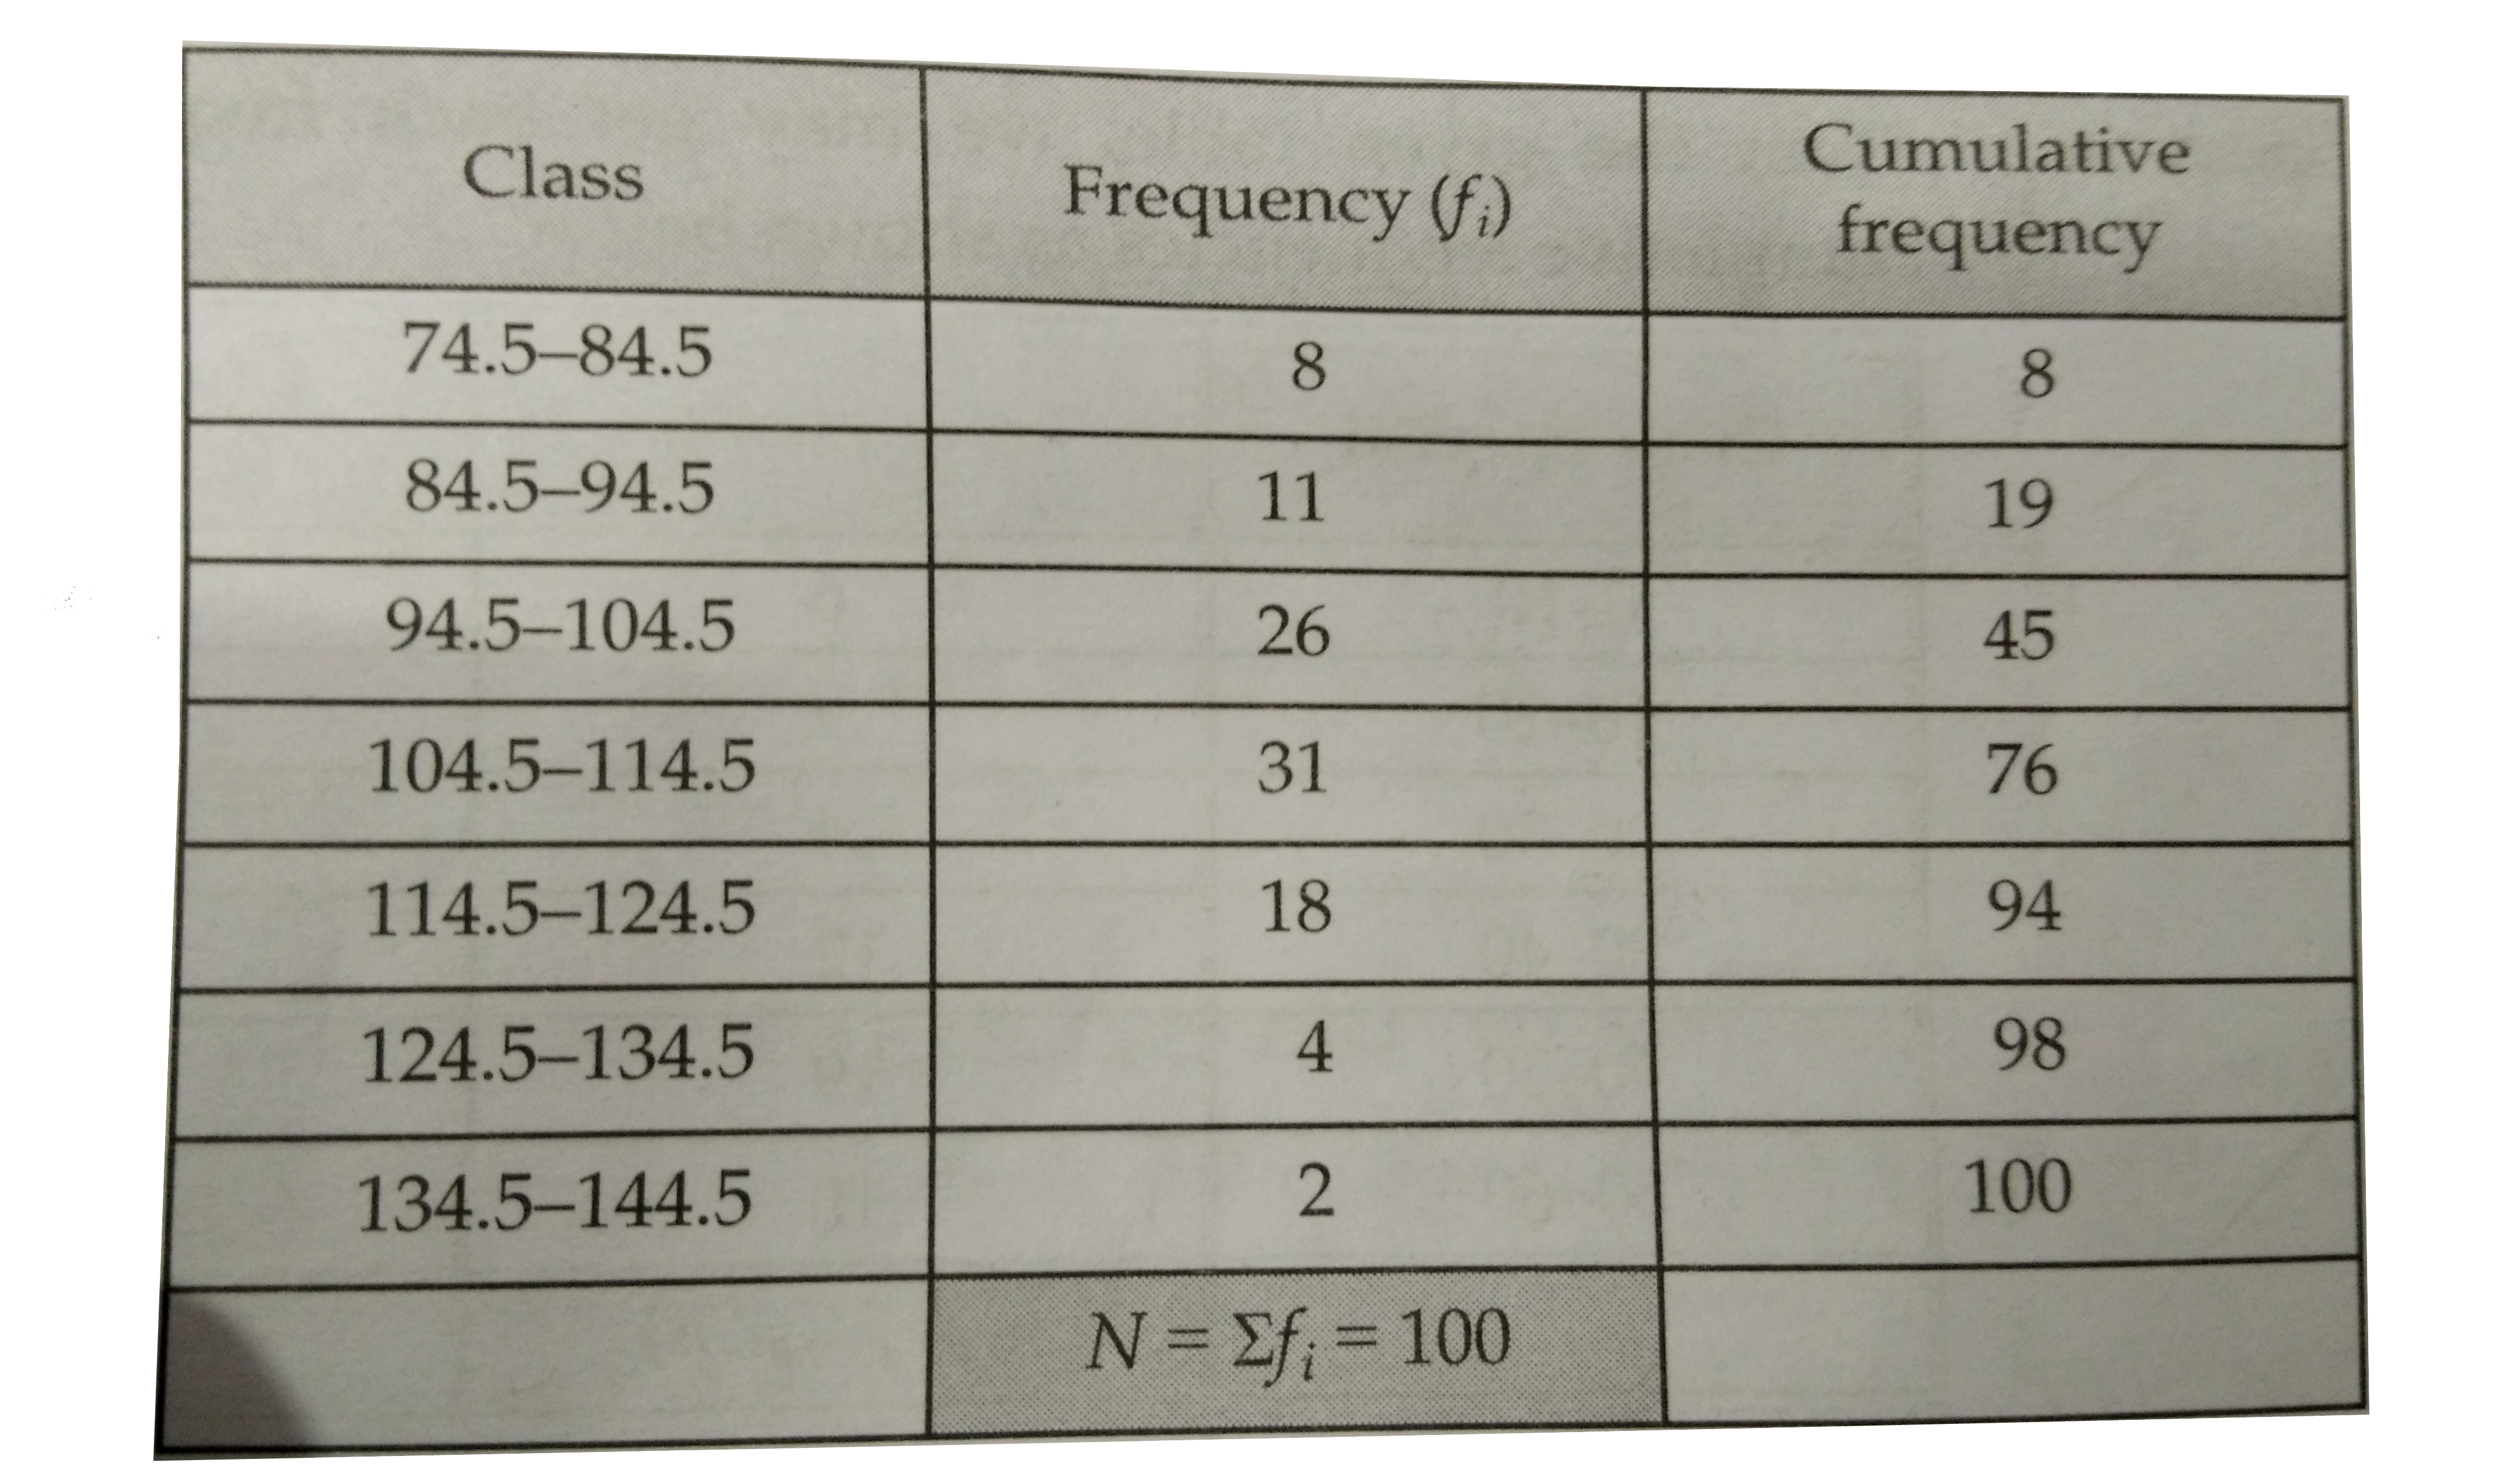
Given below is the distribution of IQ of 100 students . Find the median IQ

The given series is in inclusive form . Converting it to exclusive form and preparing the cumulative frequncy table , we get

Now N=100⇒N2=50
The cumulative freqeuency just greater than 50 is 76 and the corresponding class is 104.5-114.5
Thus the median class is 104.5-114.5
l=104.5,h=10,f=31,cf=c.f of preceding class =45andN2=50
Median Me=l+⎧⎪
⎪⎨⎪
⎪⎩h×(N2−cf)f⎫⎪
⎪⎬⎪
⎪⎭
104.5+{10×(50−45)31}=104.5+5031
104.5+1.6=106.1.
Hence , the median IQ is 106.1
Topper's Solved these Questions
- MEAN,MEDAN,MODE OF GROUPED,DATA CUMULATIVE FREQUENCY GRAPH AND OGIVE BOOK - RS AGGARWALCHAPTER - MEAN,MEDAN,MODE OF GROUPED,DATA CUMULATIVE FREQUENCY GRAPH AND OGIVE EXERCISE - MISCELLANEOUS QUESTIONS ON MEAN,MODE AND MEDIAN
1 Videos
- MEAN,MEDAN,MODE OF GROUPED,DATA CUMULATIVE FREQUENCY GRAPH AND OGIVE BOOK - RS AGGARWALCHAPTER - MEAN,MEDAN,MODE OF GROUPED,DATA CUMULATIVE FREQUENCY GRAPH AND OGIVE EXERCISE - Exercise 18A
2 Videos
- MEAN,MEDAN,MODE OF GROUPED,DATA CUMULATIVE FREQUENCY GRAPH AND OGIVE BOOK - RS AGGARWALCHAPTER - MEAN,MEDAN,MODE OF GROUPED,DATA CUMULATIVE FREQUENCY GRAPH AND OGIVE EXERCISE - Test Yourself
18 Videos
- LINEAR EQUATIONS IN TWO VARIABLES BOOK - RS AGGARWALCHAPTER - LINEAR EQUATIONS IN TWO VARIABLES EXERCISE - QUESTION
2 Videos
- PERIMETER AND AREA OF PLANE FIGURES BOOK - RS AGGARWALCHAPTER - PERIMETER AND AREA OF PLANE FIGURES EXERCISE - TEST YOURSELF (SHORT -ANSWER QUESTIONS)
1 Videos
Similar Questions
Following is the distribution of I.Q. of 100 students. Find the median I.Q. I.Q.: 55-64 65-74 75-84 85-94 95-104 105-114 115-124 125-134 135-144 No. of Students: 1 2 9 22 33 22 8 2 1
View SolutionThe distribution below gives the weights of 30 students of a class. Find the median weight of the students.

View SolutionThe distribution below gives the weights of 30 students of a class. Find the median weight of the students.

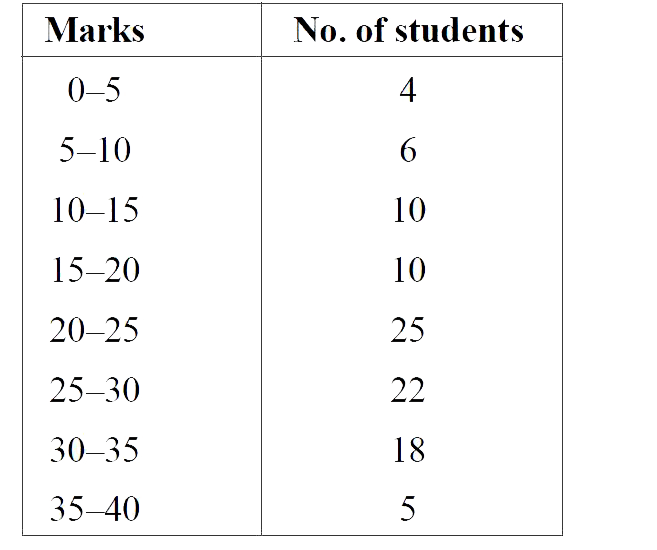
View SolutionThe following table shows frequency distribution of marks of 100 students of 10th class which they obtianed in a practice examination. Find the median of the marks.

View SolutionFollowing data gives the marks obtained by 100 students in a test. Find the median

View SolutionGiven below is the frequency distribution of daily wages (in Rs) of 130 workers.

Find the median of the daily wages of workers.
View SolutionThe distribution given below show the marks of 100 students of a class.

Draw a less than type and a more than type ogive from the given data. Hence obtain the median marks from the graph.
View SolutionThe median of the distribution given below is 14.4. Find the values of x and y, if the total frequency is 20.

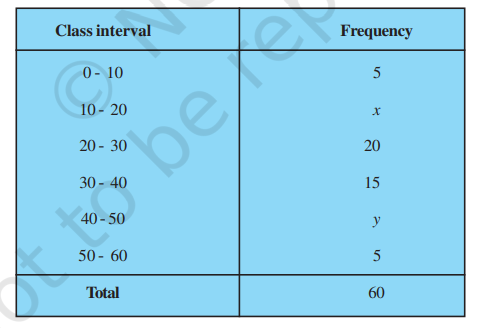
View SolutionIf the median of the distribution given below is 28.5, find the values of x and y.

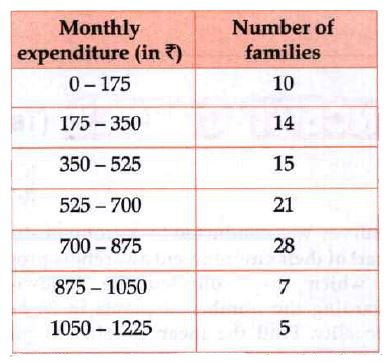
View SolutionMonthly expenditures on milk in 100 families of a housing society are given in the following frequency distribution:
Find the mode and median for this distribution.

View Solution
