IN the following table,the investment made by 210 families is shown.Present it in the form of a histogram.

|
Topper's Solved these Questions
- STATISTICS BOOK - UNIQUE PUBLICATIONCHAPTER - STATISTICS EXERCISE - PRACTICE SET 6.5
3 Videos
- STATISTICS BOOK - UNIQUE PUBLICATIONCHAPTER - STATISTICS EXERCISE - PROBLEM SET
6 Videos
- STATISTICS BOOK - UNIQUE PUBLICATIONCHAPTER - STATISTICS EXERCISE - PRACTICE SET 6.3
4 Videos
- SIMILARITYBOOK - UNIQUE PUBLICATIONCHAPTER - SIMILARITYEXERCISE - Assignment-I
5 Videos
- TRIGONOMETRYBOOK - UNIQUE PUBLICATIONCHAPTER - TRIGONOMETRYEXERCISE - ASSIGNMENT
12 Videos
Similar Questions
Knowledge Check
The process of presenting data in the form of a table in called:
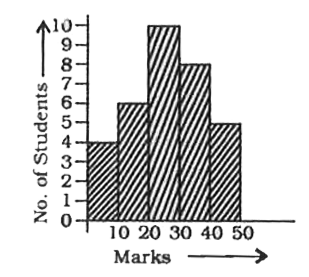
AorganisationBclassificationCpresentationDtabulationStudy the following Histogram and answer the following questions.

The difference in the amount estimated by the family on interior decoration and architect's fees isARs 10000BRs 9500CRs 7200DRs 9600
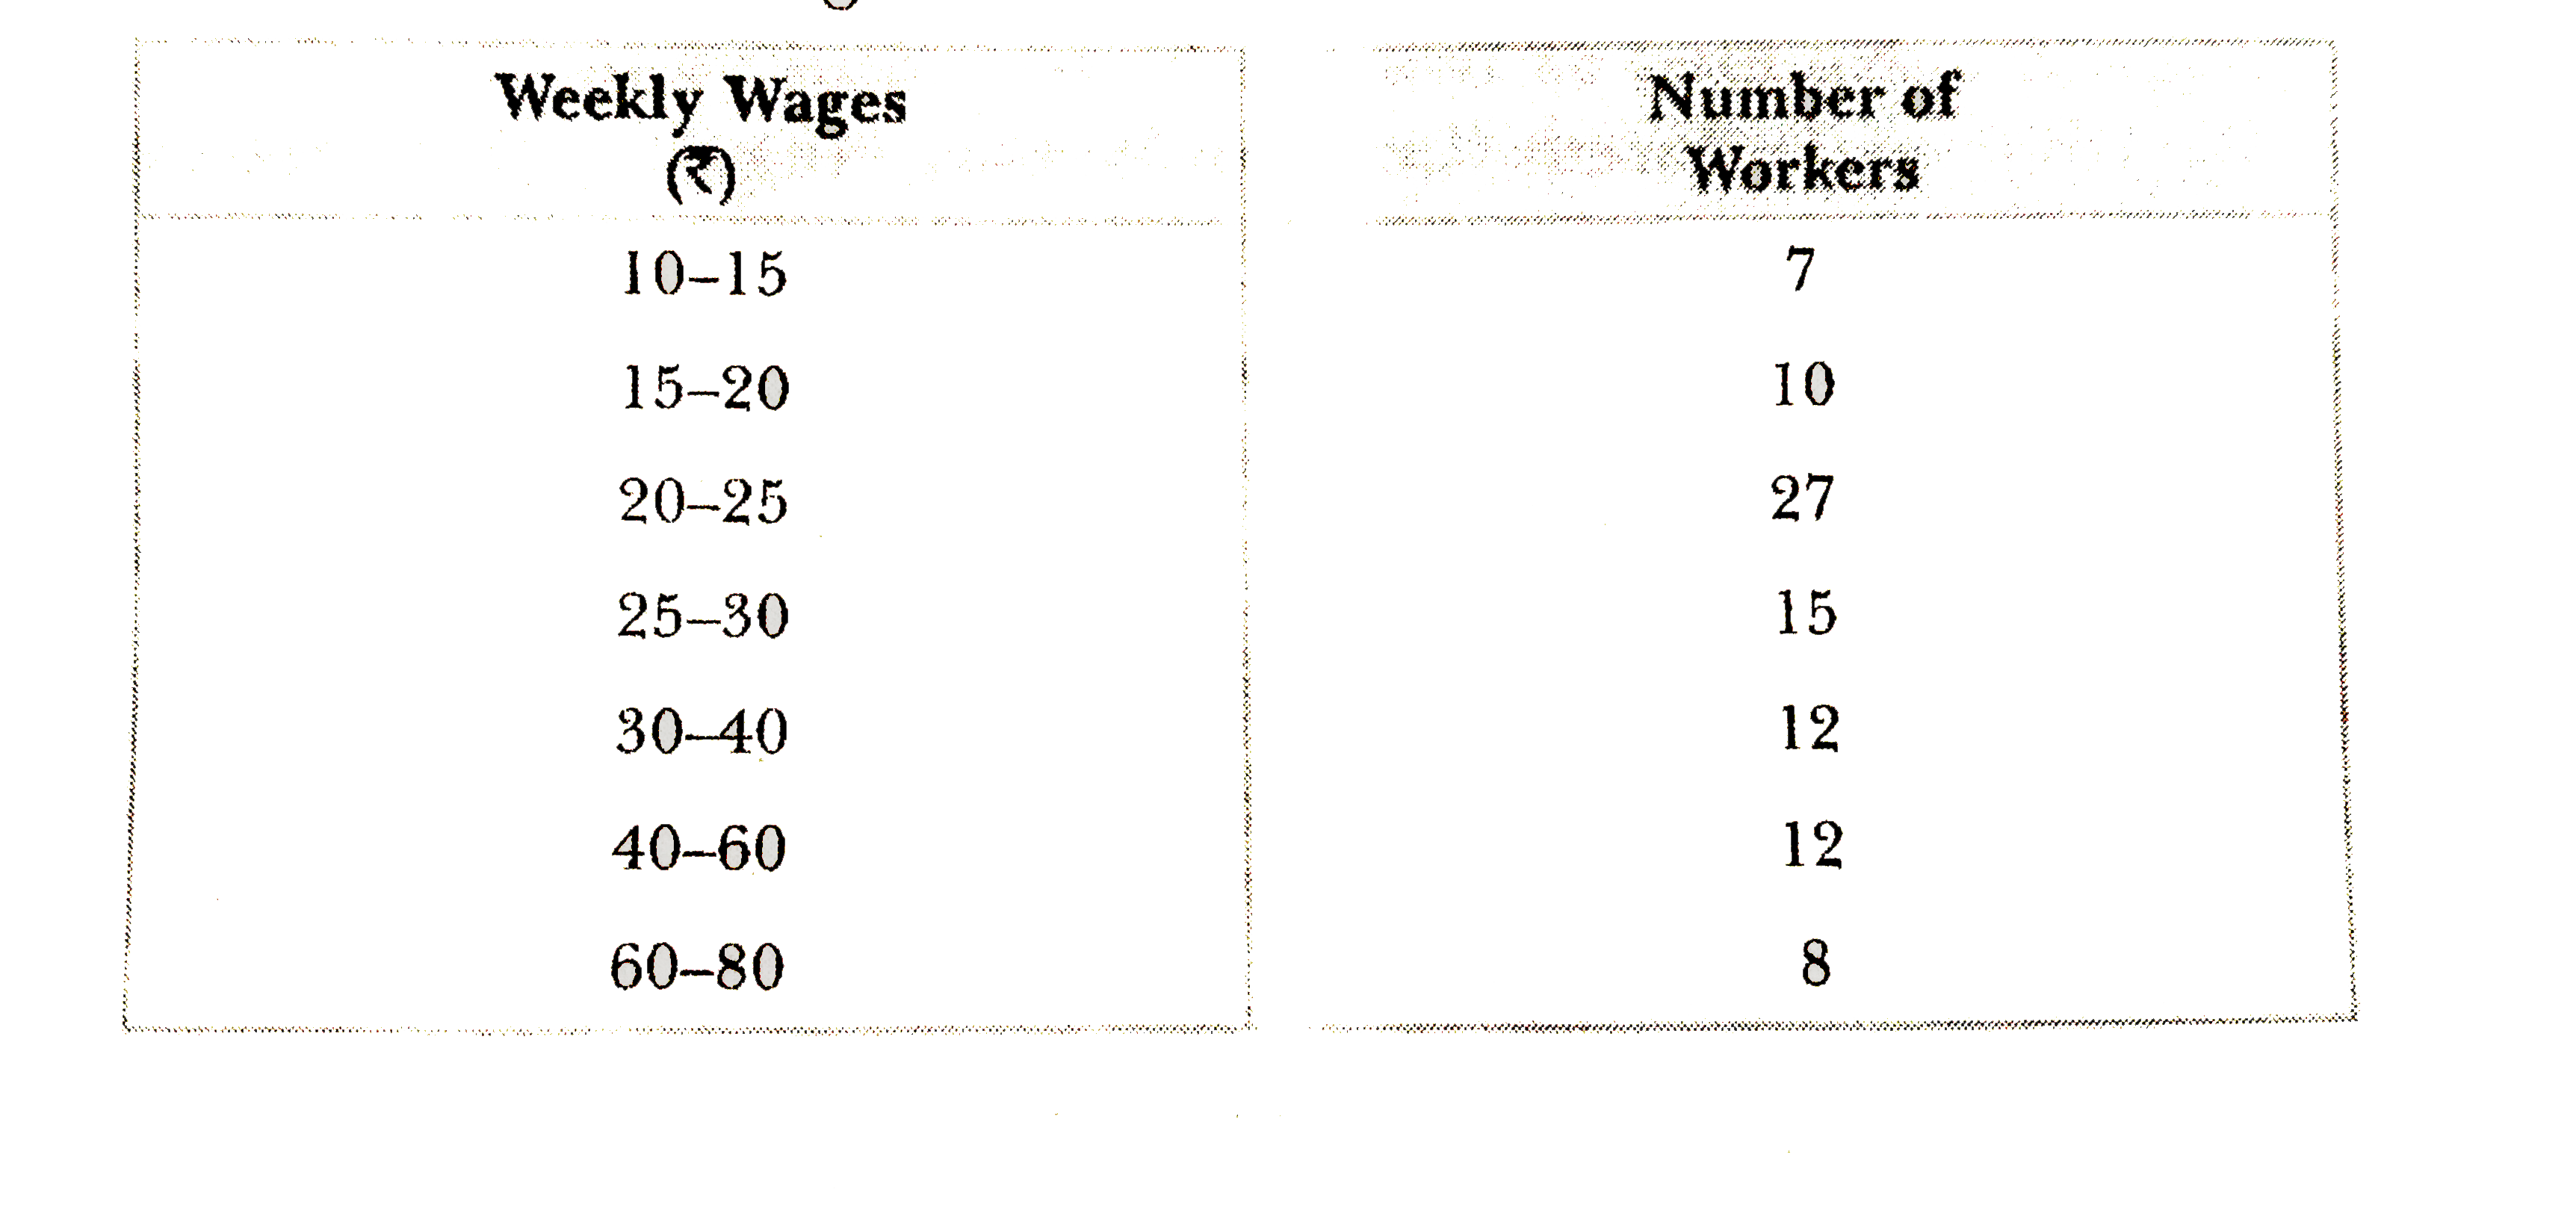
Present the following data in the form of a histogram :

View SolutionThe table below shows number of students of students of a college corresponding to different range of marks in Statistics. Present the information in the form of a histogram.

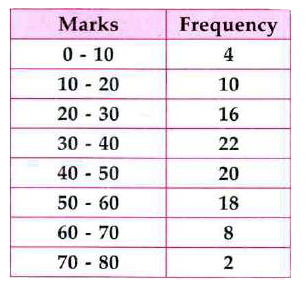
View SolutionThe following table gives the marks scored by 100 students in an entrance examination

Represent this data in the form of a histogram.
View SolutionPresent the data given in the table below in a histogram :

View SolutionElectricity used by some families is shown in the following table. Find the mode for use of electricity.

View SolutionThe following table shows the monthly expenditure of different families on different items :

Represent the data in the form of a sub-divided bar diagram.
View Solution


