The
following bar graph (Figure) represents the heights (in cm) of 50 students of
Class XI of a particular school. Study the graph and answer the following
questions:
What percentage of the total number of students have their
heights more than 149 cm?
How many
students in the class are in the range of maximum height of the class?
The school
wants to provide a particular type of tonic to each student below the height
of 150cm to improve his height. If the cost of the tonic for each student
comes out to be Rs. 55, how much amount of money is required?
How many
students are in the range of shortest height of the class?
State
whether true or false:
There are 9
students in the class whose heights are in the range of 155-159 cm.
Maximum
height (in cm) of a student in the class is 17.
There are
29 students in the class whose heights are in the range of 145-154 cm.
Minimum
height (in cm) of a student is the class is in the range of 140-144cms.
The number
of students in the class having their heights less than 150cm is 12.
There are 14
students each of whom has height more than 154 cm.
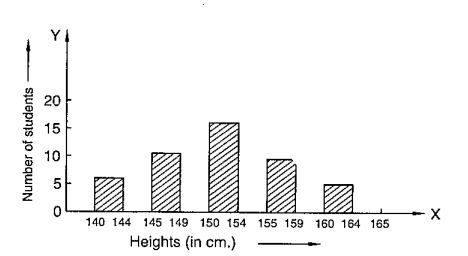
(i)The total number of students that have their height more than 149 cm=17+9+5=31
The % of students having height more than 149 cm =(3150)×100=62%
(ii) 5 students are in the maximum range of height of the class 160-164
(iii)Number of students below the height of 150cm=7+12=19, hence the total cost is 19×Rs.55=Rs.1045
(iv) 7 students are in the minimum range of height of the class 140-144
(v)a)There are 9 students in the class whose heights are in the range of 155-159 cm, thus the statement is true.
b)Maximum height of a student in the class is 164, hence the statement is false.
c)Number of students whose heights are in the range of 145-154 cm=12+17=29, hence the statement is true
d)Minimum height of a student is the class is in the range of 140-144cms,hence the statement is true
e)Number of students in the class having their heights less than 150cm =12+7=19,hence the statement is false.
Number of students whose height is more than 154 cm is 9+5=14, hence the statement is true
Topper's Solved these Questions
Similar Questions
The heights (in cm) of 50 students of a class are given below
Find the median height

View SolutionThe graph shows the result of 10th class students of a school for 4 years. Study the graph and answer the questions :
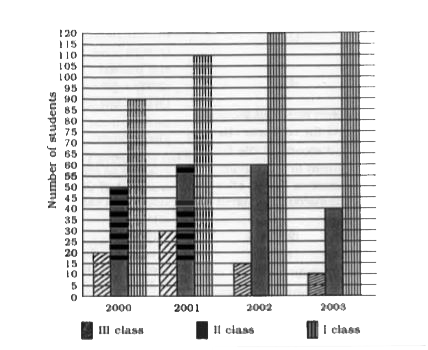
The year in which the maximum number of students appeared for the 10th class exam is
View Solution
Knowledge Check
In a class the girls are 60 % of the total number of students and the boys are 18 in number . How many students are there in the class ?
A35B25C45D55The following bar graph shows the number of students in a particular class of school. Then, answer the following questions.
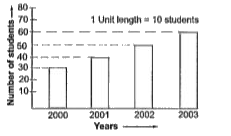
(i) What is the nuber of students in the year 2003 ?A70B60C50D40Following histogram depicts the range of heights of students in a class of 60 students. Study the same and answer the questions.
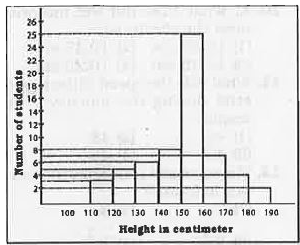
The number of students having their heights between 130 to 150 cms isA8B6C14D22
Study the given pie chart and answer the question that follows
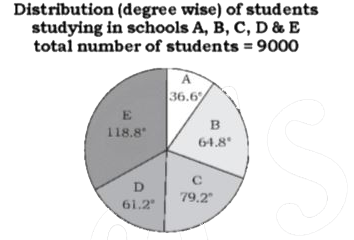
The total number of students in schools D and E is what percentage more than the number of students in schools B and C?
View SolutionFollowing histogram depicts the range of heights of students in a class of 60 students. Study the same and answer the questions.
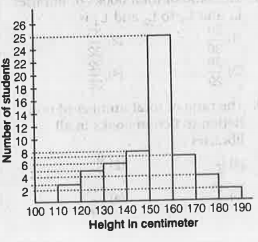
Which group contains maximum number of students ?
View SolutionStudy the following bar graph and answer the questions given below.
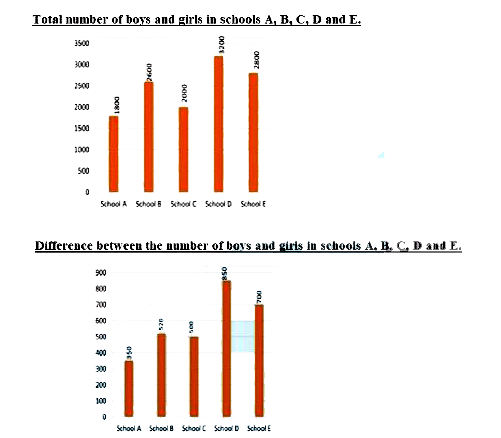
The number of boys in school B is what percentage of the total number of students in that school ?
View SolutionThe following bar graph shows the number of students in a particular class of school. Then, answer the following questions.
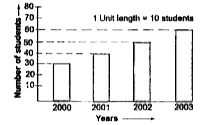
What is the number of students in the year 2003?
View SolutionThe following bar graph shows the number of students in a particular class of school. Then, answer the following questions.
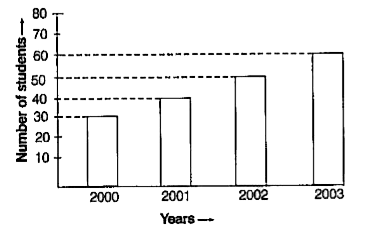
What is the number of students in the year 2003?
View Solution
