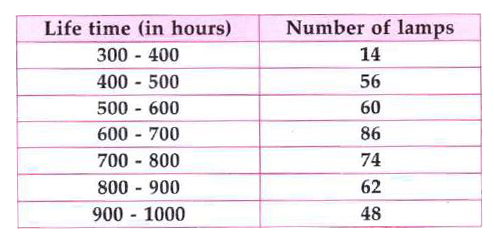
The following table gives the lifetimes of 400 neon lamps:

(i) Represent the given information with the help of a histogram.
(ii) How many lamps have a lifetime of more than 700 hours?
(ii) Number of lamps having a lifetime of more than 700 hours=(74+62+48)=184.
Topper's Solved these Questions
- BAR GRAPH, HISTOGRAM AND FREQUENCY POLYGONBOOK - RS AGGARWALCHAPTER - BAR GRAPH, HISTOGRAM AND FREQUENCY POLYGONEXERCISE - EXERCISE 17A
12 Videos
- AREAS OF TRIANGLES AND QUADRILATERALSBOOK - RS AGGARWALCHAPTER - AREAS OF TRIANGLES AND QUADRILATERALSEXERCISE - Multiple Choice Questions (Mcq)
16 Videos
- CIRCLES BOOK - RS AGGARWALCHAPTER - CIRCLES EXERCISE - MULTIPLE CHOICE QUESTION(MCQ)
37 Videos
Similar Questions
The following table gives the lifetimes of 400 neon lamps

(i) Represent the given information with the help of a histogram.
(ii) How many lamps have a lifetime of more 700 h?
View SolutionThe following table gives the life times of 400 neon lamps:
Represent the given information with the help of a histogram.
View Solution
Knowledge Check
Observe the histogram and answer the questions given below.
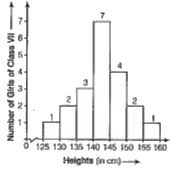
How many girls have a height of 145 cm and more?A6B7C5D2
The following table gives the life times of 400 neon lamps:(i) Represent the given information with the help of histogram.(ii) How many lamps have a life time of more than 700 hours?
View SolutionThe following table gives the life times of 400 neon lamps:
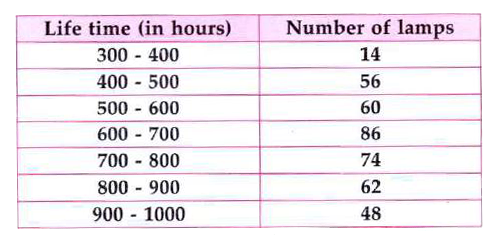
How many lamps have a life time of more than 700 hours?
View SolutionThe following table gives the distribution of the life time of 400 neon lamps Find the median life of a lamp.
View SolutionThe following pictograph depicts the information about the areas in sq km (to nearest hundred) of some districts of Chhattisgarh State:
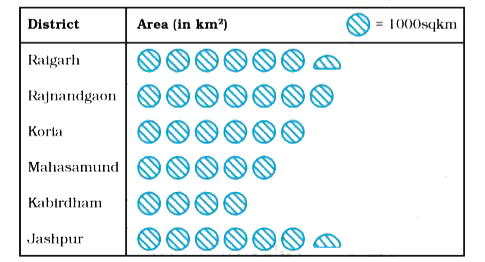
How many districts have area more than 5000 square kilometres?
View SolutionLook at the histogram given below answer the question that follow:
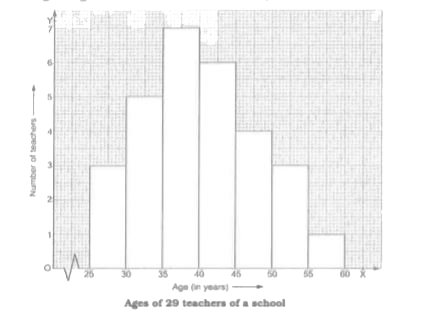
(i) What information in being given by the histogram?
(ii) How many teachers are of age less than 45 years?
(iii) How many teachers are of age 40 years or more but less than 55 years?
View SolutionThe number of hours for which students of a particular class watched television during holidays is shown through the given graph.Answer the following.(i) For how many hours did the maximum number of students watch TV?(ii) How many students watched TV for less than 4 hours?(iii) How many students spent more than 5 hours in watching TV?
View SolutionFollowing histogram depicts the range of heights of students in a class of 60 students. Study the same and answer the questions.
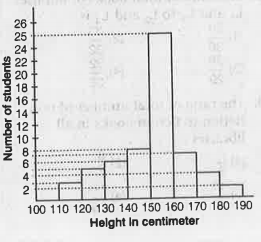
How many students have their heights more than 150 cm ?
View Solution
