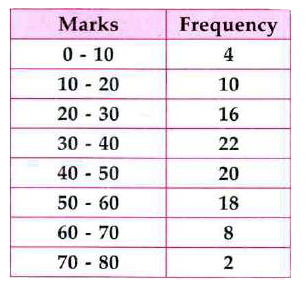
The following table gives the marks scored by 100 students in an entrance examination

Represent this data in the form of a histogram.
The correct Answer is:(##MTGFOUCOUMATIXC14SLV030_A01##)
Step by step video, text & image solution for The following table gives the marks scored by 100 students in an entrance examination Represent this data in the form of a histogram. by Maths experts to help you in doubts & scoring excellent marks in Class 9 exams.
Updated on:21/07/2023Topper's Solved these Questions
- STATISTICSBook:MTG IIT JEE FOUNDATIONChapter:STATISTICSExercise:NCERT SECTION (Exercise 14.1)
Explore 2 Videos
- STATISTICSBook:MTG IIT JEE FOUNDATIONChapter:STATISTICSExercise:NCERT SECTION (Exercise 14.2)
Explore 15 Videos
- STATISTICSBook:MTG IIT JEE FOUNDATIONChapter:STATISTICSExercise:Olympiad/HOTS Corner
Explore 20 Videos
- QUADRILATERALS Book:MTG IIT JEE FOUNDATIONChapter:QUADRILATERALS Exercise:Olympiad/HOTS CORNER
Explore 15 Videos
- TRIANGLESBook:MTG IIT JEE FOUNDATIONChapter:TRIANGLESExercise:OLYMPAID/ HOTS CORNER
Explore 10 Videos
Similar Questions
Present the following data in the form of a histogram :

View SolutionPresent the following data in the form of a histogram :

View SolutionFollowing data gives the marks obtained by 100 students in a test. Find the median

View SolutionRepresent the following data using a histogram.

View SolutionThe following table gives the marks scored by 100 students in an entrance examination.

View SolutionThe following distribution table shows the marks scored by 140 students in an examination :

Calculate the mode of the distribution.
View SolutionThe following table represent marks obtained by 100 students in a test.

Find mean marks of the students.
View SolutionThe following table shows the marks secored by a student in annual examination in various subjects. Draw a histogram to represent the given data.
SubjectTeluguHindiEnglishMathsScienceSocial StudiesMarks807482949088
View SolutionThe marks obtained by a student in an examination are given below :

Represent the data using a pie diagram.
View SolutionThe marks obtained by a student in an examination are given below:

Represent the data using pie diagram
View Solution
