The table shows the data collected for Dhruv’s walking on a road.

(a) Plot a line graph for the given data using a suitable scale.
(b) In what time periods did Dhruv make the most progress?
Step by step video & image solution for The table shows the data collected for Dhruv’s walking on a road. (a) Plot a line graph for the given data using a suitable scale. (b) In what time periods did Dhruv make the most progress? by Maths experts to help you in doubts & scoring excellent marks in Class 8 exams.
Updated on:21/07/2023Topper's Solved these Questions
- INTRODUCTION TO GRAPHS BOOK - NCERT EXEMPLARCHAPTER - INTRODUCTION TO GRAPHS EXERCISE - THINK AND DISCUSS
4 Videos
- EXPONENTS AND POWERSBOOK - NCERT EXEMPLARCHAPTER - EXPONENTS AND POWERSEXERCISE - EXERCISE
195 Videos
- LINEAR EQUATIONS IN ONE VARIABLEBOOK - NCERT EXEMPLARCHAPTER - LINEAR EQUATIONS IN ONE VARIABLEEXERCISE - THINK AND DISCUSS
3 Videos
Similar Questions
The given table shows the quantity of petrol and its cost.

Plot a graph to show the data.
View SolutionThe following table shows the average intake of nutrients in calories by rural and urban groups in a particular year. Using a suitable scale for the given data, draw a double bar graph to compare the data.
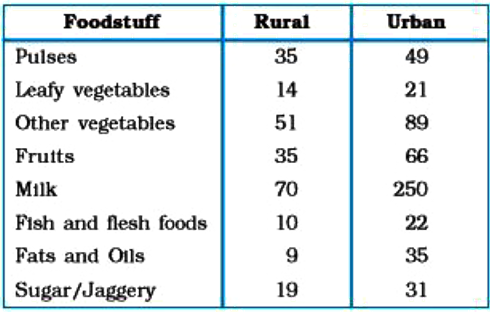
View SolutionDraw the line graph using suitable scale to show the annual gross profit of a company for a period of five years.

View SolutionThe table below gives the data of tourists visiting 5 hill stations over two consecutive years. Study the table and answer the questions that follow:

(a) Draw a double bar graph to depict the above information using appropriate scale.
(b) Which hill station was visited by the maximum number of tourists in 2008?
(c) Which hill station was visited by the least number of tourists in 2009?
(d) In which hill stations was there increase in number of tourists in the year 2009?
View SolutionThe line graph shows the production of product A and B (in thousands) during the period 2004 to 2009 and the second line Graph shows the percentage sale of these products.
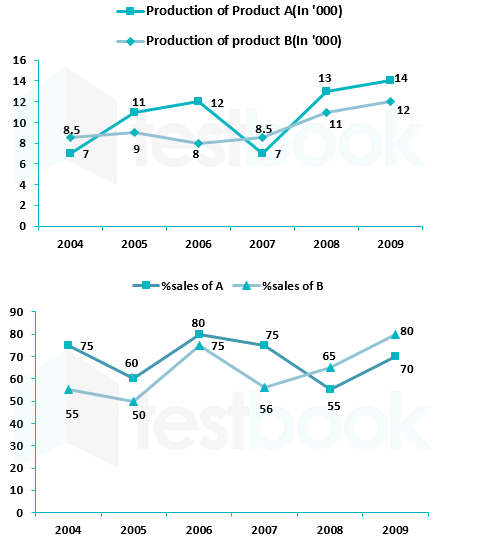
In the given line graph, what is the total sale of Products A and B in the year 2007?
View SolutionThe line graph shows the production of product A and B during the period 2004 to 2009 and the second line graph shows the percentage sale of these products
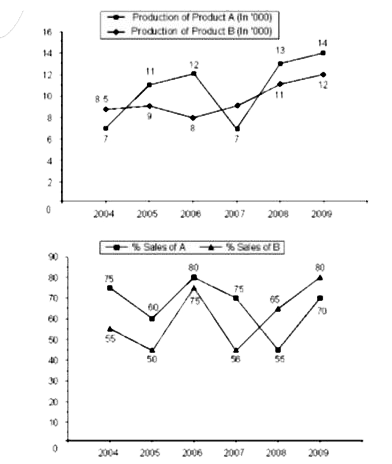
In the given line graph, what is the total sale of products A and B in the year 2007
View SolutionThe line graph shows the production of product A and B (in thousands) during the period 2004 to 2009 and the second line Graph shows the percentage sale of these products.

In the given line graph, what is the total sale of Product B in the year 2004 and 2008 together?
View SolutionThe line graph shows the production of product A and B (in thousands) during the period 2004 to 2009 and the second line Graph shows the percentage sale of these products.

In the given line graph. what is the total sale of Product A in the year 2005 and 2009 taken together?
View SolutionThe line graph shows the production of product A and B during the period 2004 to 2009 and the second line graph shows the percentage sale of these products
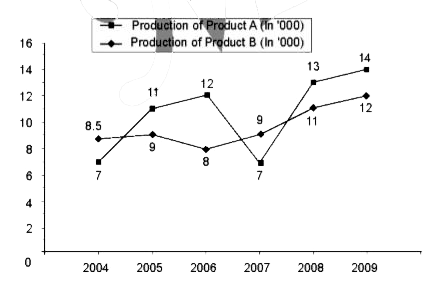 br>
br> 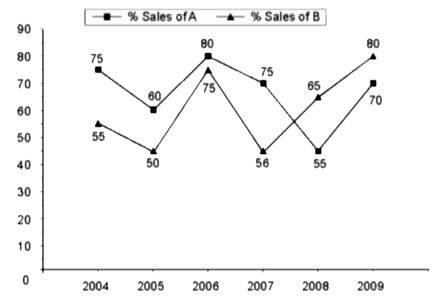
In the given line graph, what is the total sale of products A in the year 2005 and 2009 taken together?
View SolutionThe following table gives the growth chart of a child.

Draw a line graph for the table and answer the questions that follow.
(a) What is the height at the age of 5 years?
(b) How much taller was the child at the age of 10 than at the age of 6 ?
(c) Between which two consecutive periods did the child grow more faster ?
View Solution
