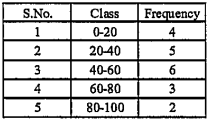
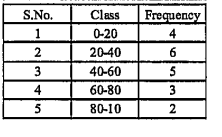
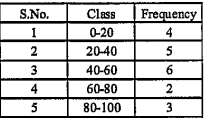
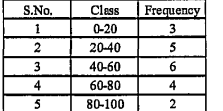
The time taken, in seconds, to solve a problem by each of 25 pupils is as follows: 16,20,26,27,28,30,33,37,38,40,42,43,46,46,46,48,49,50,53,58,59,60,64,52,20 Construct a frequency distribution for these data, using a class interval of 10 seconds. Draw a histogram to represent the frequency distribution.
(i)frequency distribution

(ii)histogram

Topper's Solved these Questions
Similar Questions
Time taken is seconds by 25 students in an examination to solve certain question is given below.
20,16,20,27,28,30,33,57,50,40,42,46,28,43,46,46,48,49,52,58,59,60,64,52.
By taking class interval of size 10, make a frequency distribution table.
View SolutionWe are given the following marks secured by 25 students in an examination .
23,28,30,32,35,36,36,40,41,43,44,44,45,48,49,52,53,54,56,56,58,61,62,65,68.
(i)Arrange this data in the form of a frequency distribution taking the following class intervals.
20-29,30-39,40-49,50-59, and 60-69
(ii) Draw the frequency polygon and ogive for the above data.
View Solution
Knowledge Check
20 students of a class obtained following respective marks out of 100 marks in subject Mathematics:54,46,24,36,84,70,16,58,6,82,44,54.32,64.8,66,52,28,16 and 30 Grouped frequency distribution table of above will be
A B
B C
C D
D
The weights (in kg) of 30 students of a class are
39,43,32,37,29,26,31,45, 46,31,37,38,30,39,36,41,35,34,41,46,39,38,36,38,40,42,33,43,44,33.
Prepare a frequency distribution table using one class interval as 30-35 in which 30 is included and 35 excluded. using the above data, draw a histogram.
View SolutionThe weights (in kg) of 35 persons are given below :43,51,47,62,48,40,50,62,53,56,40,48,56,53,50,42,55,52,48,46,45,54,52,50,47,44,54,55,60,63,58,55,60,58,53. Prepare a frequency distribution table taking equal class size. One such class is 40 - 45 (where 45 is not included).
View SolutionFind the mean deviation from the mean for the following data :
(i)13,15,16,15,18,15,14,18,17,10
(ii)38,70,48,40,42,55,63,46,54,44
(iii)37,48,50,23,47,58,29,27,31,40
View SolutionA company manufactures car batteries of a particular type. The lives (in years) of 40 such batteries were recorded as follows: 2.6 3.0 3.7 3.2 2.2 4.1 3.5 4.53.5 2.3 3.2 3.4 3.8 3.2 4.6 3.72.5 4.4 3.4 3.3 2.9 3.0 4.3 2.83.5 3.2 3.9 3.2 3.2 3.1 3.7 3.44.6 3.8 3.2 2.6 3.5 4.2 2.9 3.6 Construct a grouped frequency distribution table for this data, using class intervals of size 0.5 starting from the interval 2 - 2.5.
View SolutionThe number of books in different shelves of a library are as follows: 30,32,28,24,20,25,38,37,40,45,16,20 19,24,27,30,32,34,35,42,27,28,19,34 38,39,42,29,24,27,22,29,31,19,27,25 28,23,24,32,34,18,27,25,37,31,24,23 43,32,28,31,24,23,26,36,32,29,28,21 Prepare a cumulative frequency distribution table using 45-49 as the last class-interval.
View SolutionConstruct a histogram for the frequency distribution below:
Class Interval10−2020−3030−4040−5050−60Frequency63847
View SolutionGiven below are the ages of 40 people in a colony:
33872830256502444563227211762581614192431275124615426734421104020504863921
Taking class intervals 1-10, 11-20, 21-30, 31-40, 41-50, 51-60 and 61-70, we construct a frequency distribution table for th above data.
View Solution
