All Questions from RD SHARMA MATHS (HINGLISH) Chapter 251:DATA HANDLING-III (PIE CHARTS OR CIRCLE GRAPHS) for Class 8
| Class 8 | MATHS |
| Chapter | DATA HANDLING-III (PIE CHARTS OR CIRCLE GRAPHS) |
| RD SHARMA MATHS (HINGLISH) | All Questions |
| Medium | English |
| Academic Year | 2023-2024 |
Question 2
In the month of July 2004, a house holder spent his monthly salary amounting to Rs. 7200 on different items as given below: Items, Clothing, Food, House Rent, Education, Misc. Amount spent (in Rs.), 600, 4000, 1200, 400, 1000 Represent the information in the form of a pie-chart.View SolutionQuestion 26
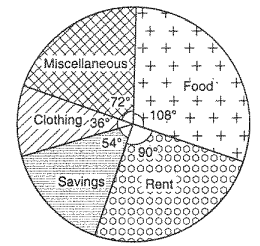
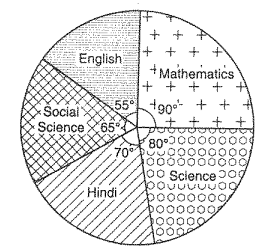
The following pie-chart shows the monthly expenditure of a family on food, clothing, rent, miscellaneous expenses and savings. If the family spends Rs. 825 on clothing, answer the following questions: What is the total monthly income of the family? What percent of the total income does the family save?
 View Solution

 .
.