Read the
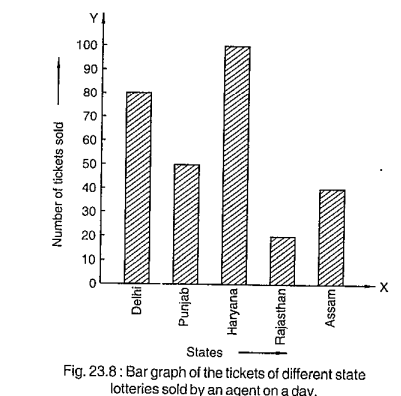
bar graph shown in Figure and answer the following questions:
What is the
information given by the bar graph?
How many
tickets of Assam State Lottery were sold by the agent?
Of which
state, were the maximum number of tickets sold?
State
whether true or false.
The maximum
number of tickets sold is three times the minimum number of tickets sold.
Of which
state were the minimum number of tickets sold?

(i)The following Bar graph gives information on number tickets sold by an agent on a day
(ii)40 tickets of Assam State Lottery were sold by the agent
(iii)the maximum number of tickets sold of Haryana
(iv)Maximum number of tickets sold=100
Minimum number of tickets sold=20
∴100=5×20
The given statement is false
Topper's Solved these Questions
Similar Questions
Read the bar graph given in Figure and answer the following questions: What information is given by the bar graph? In which years the areas under the sugarcane crop were the maximum and the minimum? State whether true or false: The area under the sugarcane crop in the year 1982-83 is three times that of the year 1950-51
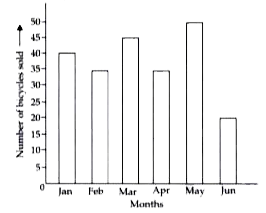
View SolutionLook at the bar graph and answer the following questions.

In which month 40 bicycles were sold?
View Solution
Knowledge Check
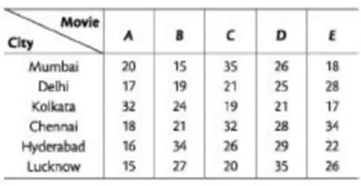
The number of tickets of movie E sold in Chennai is what per cent of number of tickets of movies A sold in Mumbai?
A170B70C30D130In which city was the total number of tickets of all the five movies together sold the minimum?
 ADelhiBChennaiCLucknowDKolkata
What is the difference between the number of tickets of movie D sold in Kolkata and the number of tickets of movie B sold in Lucknow?
A700B6000C14000D9000
Read the following bar graph and answer the following questions: What information is given by the bar graph? Which state is the largest producer of rice? Which state is the largest producer of wheat? Which state has total production of rice and wheat as its maximum? Which state has the total production of wheat and rice minimum?
View SolutionRead the following bar graph and answer the following questions: What information is given by the bar graph? Which state is the largest producer of rice? Which state is the largest producer of wheat? Which state has total production of rice and wheat as its maximum? Which state has the total production of wheat and rice minimum?
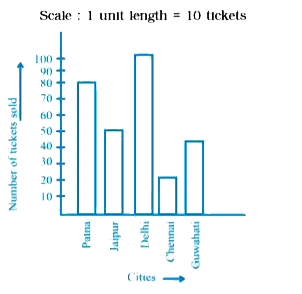
View SolutionThe following graph gives the information about the number of railway tickets sold for different cities on a railway ticket counter between 6.00 am to 10.00 am. Read the bar graph and answer the following questions.

For which city were the maximum number of tickets sold?
View SolutionThe mean number of tickets sold daily by a theater over a seven - day period was 52. The theater sold 46 tickets on the last day of that period. What was the mean number of tickets sold daily over the first six days ?
View SolutionWhat is the average number of tickets of movie C sold in all the six cities?
View Solution
