For a fixed amount of an ideal gas P us T plot is given as shown. Identify the correct option.
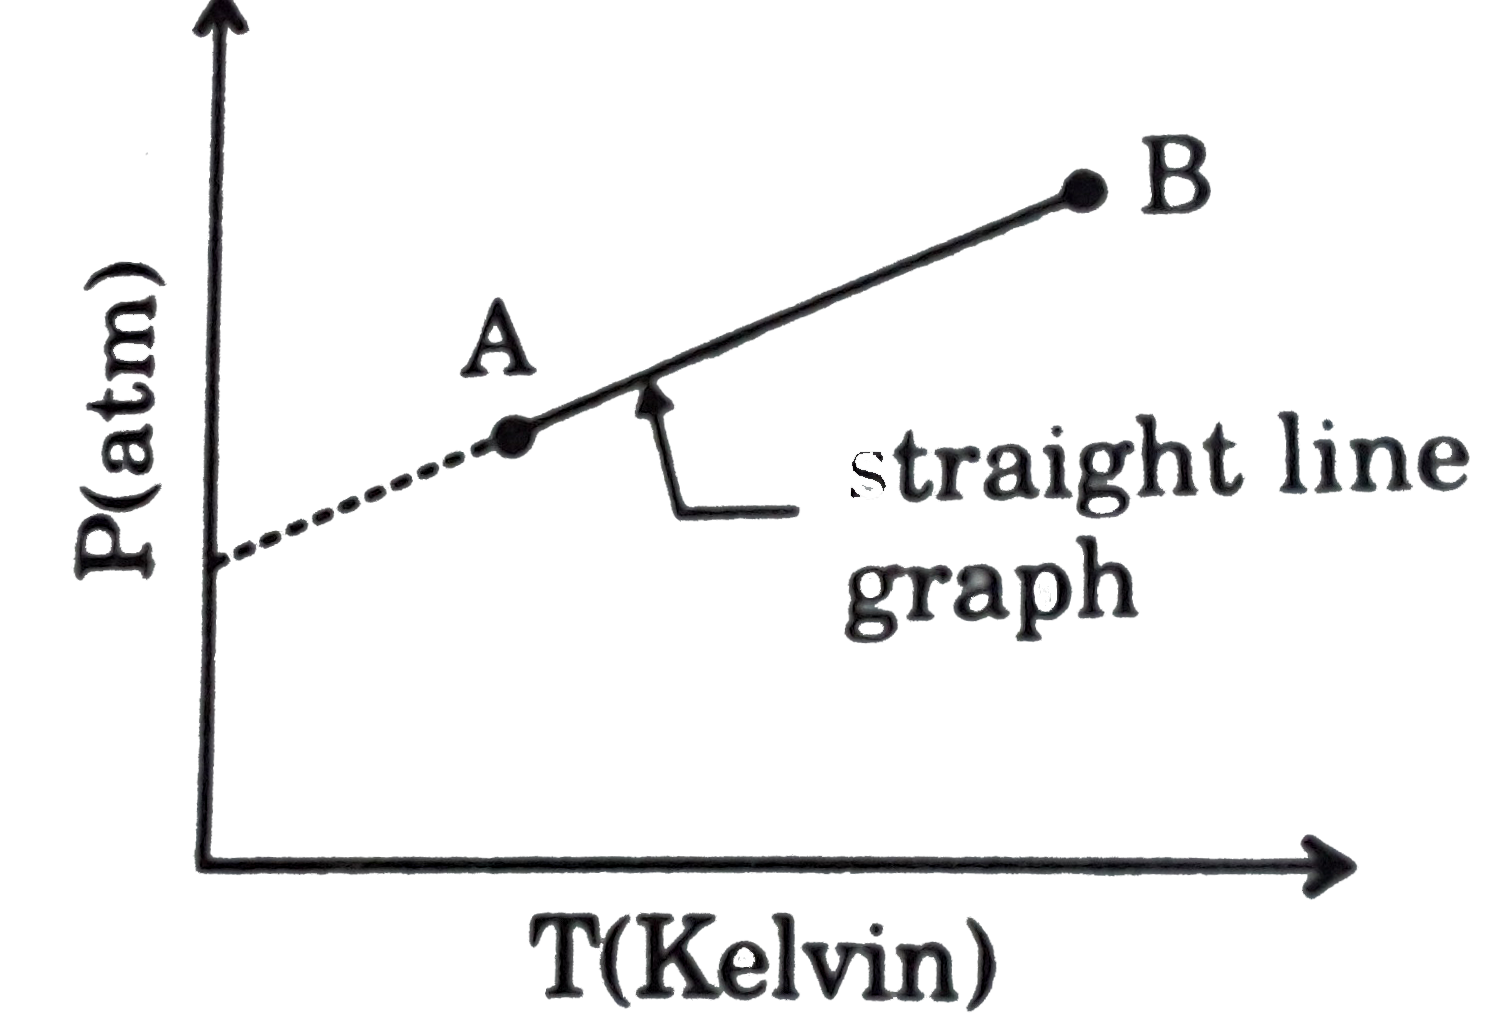
The change from A to B should be isochoric
Volume first increases reached maxima and then decreases
PV=nRT is not applicable
None of the statements are correct
The correct Answer is:D
Topper's Solved these Questions
- GRAPHICAL INTERPRETATIONBOOK - GRB PUBLICATIONCHAPTER - GRAPHICAL INTERPRETATIONEXERCISE - C. Atomic Sturcture
1 Videos
- GRAPHICAL INTERPRETATIONBOOK - GRB PUBLICATIONCHAPTER - GRAPHICAL INTERPRETATIONEXERCISE - Atomic Sturcture
9 Videos
- GRAPHICAL INTERPRETATIONBOOK - GRB PUBLICATIONCHAPTER - GRAPHICAL INTERPRETATIONEXERCISE - B. Gaseous State
1 Videos
- F-BLOCK ELEMENTSBOOK - GRB PUBLICATIONCHAPTER - F-BLOCK ELEMENTSEXERCISE - Subjective type
7 Videos
- HYDROCARBON (ALIPHATIC)BOOK - GRB PUBLICATIONCHAPTER - HYDROCARBON (ALIPHATIC)EXERCISE - Previous years jee questions
28 Videos
Similar Questions
The slope of 'P' v/s T plot at constant volume for a fixed amount of an ideal gas aus 0.01atm/K. Then what will be the value of pressure of gas (In atm) at 300K temperature ?
View SolutionThe slope of 'P' v/s T plot at constant volume for a fixed amount of an ideal gas aus 0.01atm/K. Then what will be the value of pressure of gas (In atm) at 300K temperature ?
View Solution
Knowledge Check
For fixed amount of an ideal gas identify the incorrect graph :
A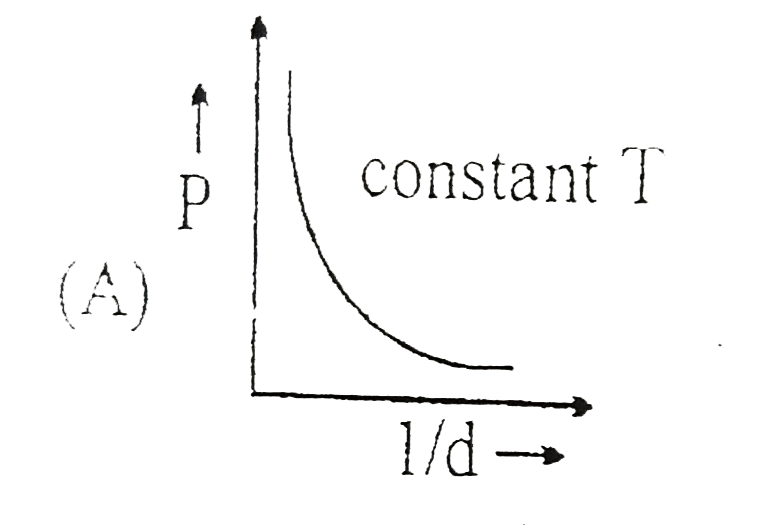 B
B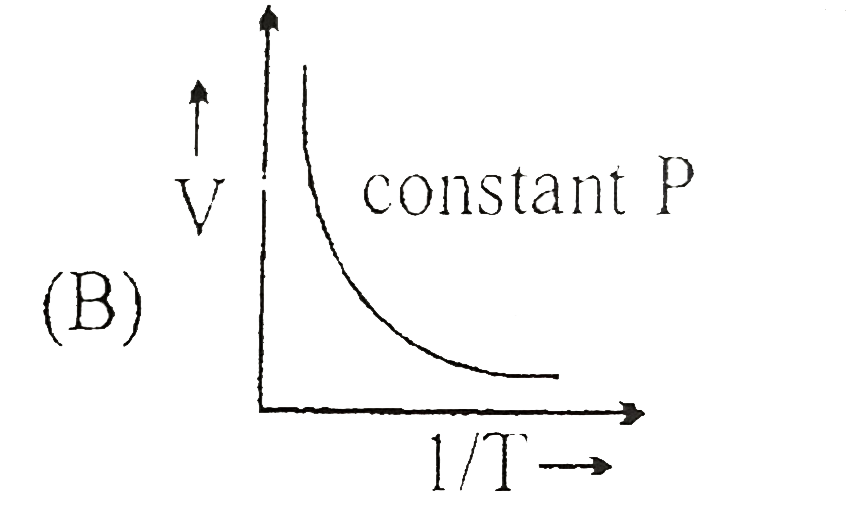 C
C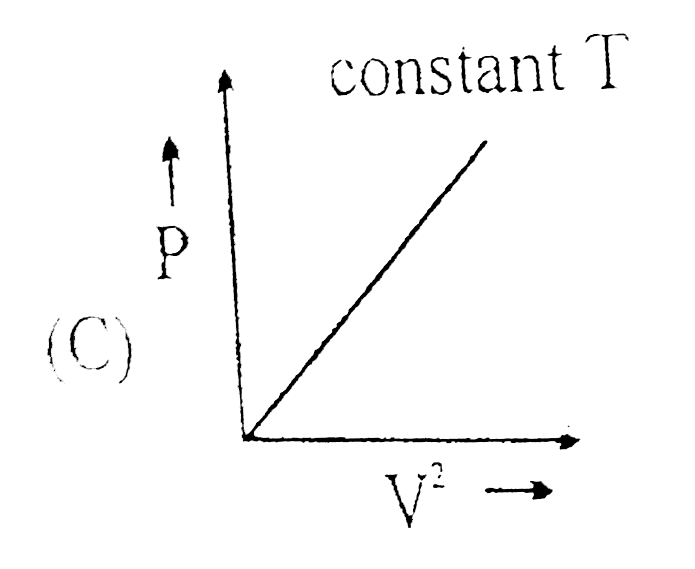 D
D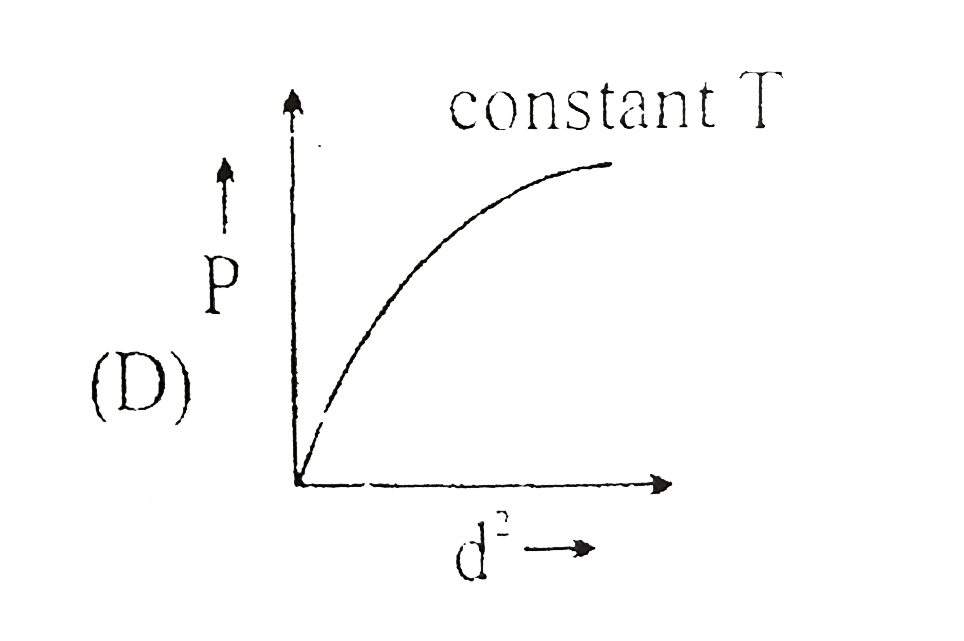
For same mass of two different ideal gases of molecular weights M1andM2 plots of log V vs log P at a given constant temperature are shown. Identify the correct option.
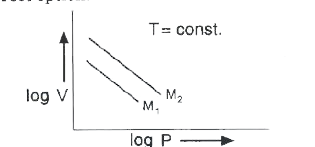 AM1>M2BM1=M2CM1<M2DCan be predicted only if temperature is known
For a fixed mass of an ideal gas the correct representation is:
A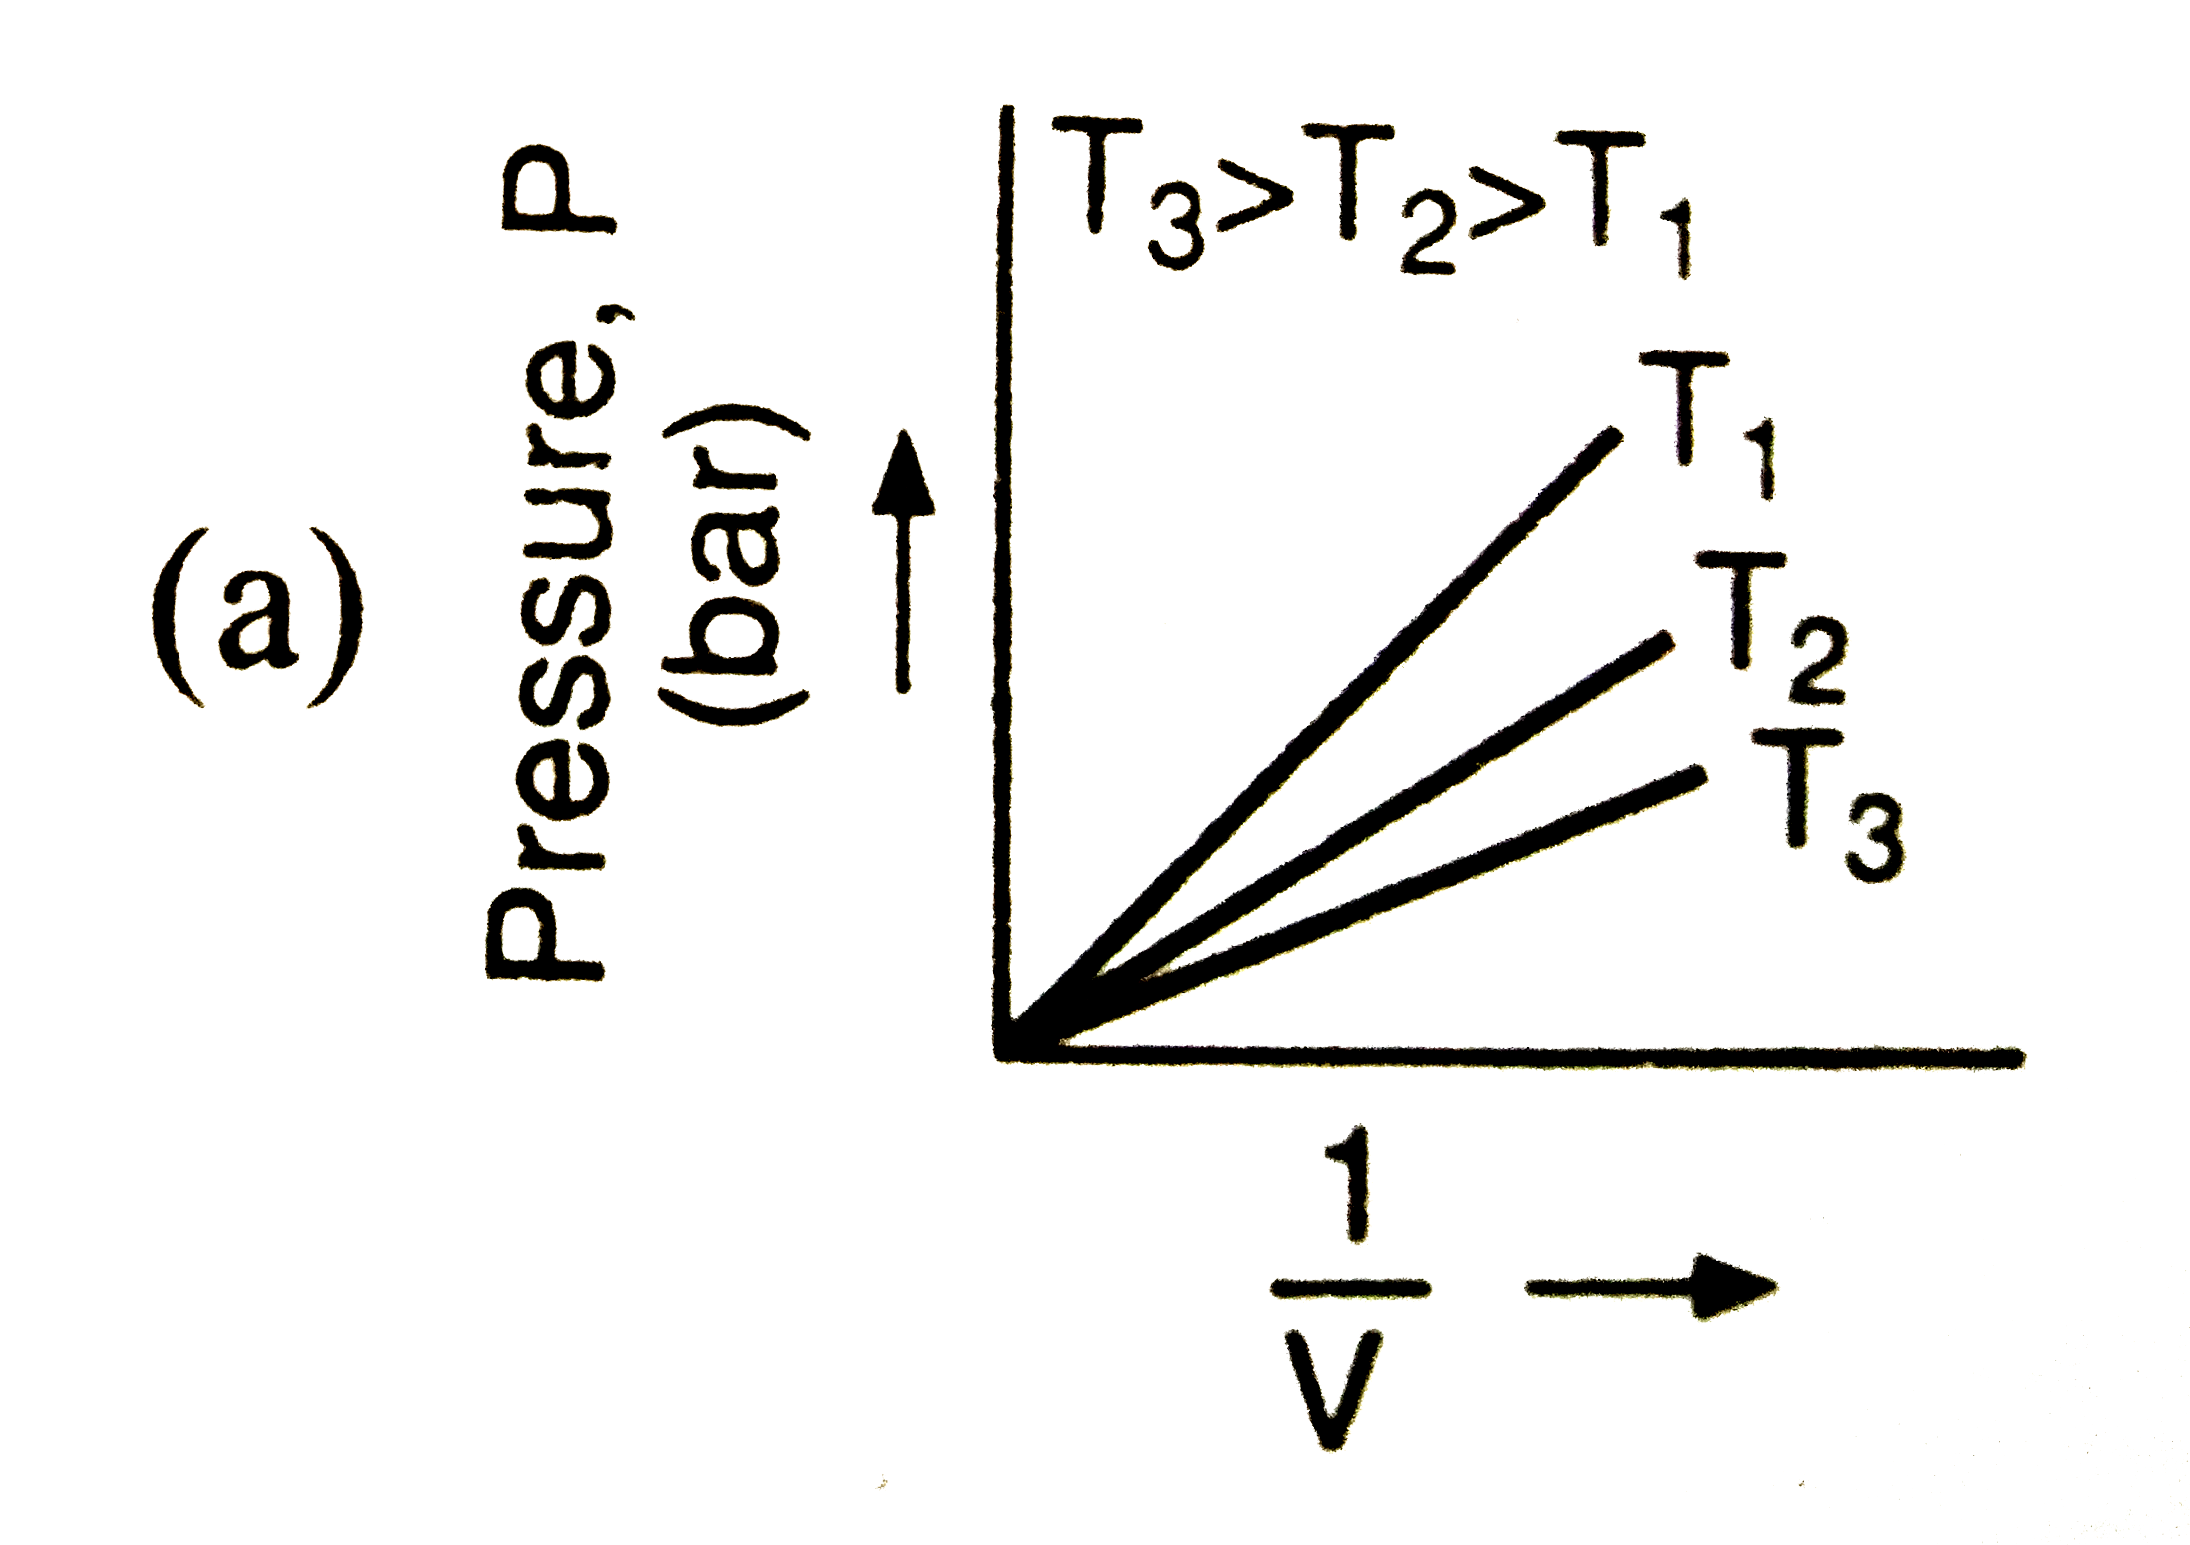 B
B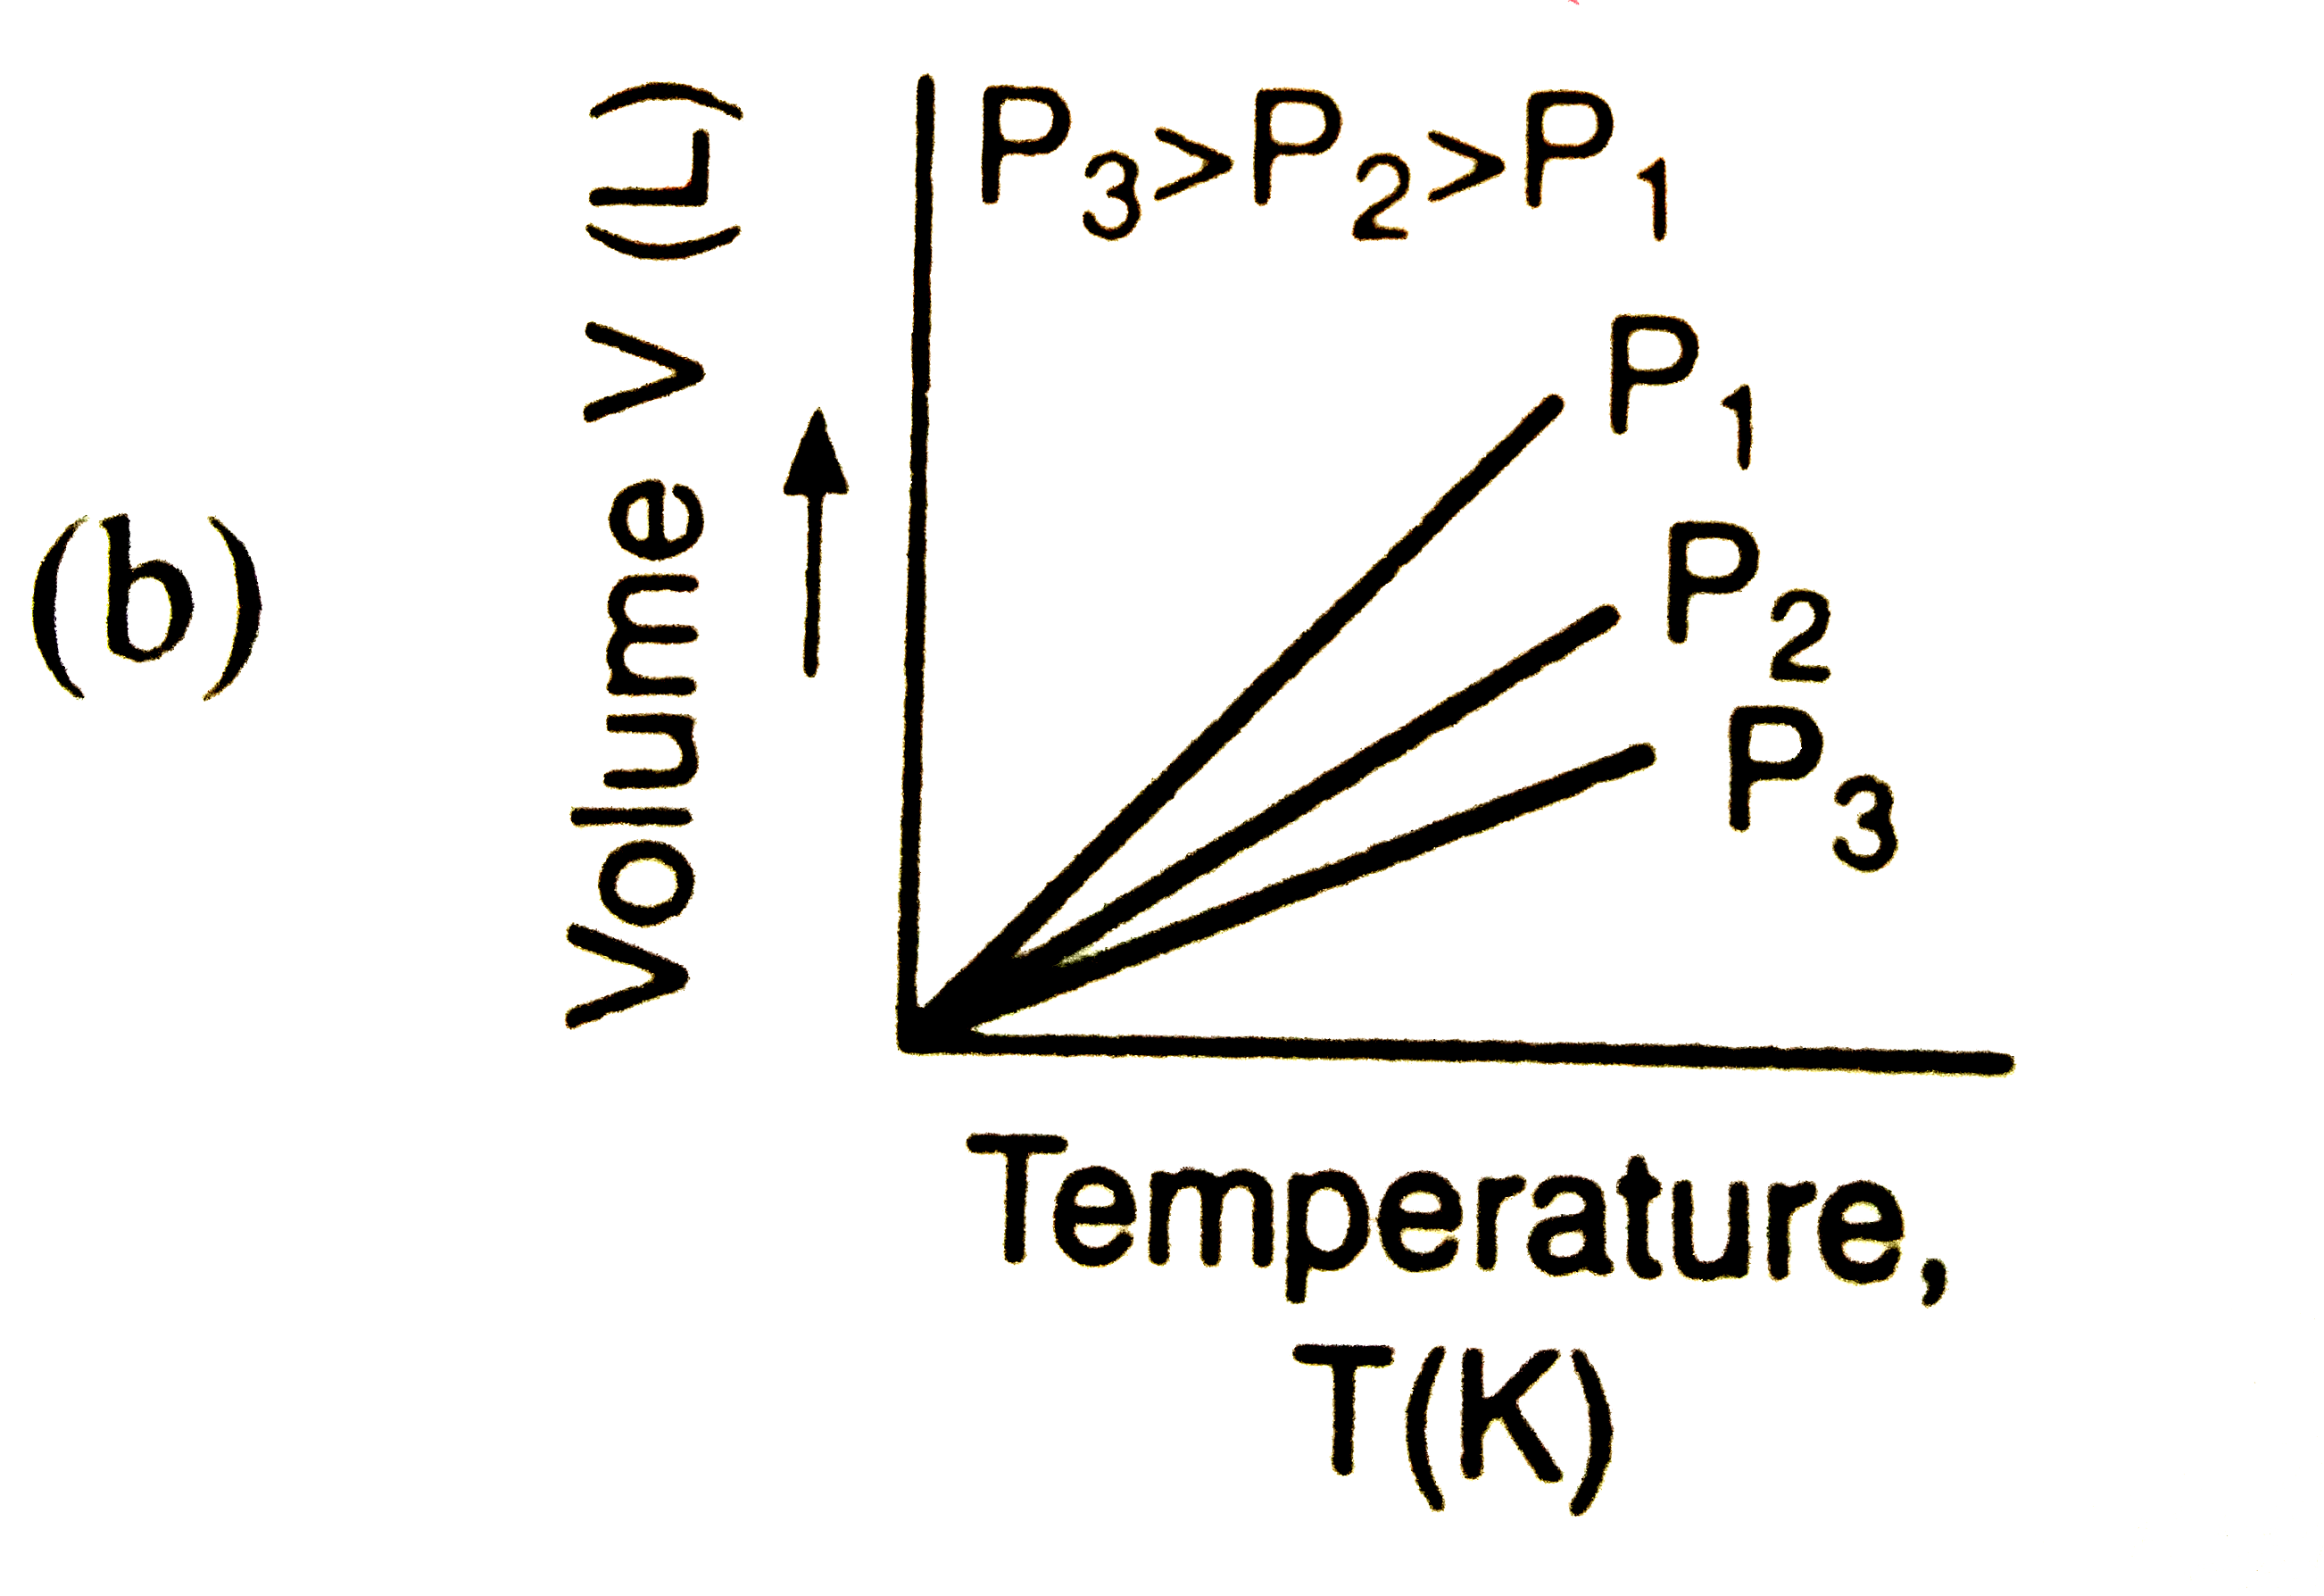 C
C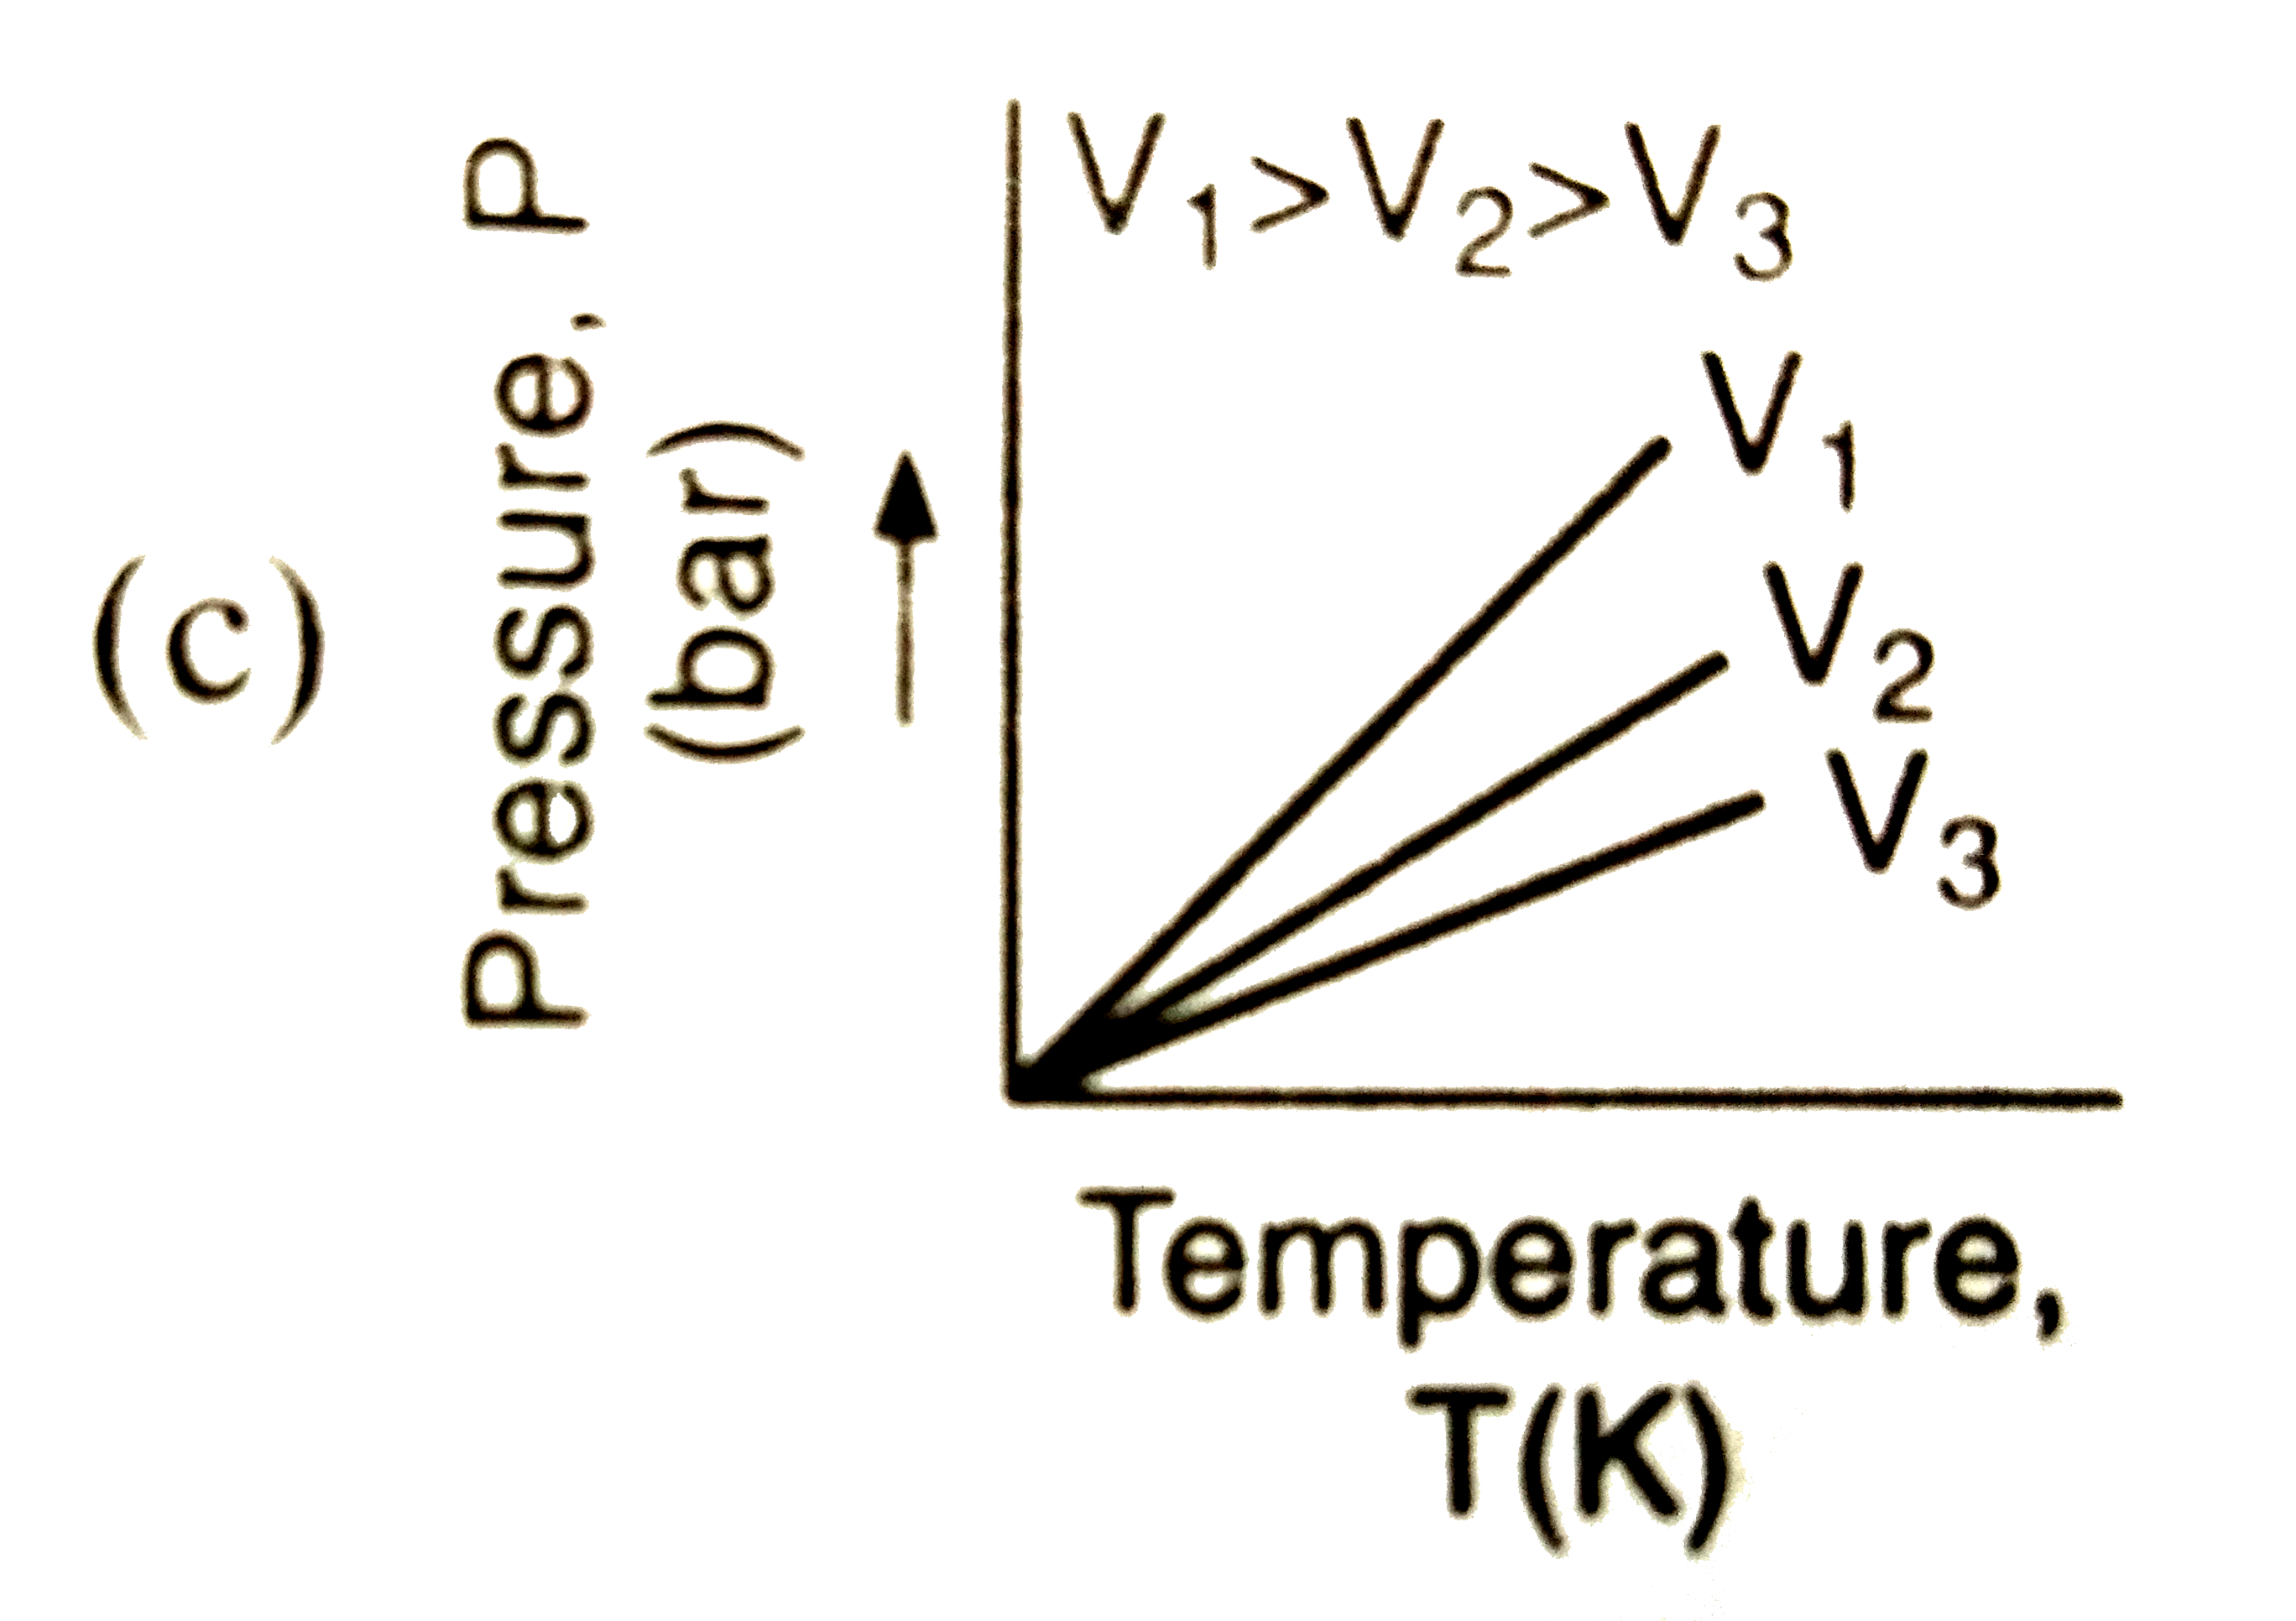 D
D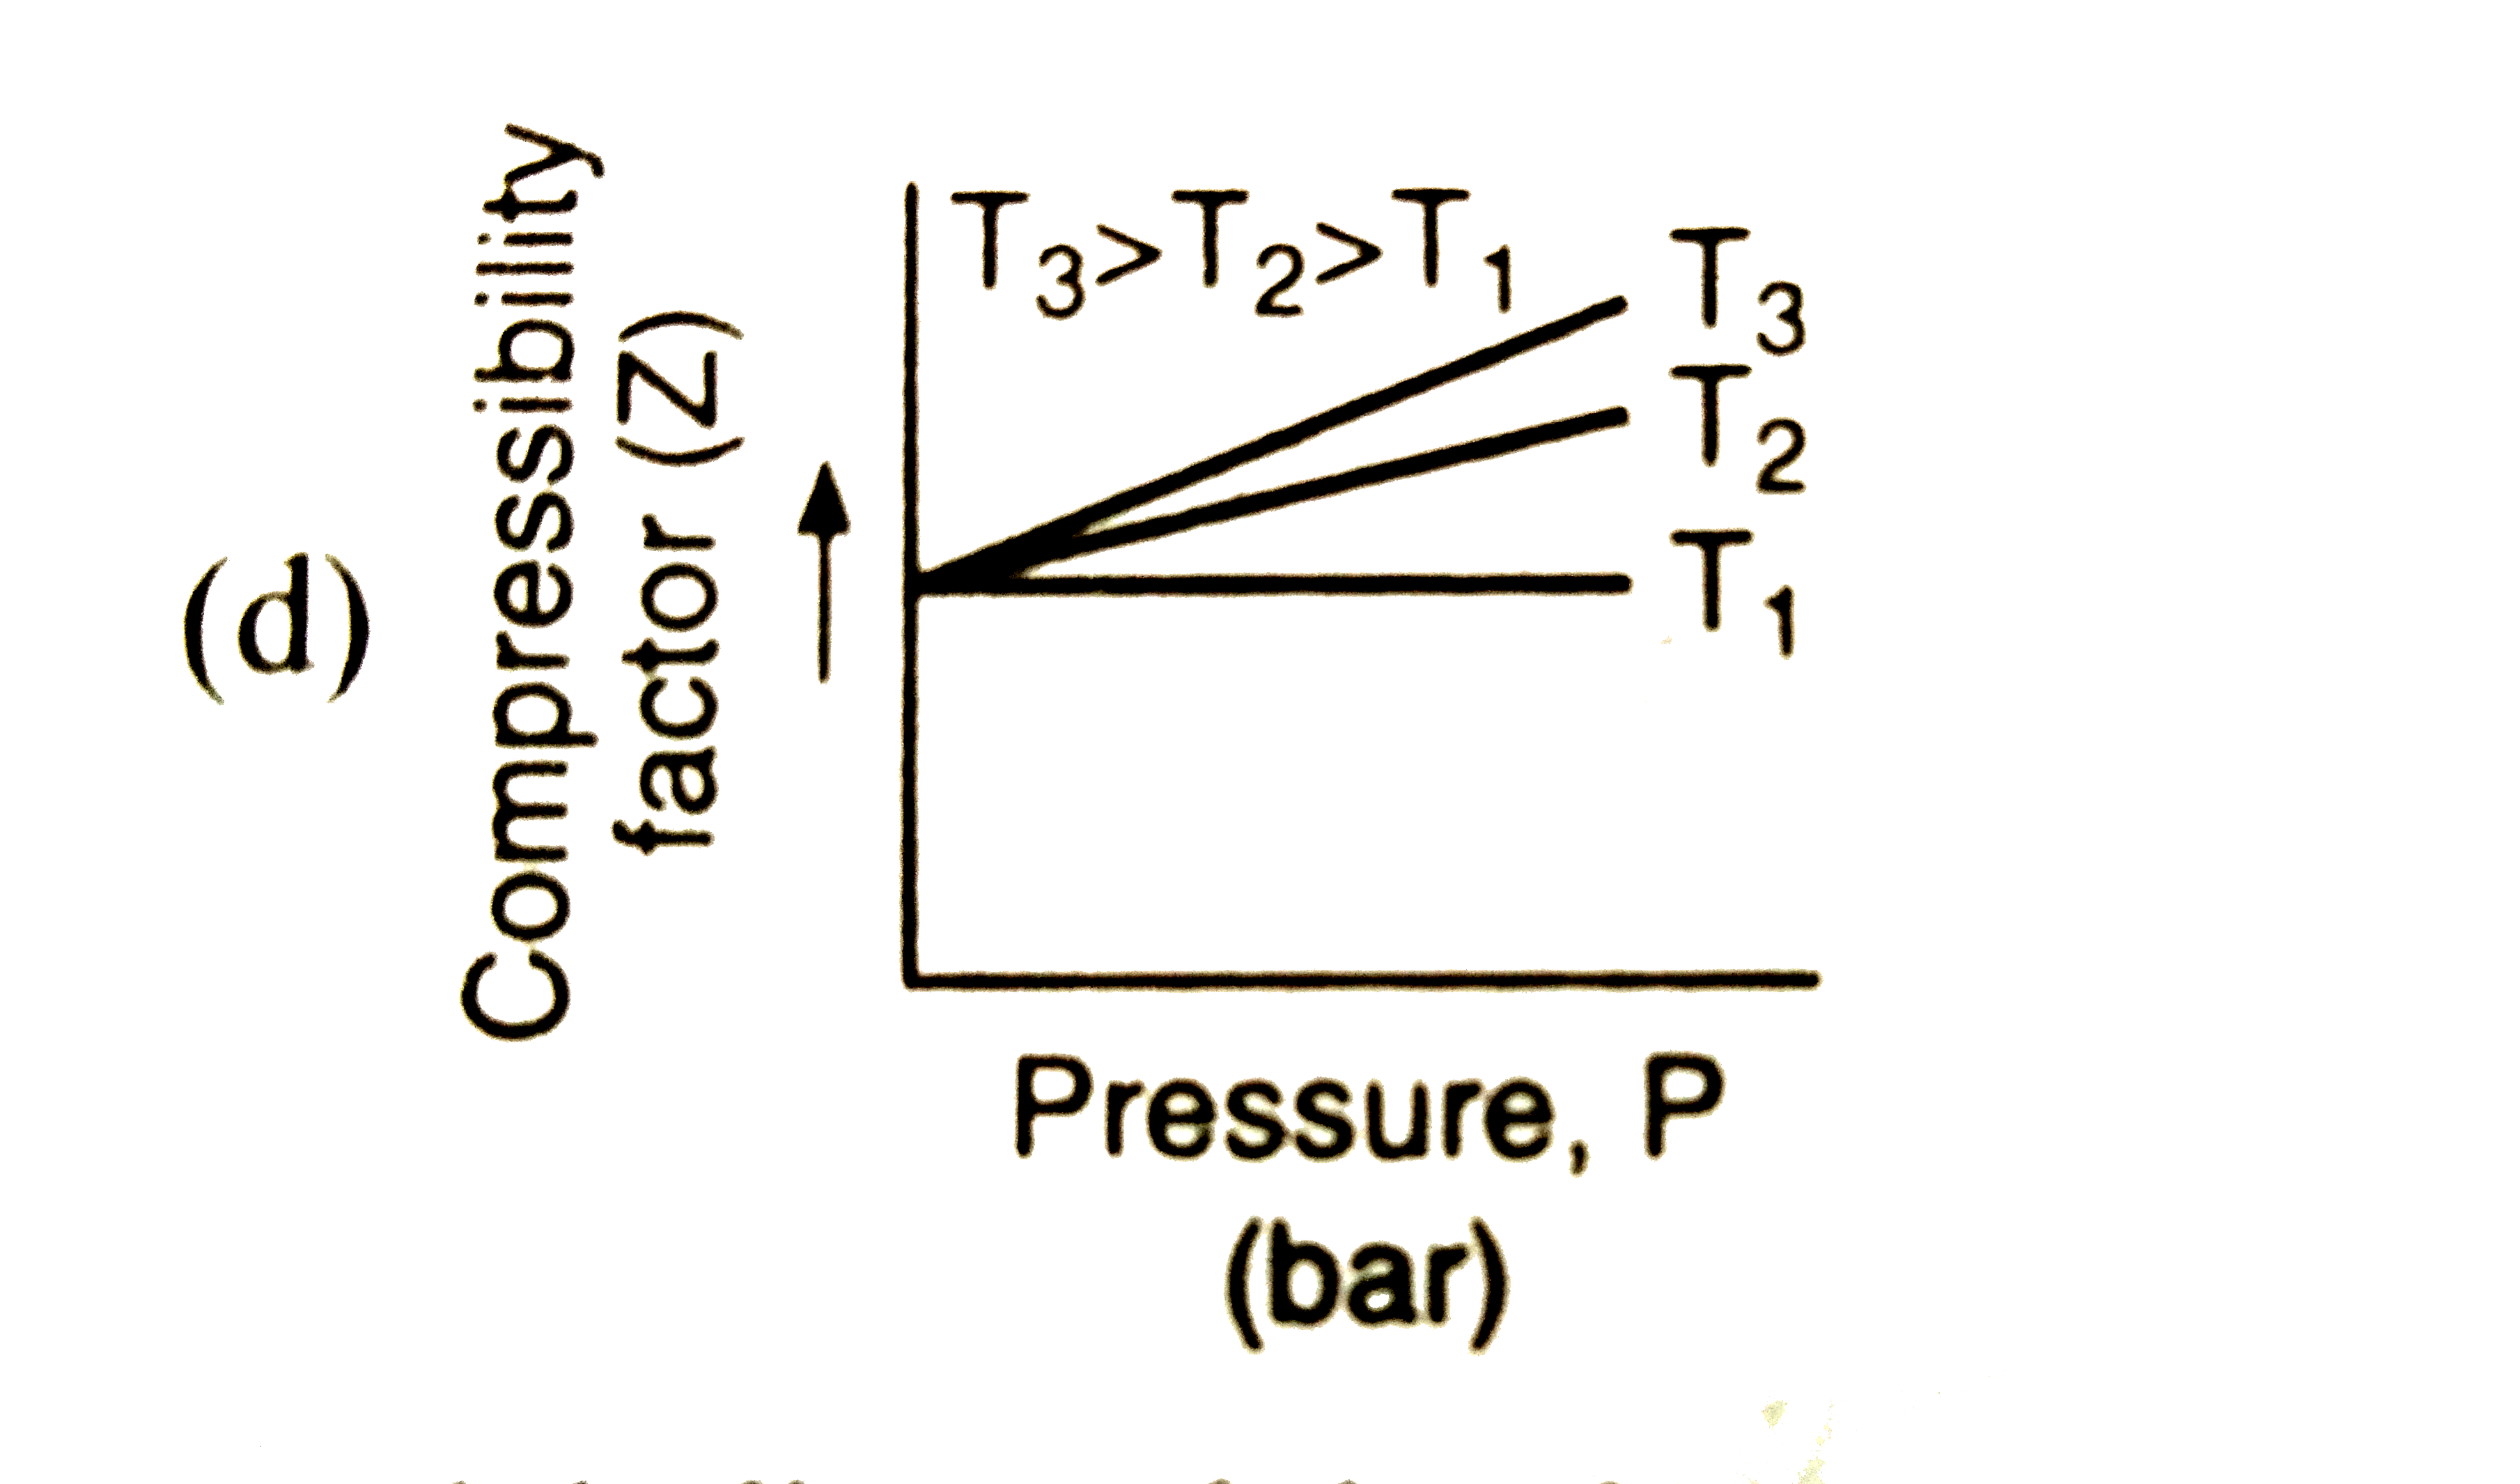
When a sample of ideal gas is changed from an initial state to a final state, various curves can be plotted for the process like P-V curve, V-T curve,P-T curve etc.
For example, P-V curve for a fixed amount of an ideal gas at constant temperature is a rectangular hyperbola, V-T curve for a fixed amount of an ideal gas at constant volume is again a straight line. However, the shapes may vary if the constant parameters are also changed.
Now, answer the following questions :
From the given plot between Z and P for a real gas the correct is :
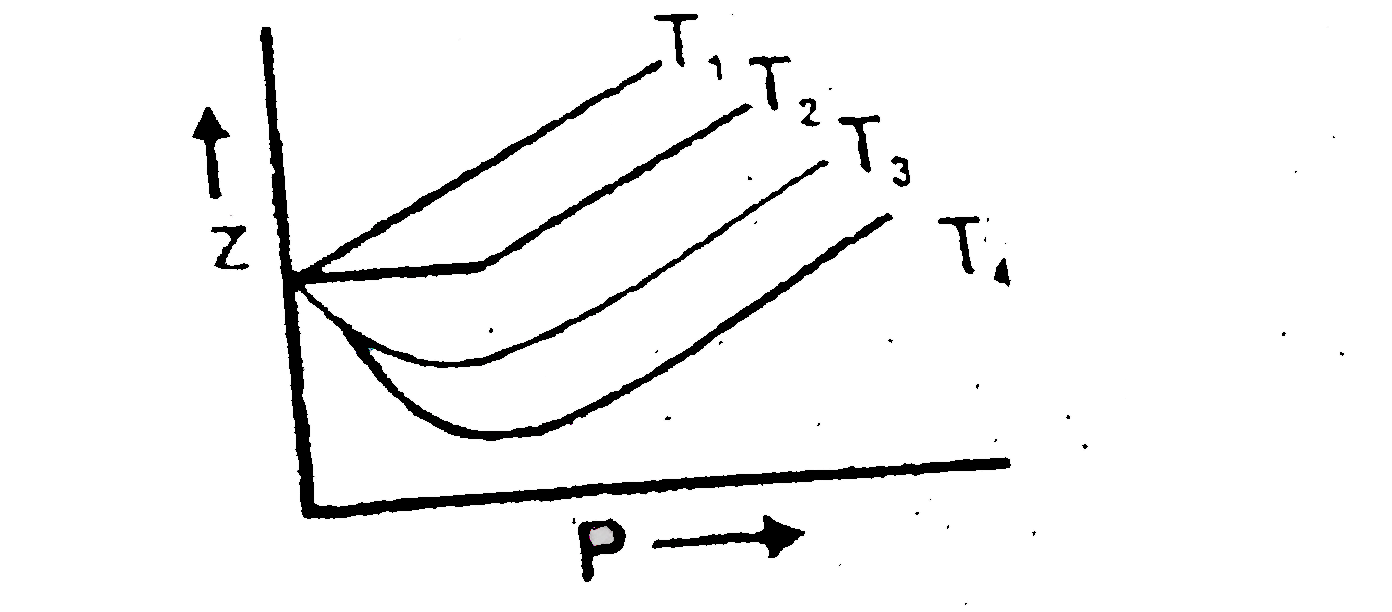
View SolutionWhen a sample of ideal gas is changed from an initial state to a final state, various curves can be plotted for the process like P-V curve, V-T curve,P-T curve etc.
For example, P-V curve for a fixed amount of an ideal gas at constant temperature is a rectangular hyperbola, V-T curve for a fixed amount of an ideal gas at constant volume is again a straight line. However, the shapes may vary if the constant parameters are also changed.
Now, answer the following questions :
From the given plot between Z and P for a real gas the correct is :

View Solution
For same mass of two different ideal gases of molecular weights M1 and M2 plots oflog V vs lot P at a given constant temperature are shown. Identify the correct option
View SolutionWhen a sample of ideal gas is changed from an initial state to a final state, various curves can be plotted for the process like P-V curve, V-T curve,P-T curve etc.
For example, P-V curve for a fixed amount of an ideal gas at constant temperature is a rectangular hyperbola, V-T curve for a fixed amount of an ideal gas at constant volume is again a straight line. However, the shapes may vary if the constant parameters are also changed.
Now, answer the following questions :
Which of the following statements is correct regarding a fixed amount of ideal gas undergoing the following process :
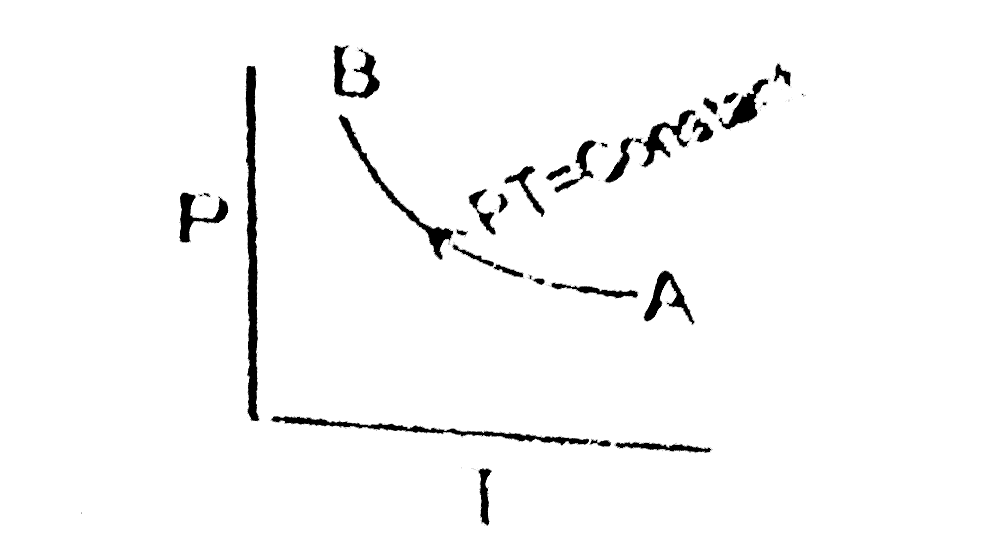
View SolutionWhen a sample of ideal gas is changed from an initial state to a final state, various curves can be plotted for the process like P-V curve, V-T curve,P-T curve etc.
For example, P-V curve for a fixed amount of an ideal gas at constant temperature is a rectangular hyperbola, V-T curve for a fixed amount of an ideal gas at constant volume is again a straight line. However, the shapes may vary if the constant parameters are also changed.
Now, answer the following questions :
Which of the following graphs is not possible for a fixed amount of ideal gas upon moving from initial state A to final state B :
View Solution
