The curve of pressure volume (PV) against pressure (P) of the gas at a particular temperature is as shown, according to the graph. Which of the following is incorrect (in the low pressure region)?
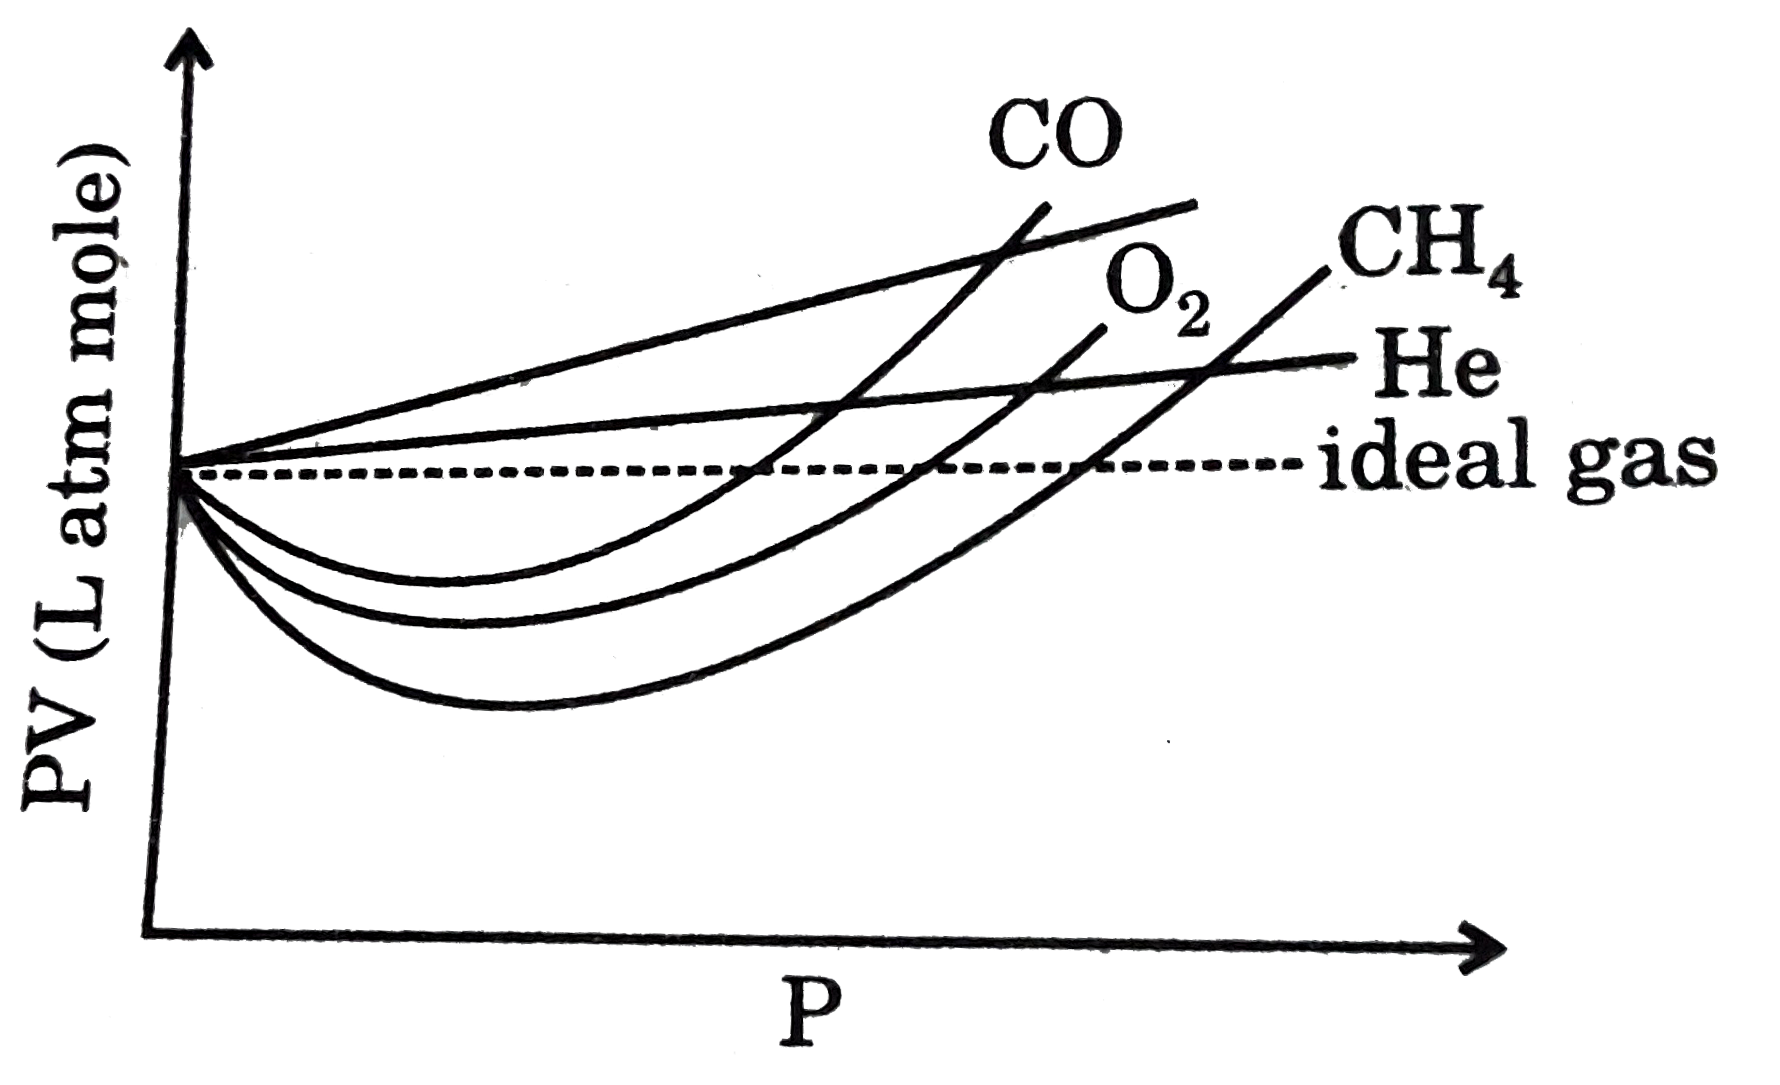
H2 and He shows +ve deviation from ideal gas equation
CO,CH4 and O2 show negative deviation from ideal gas equation.
H2 and He show negative deviation while CO2,CH4 and O2 show positive deviation
H2 and He are less compressible than that of an ideal gas while CO2,CH4 and O2 more compressible than that of ideal gas.
The correct Answer is:C
Topper's Solved these Questions
- GRAPHICAL INTERPRETATIONBOOK - GRB PUBLICATIONCHAPTER - GRAPHICAL INTERPRETATIONEXERCISE - C. Atomic Sturcture
1 Videos
- GRAPHICAL INTERPRETATIONBOOK - GRB PUBLICATIONCHAPTER - GRAPHICAL INTERPRETATIONEXERCISE - Atomic Sturcture
9 Videos
- GRAPHICAL INTERPRETATIONBOOK - GRB PUBLICATIONCHAPTER - GRAPHICAL INTERPRETATIONEXERCISE - B. Gaseous State
1 Videos
- F-BLOCK ELEMENTSBOOK - GRB PUBLICATIONCHAPTER - F-BLOCK ELEMENTSEXERCISE - Subjective type
7 Videos
- HYDROCARBON (ALIPHATIC)BOOK - GRB PUBLICATIONCHAPTER - HYDROCARBON (ALIPHATIC)EXERCISE - Previous years jee questions
28 Videos
Similar Questions
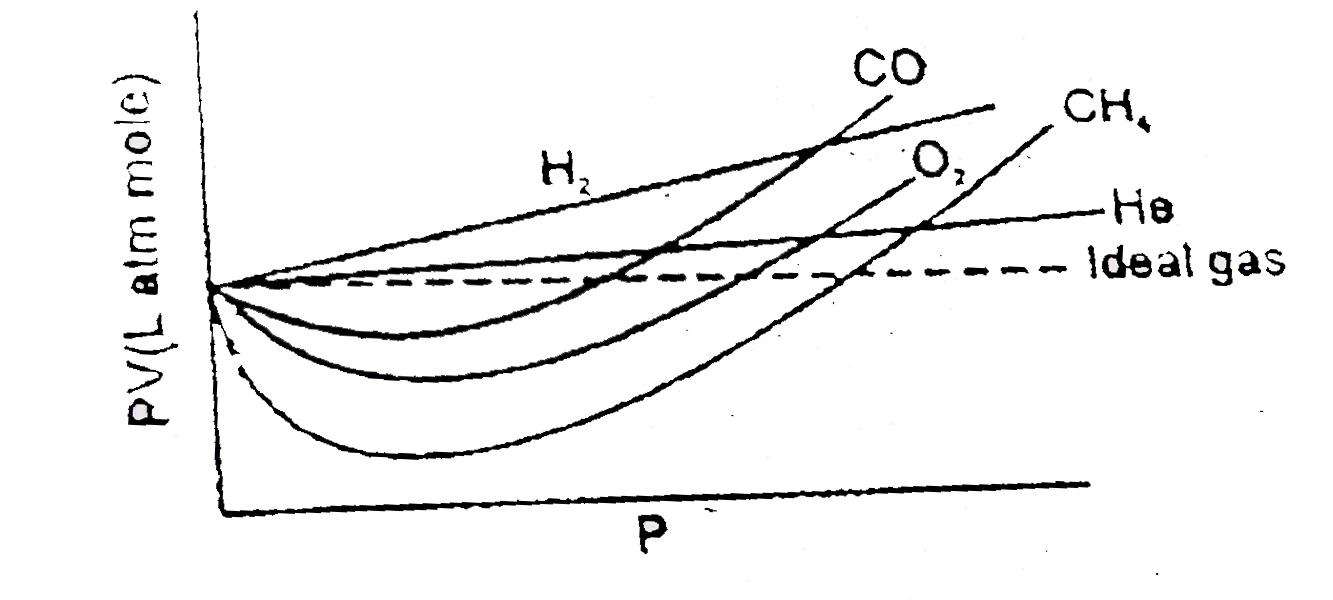
The curve of pressure volume (PV) against pressure (P) of the gas at a particular temperature is as shown, according to the graph which of the following is/are incorrect (in low pressure region):
View SolutionThe variation of pressure with volume of the gas at different temperatures can be graphically represented as shown in figure. On the basis of this graph answer the following questions.
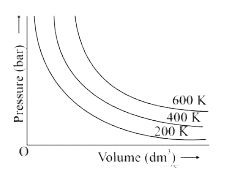
How will the volume of a gas change if its pressure is increased at constant temperature?
View Solution
Knowledge Check
The curve of pressure volume (PV) against pressure (P) of the gas at a particular temperature is as shown, according to the graph which of the following is/are incorrect (in low pressure region):
 AH2 and He show positive deviation from ideal gas equationBCO, CH4 and O2 show negative deviation from ideal gas equationCH2 and He show negative deviation while CO2,CH4 and O2 show positive deviationDH2 and He are less compressible than that of an ideal gas while CO2,CH4 and O2 more compressible than that of ideal gas.
when an ideal gas with pressure p and volume V is compressed Isothermally to one - fourth of its volume, is pressure is P1 when the same gas is compressed polytropically according to the equation PV1.5 contents to one - fourth of its initial volume, the pressure is P2 the ratio P1P2 is
A12B121.5C2D21.5At a given volume and temperature ,the pressure of a gas
Avaries inversely as its massBvaries inversely as the square of its massCvaries linearly as its massDis independent of its mass
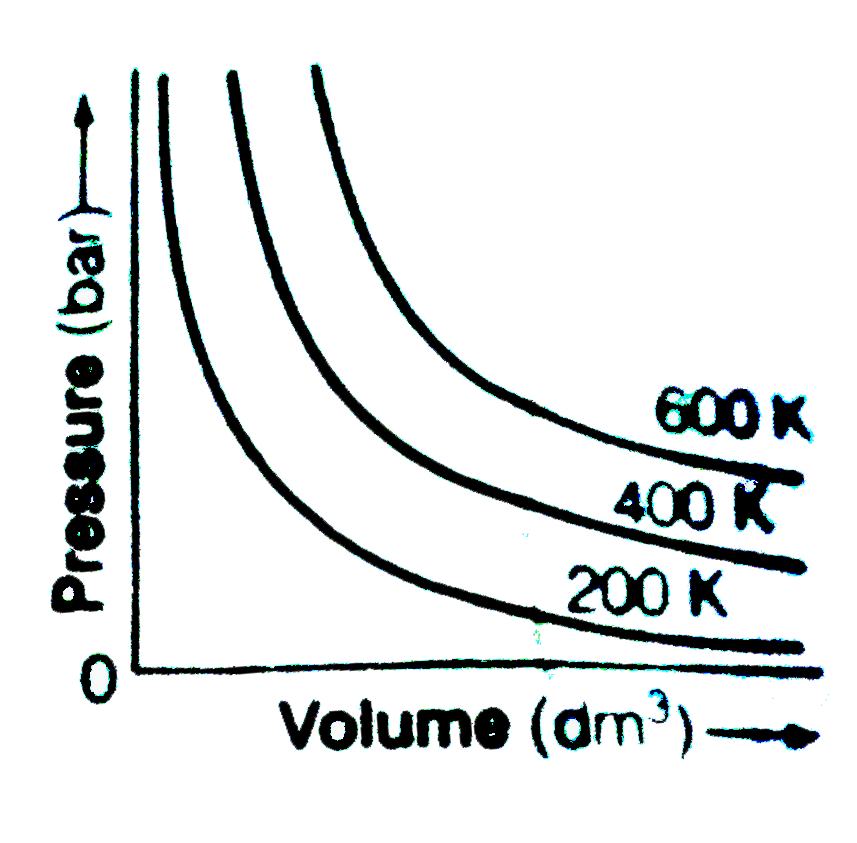
The variation of pressure with volume of the gas at different temperatures can be graphically represented as shown in figure. On the basis of this graph answer the following question.
(i) How will the volume of a gas change if its pressure is increased at constant temperature ?
(ii) At a constant pressure, how will the volume of a gas change if the temperature is increased from 200 K to 400 K ?
View SolutionThe variation of pressure with volume of the gas at different temperatures can be graphically represented as shown in figure. On the basis of this graph answer the following question.
(i) How will the volume of a gas change if its pressure is increased at constant temperature ?
(ii) At a constant pressure, how will the volume of a gas change if the temperature is increased from 200 K to 400 K ?

View SolutionAt a given volume and temperature the pressure of a gas
View Solutionwhen an ideal gas with pressure p and volume V is compressed Isothermally to one - fourth of its volume, is pressure is P1 when the same gas is compressed polytropically according to the equation PV1.5 contents to one - fourth of its initial volume, the pressure is P2 the ratio P1P2 is
View SolutionSketch shows the plot of Z v/s P for a hypothetical gas for one mole at three distint temperature.
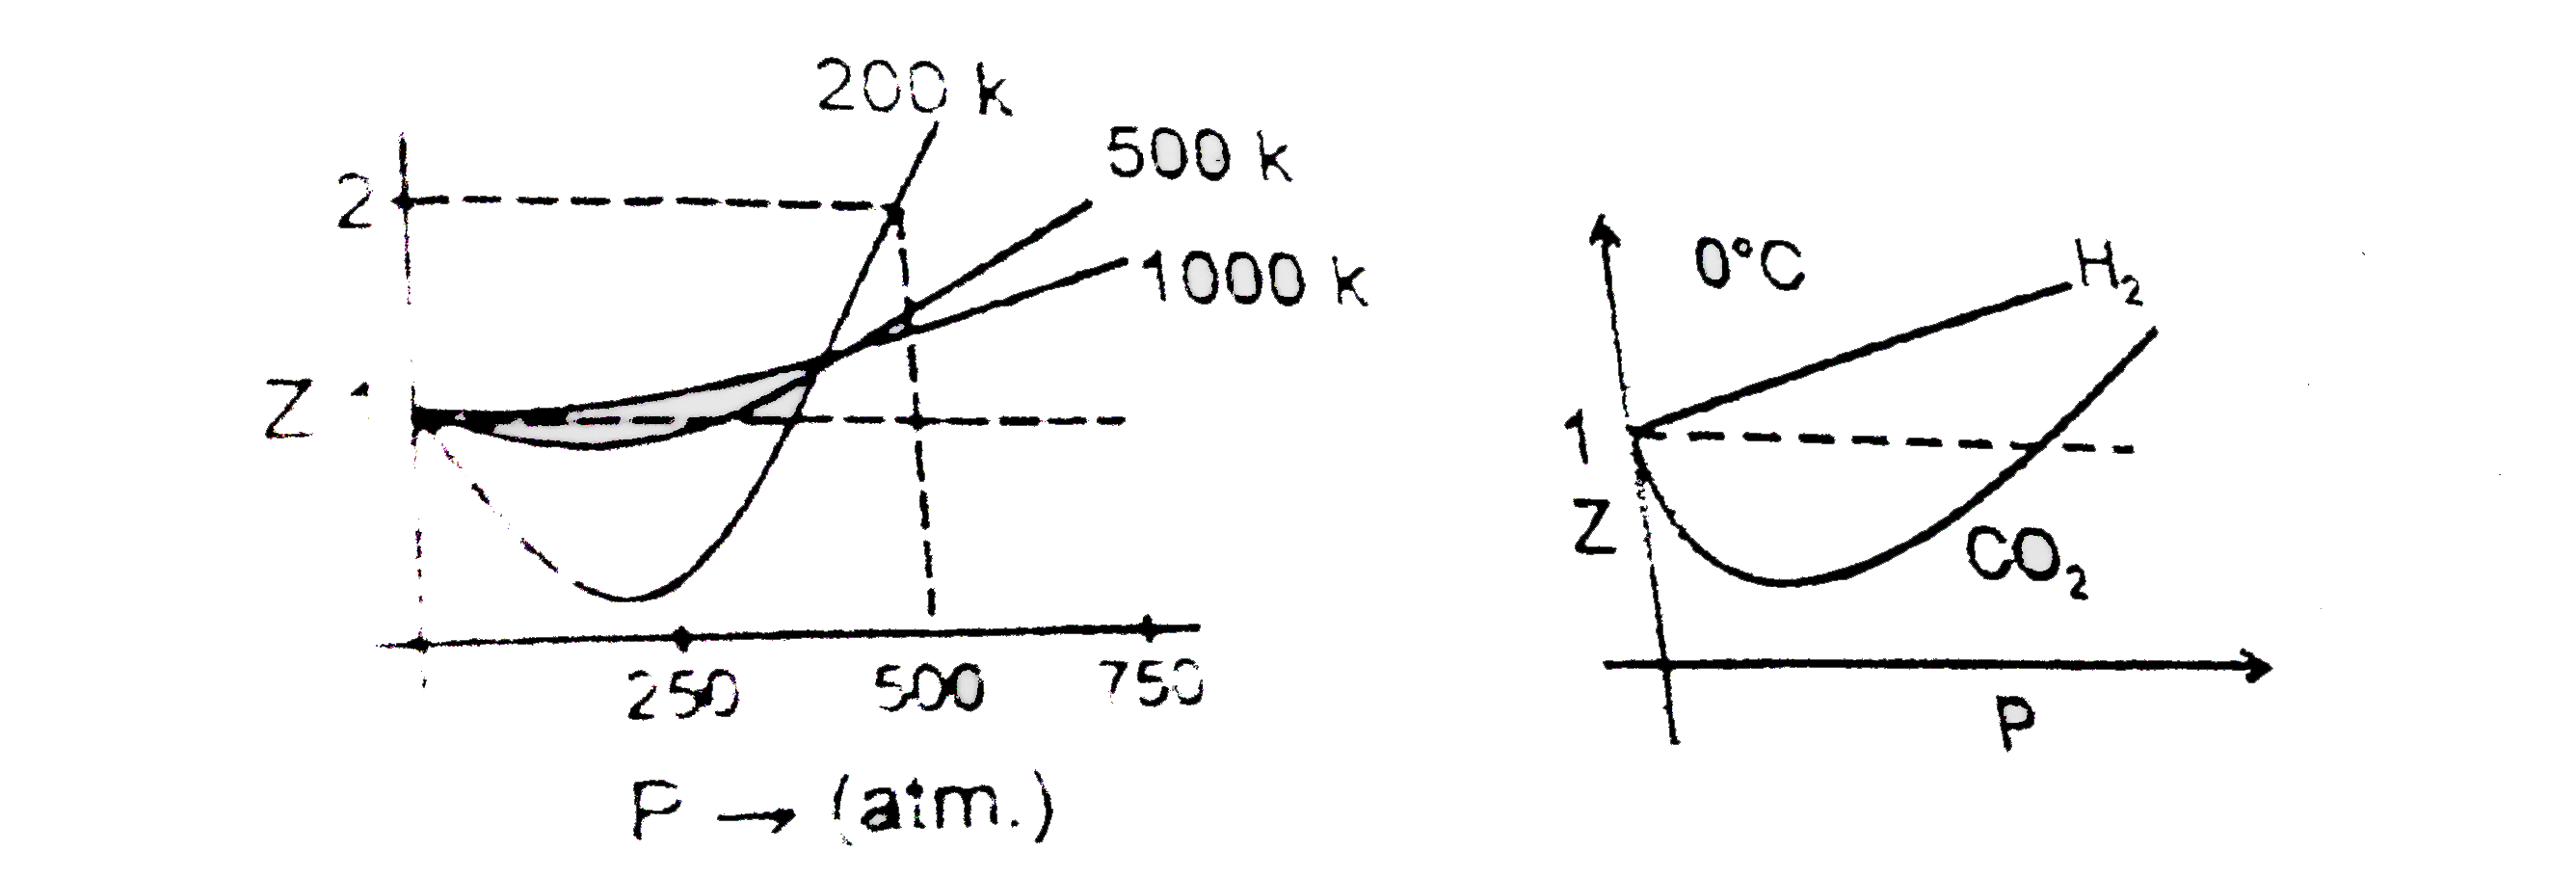
Boyle's temperature is the temperature at which gas shows ideal behaviour over a pressure range in the low pressure region.Boyle's temperature (Tb)=aRb.If a plot is obtained at temperature well below Boyle's temperature then the curve will show negative deviation, in low pressure region and positive deviation in the high pressure region. Near critical temperature the curve is more likely as CO2 and the temperature well above critical temperature curve is more like H2 at 0∘C as shown above.At high pressure suppose all the constant temperature curve varies linearly with pressure according to the following equation : Z=1+PbRT (R=2calmol−1K−1)
As shown in the figure at 200 K and 500 atm value of compressibility factor is 2 (approx).Then volume of the gas at the point will be
View Solution
