Which of the following volume-temperature (V−I) plots represents the behaviour of 1mole of an ideal gas at the atmospheric pressure?
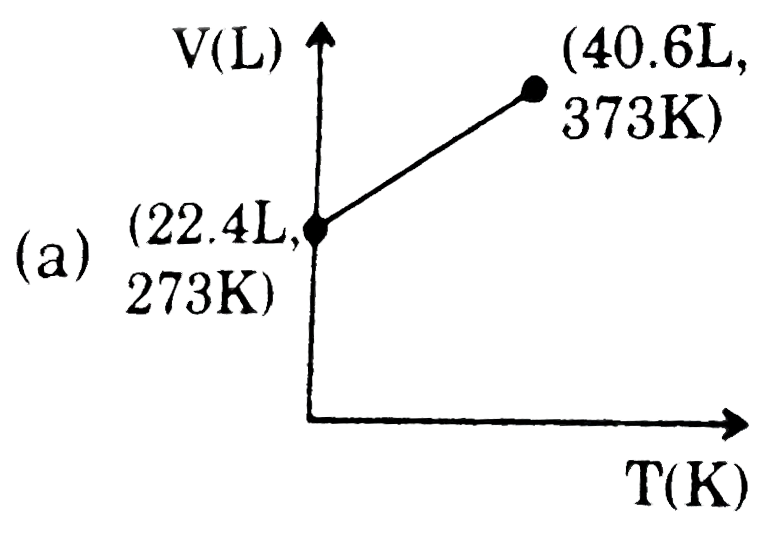
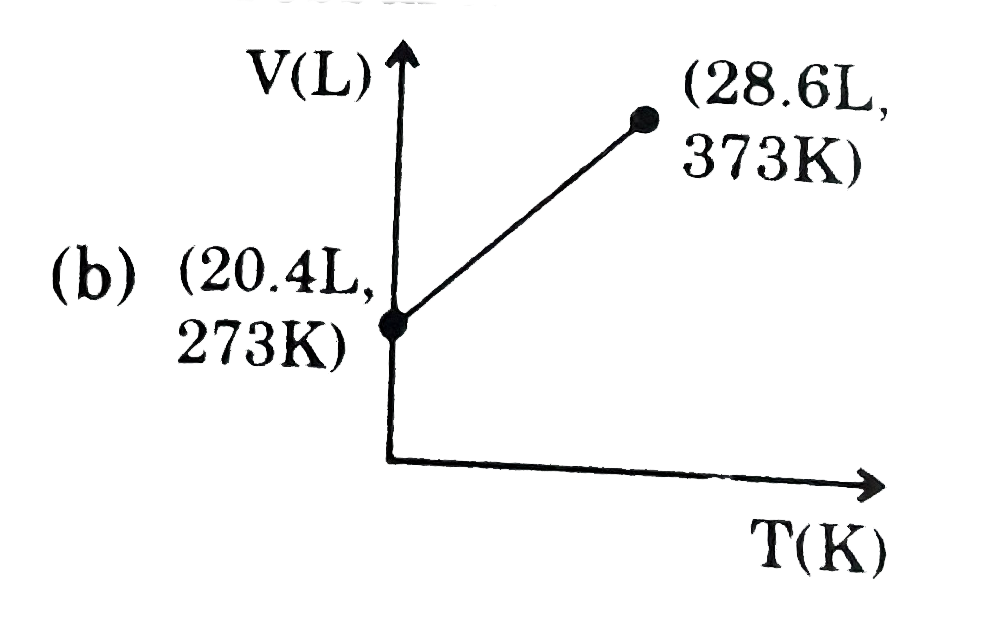
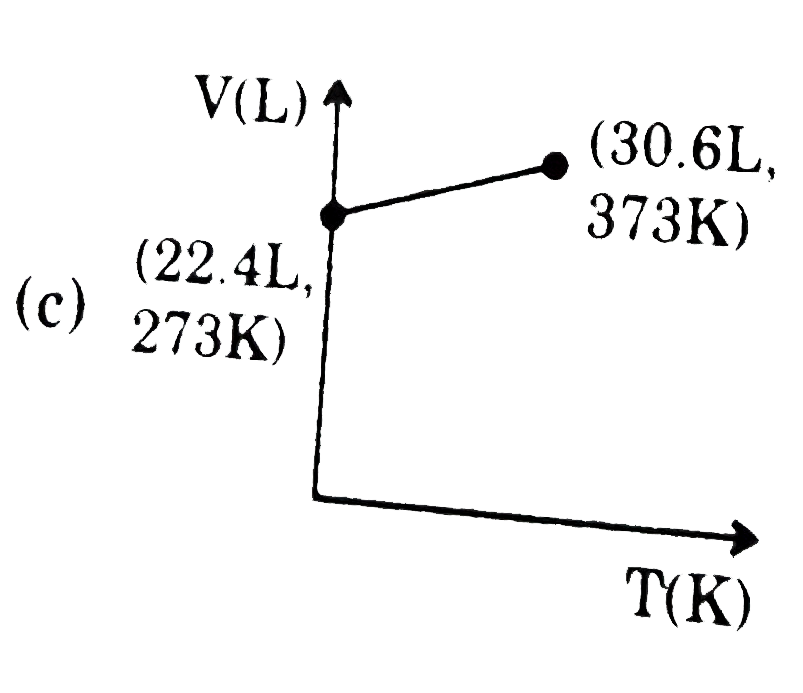
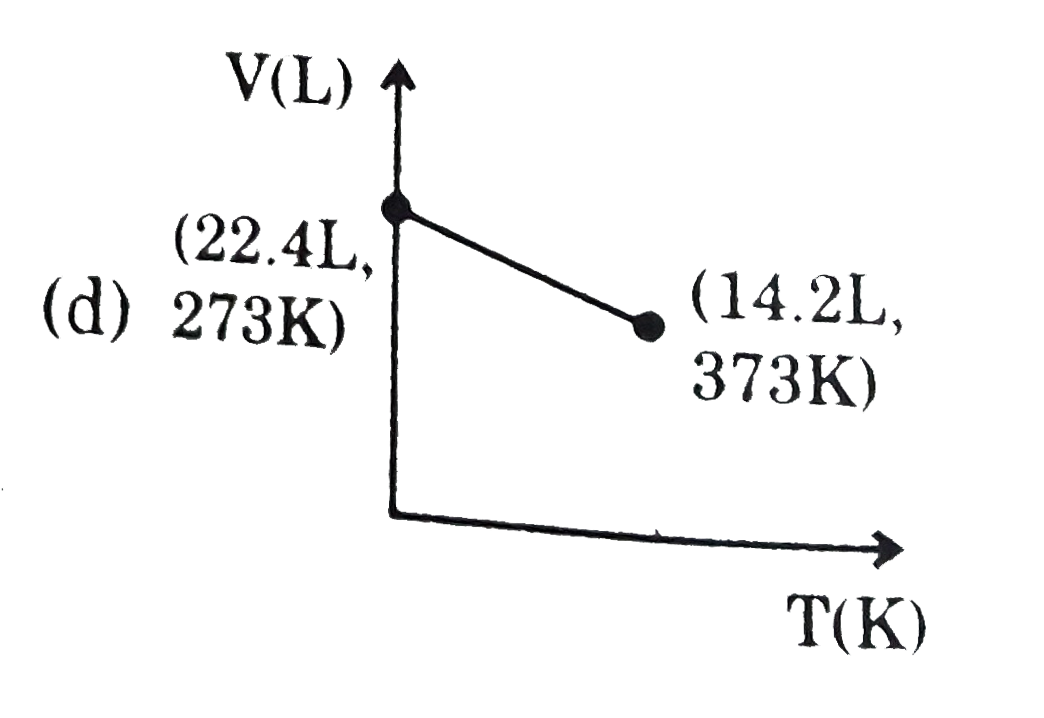
The correct Answer is:C
Step by step video, text & image solution for Which of the following volume-temperature (V-I) plots represents the behaviour of 1 "mole" of an ideal gas at the atmospheric pressure? by Chemistry experts to help you in doubts & scoring excellent marks in Class 12 exams.
Topper's Solved these Questions
- BOOK - GRB PUBLICATIONCHAPTER - GRAPHICAL INTERPRETATIONEXERCISE - C. Atomic Sturcture1videos
GRAPHICAL INTERPRETATION
- BOOK - GRB PUBLICATIONCHAPTER - GRAPHICAL INTERPRETATIONEXERCISE - Atomic Sturcture9videos
GRAPHICAL INTERPRETATION
- BOOK - GRB PUBLICATIONCHAPTER - GRAPHICAL INTERPRETATIONEXERCISE - B. Gaseous State1videos
GRAPHICAL INTERPRETATION
- BOOK - GRB PUBLICATIONCHAPTER - F-BLOCK ELEMENTSEXERCISE - Subjective type7videos
F-BLOCK ELEMENTS
- BOOK - GRB PUBLICATIONCHAPTER - HYDROCARBON (ALIPHATIC)EXERCISE - Previous years jee questions28videos
HYDROCARBON (ALIPHATIC)
Similar Questions
Which of the following volume (V) - temperature (T) plots represents the behaviour of one mole of an ideal gas at one atmospheric pressure?
View SolutionWhich of the following volume (V)-temperature (T) plots represents the behaviour of one mole of an ideal gas at one atmoshperic pressure?
View Solution
Knowledge Check
- Question 1 - Select One
Which of the following volume (V) - temperature (T) plots represents the behaviour of one mole of an ideal gas at one atmospheric pressure?
A B
B C
C D
D
- Question 2 - Select One
Which one of the following volume (V)- temperature (T) plots represents the behaviour of one mole of an ideal gas at one atmosphere?
A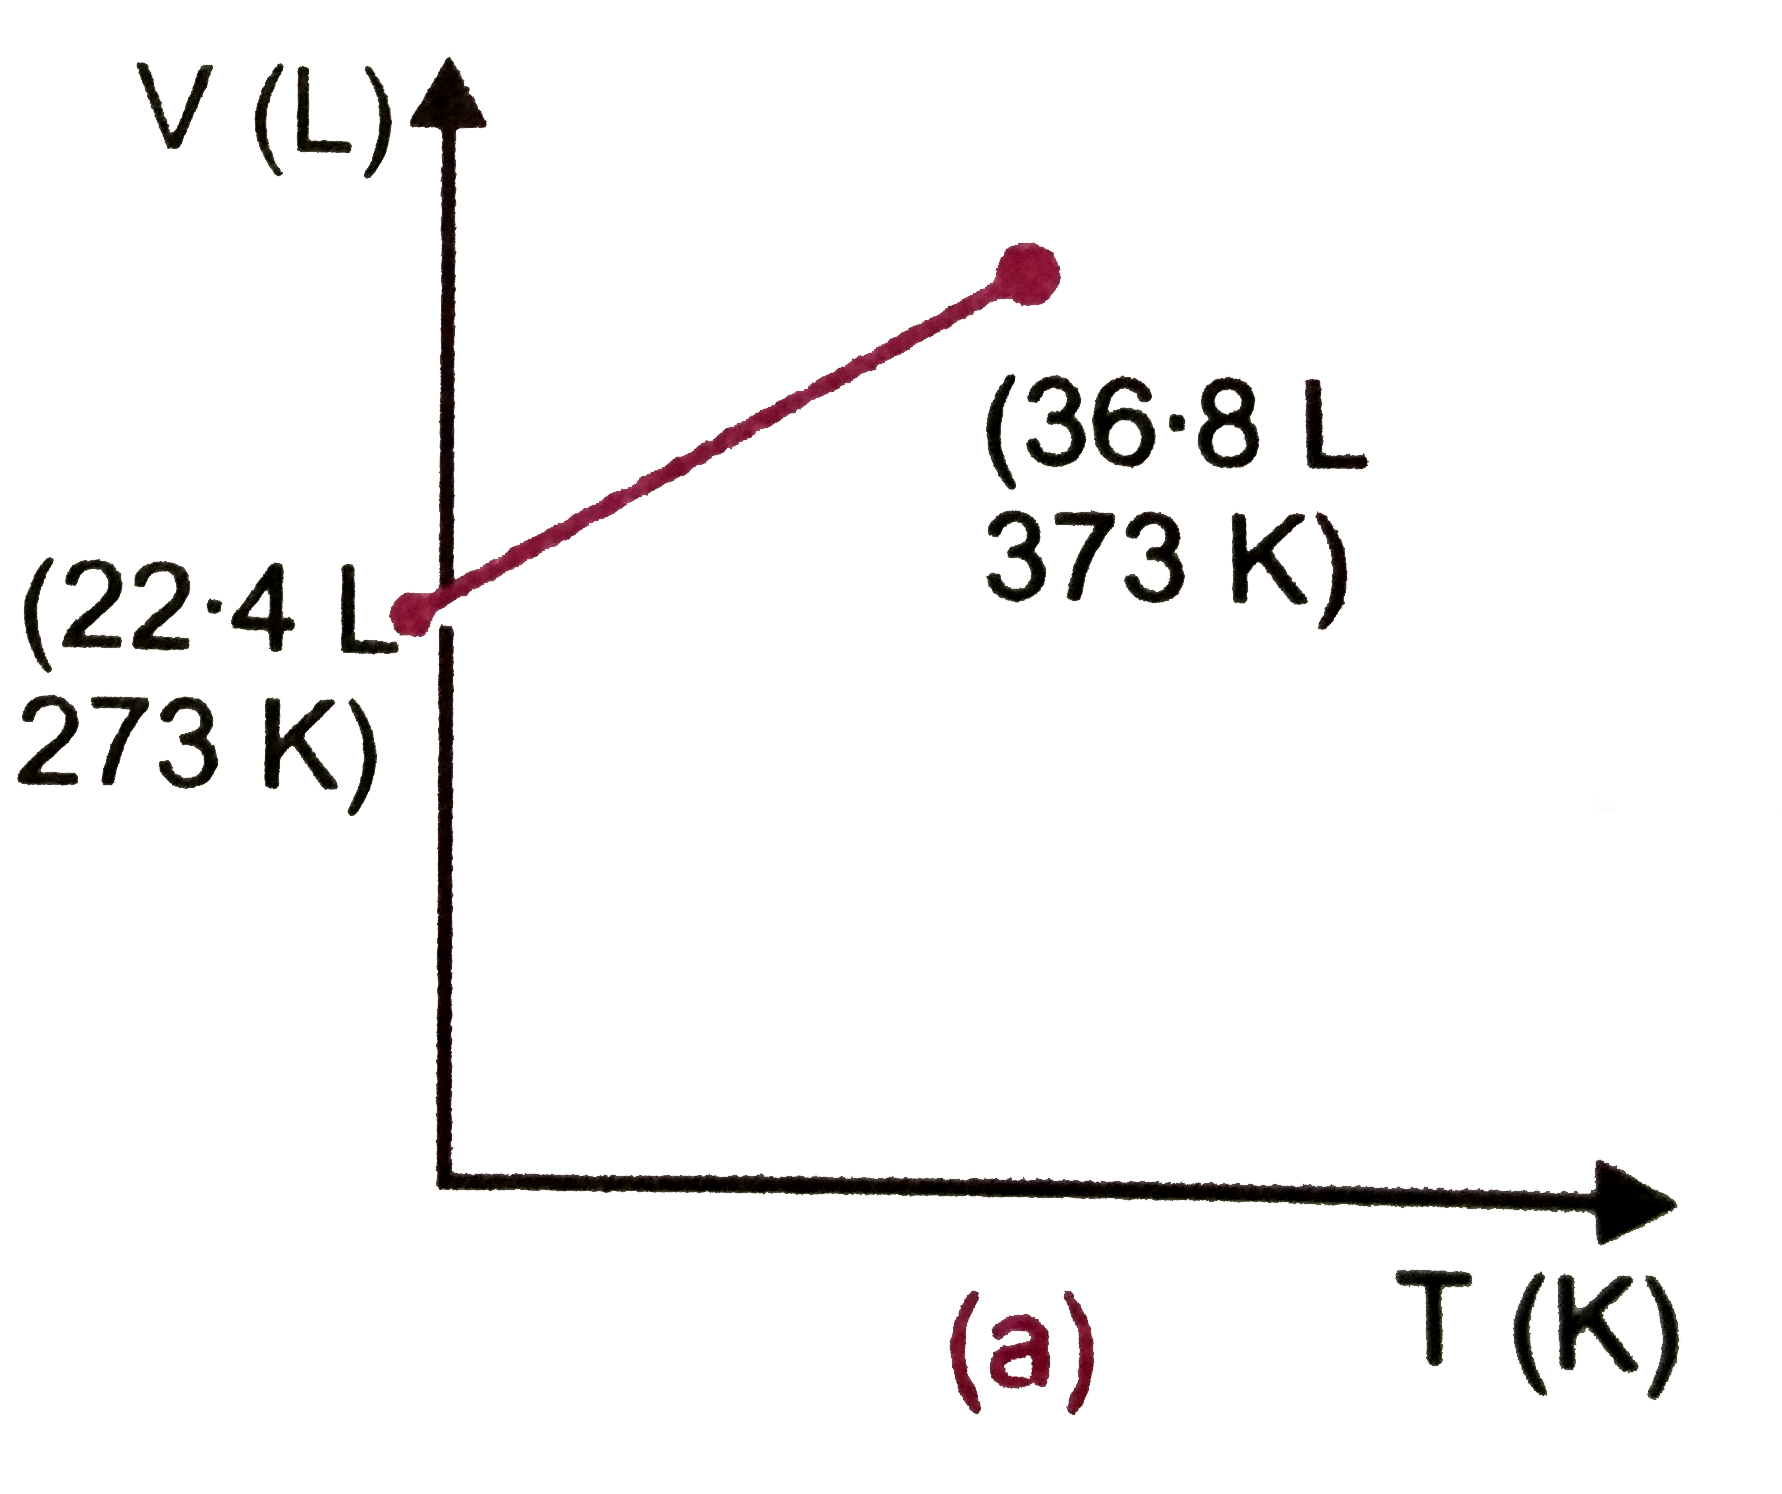 B
B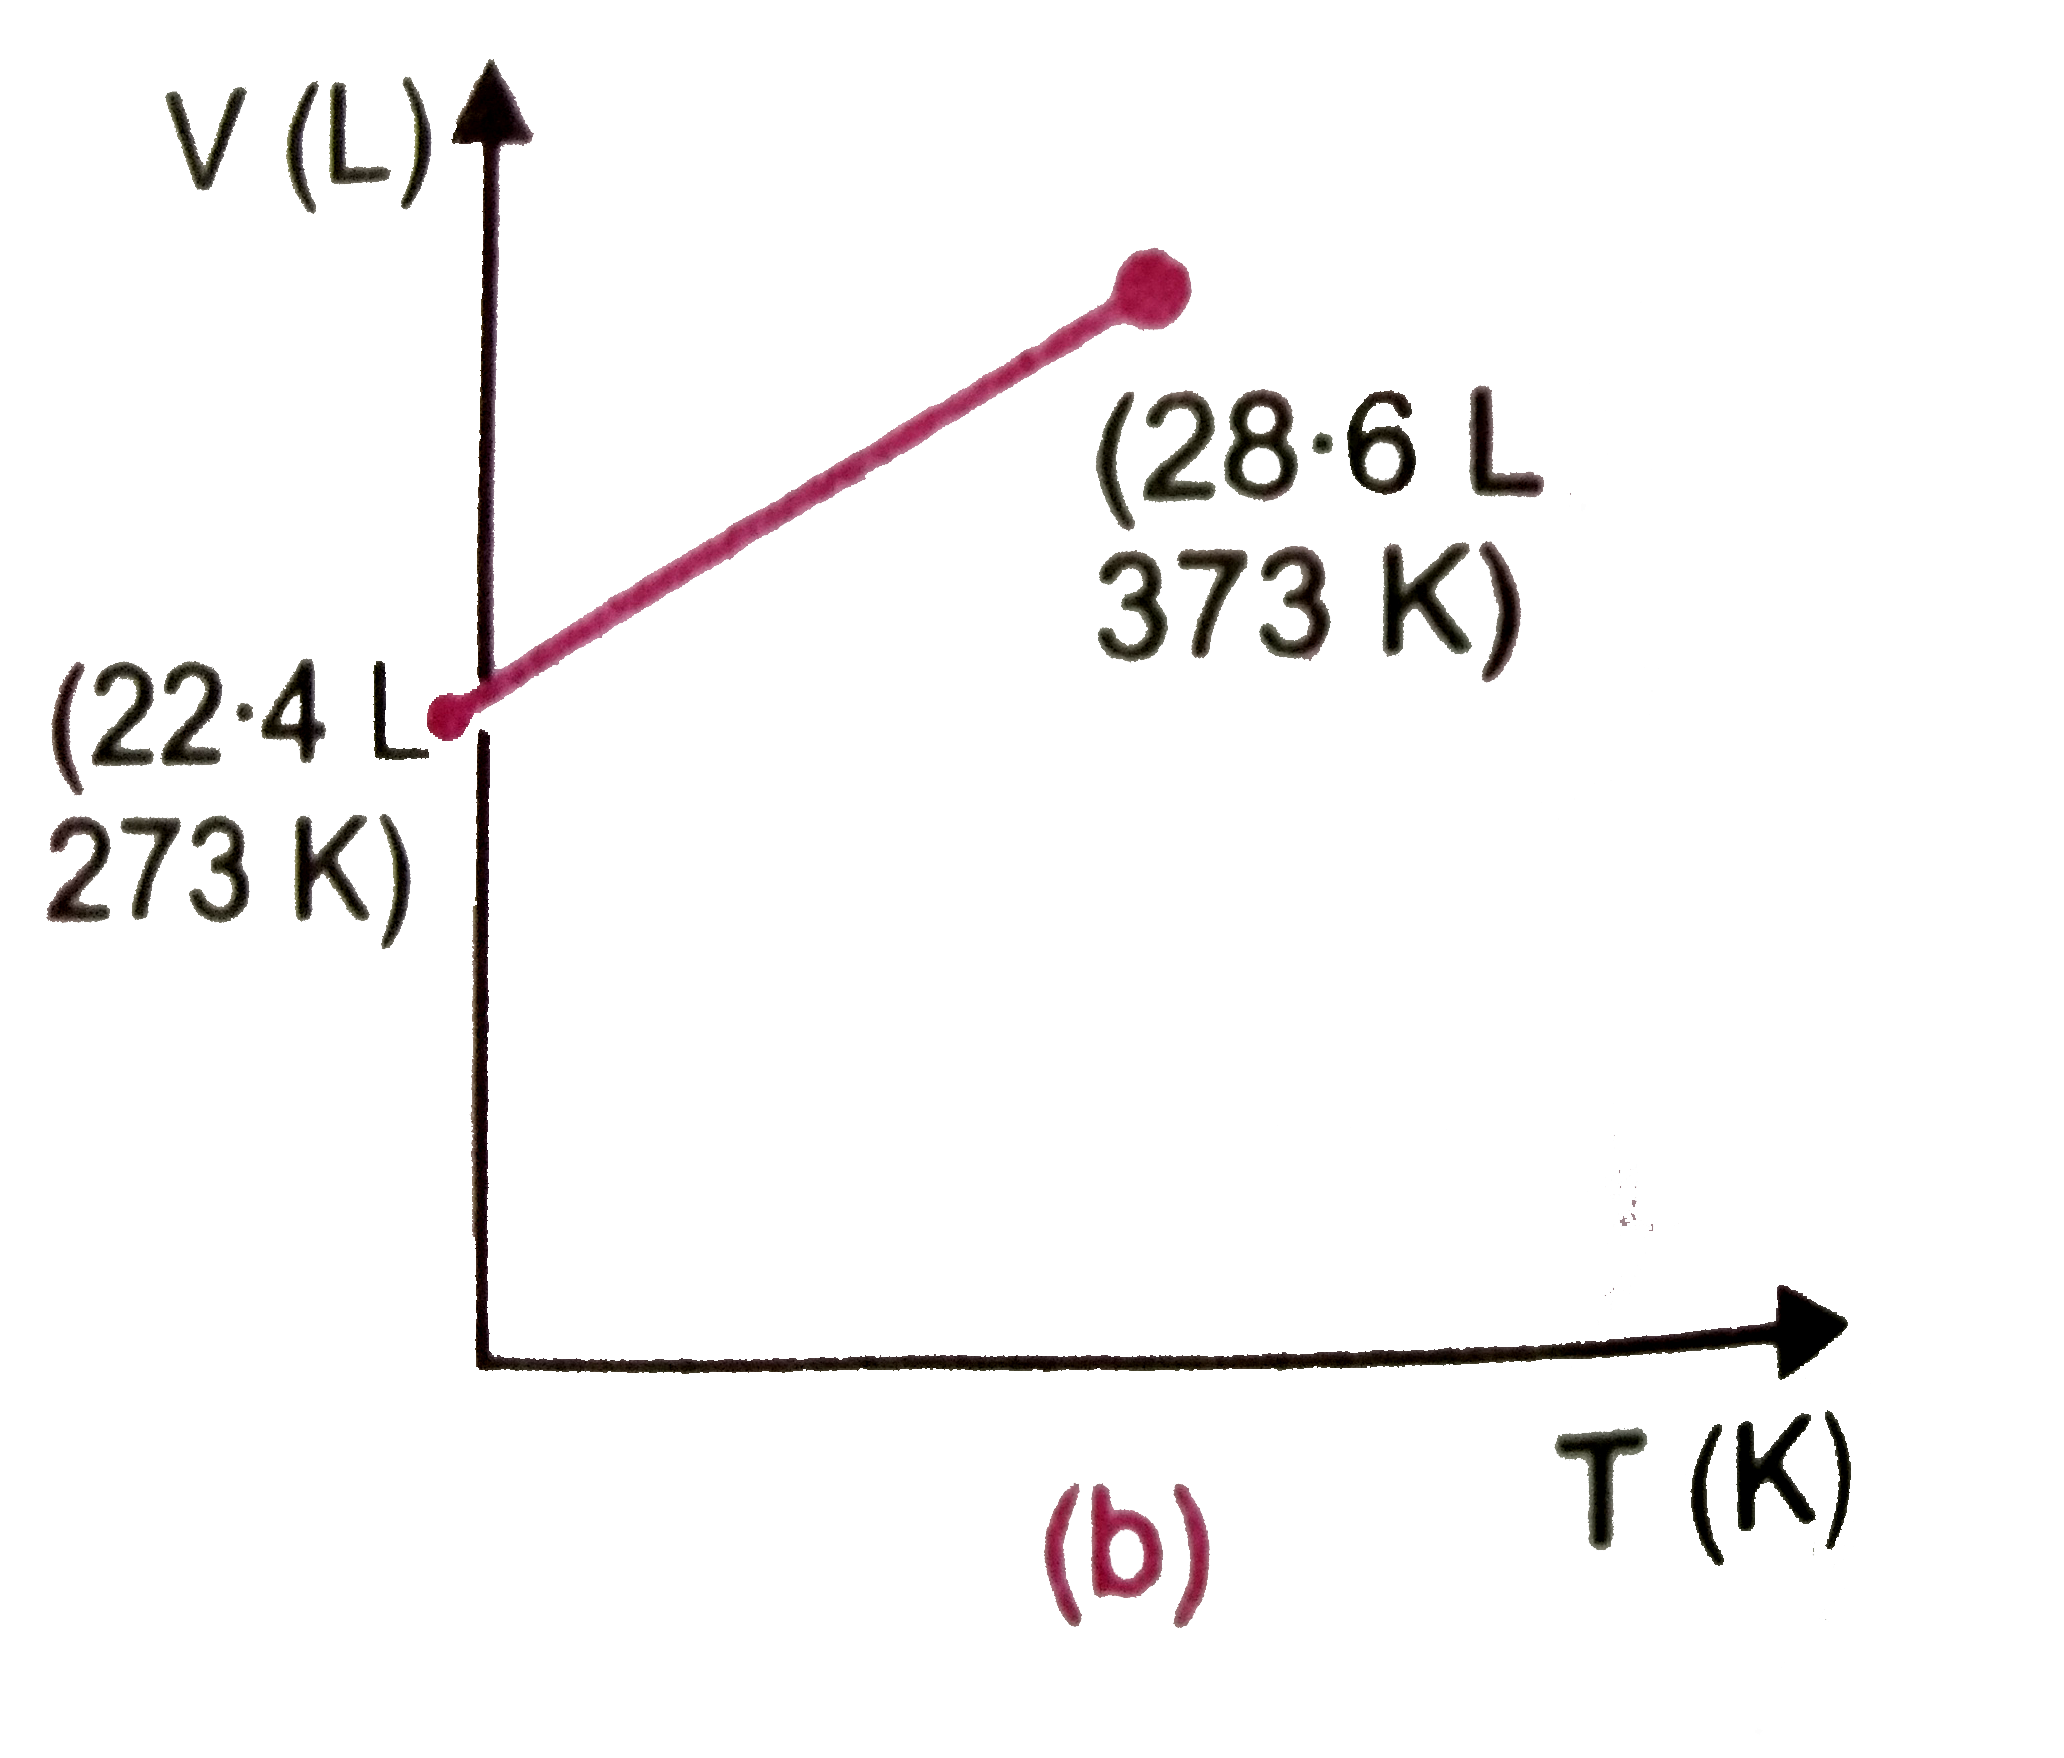 C
C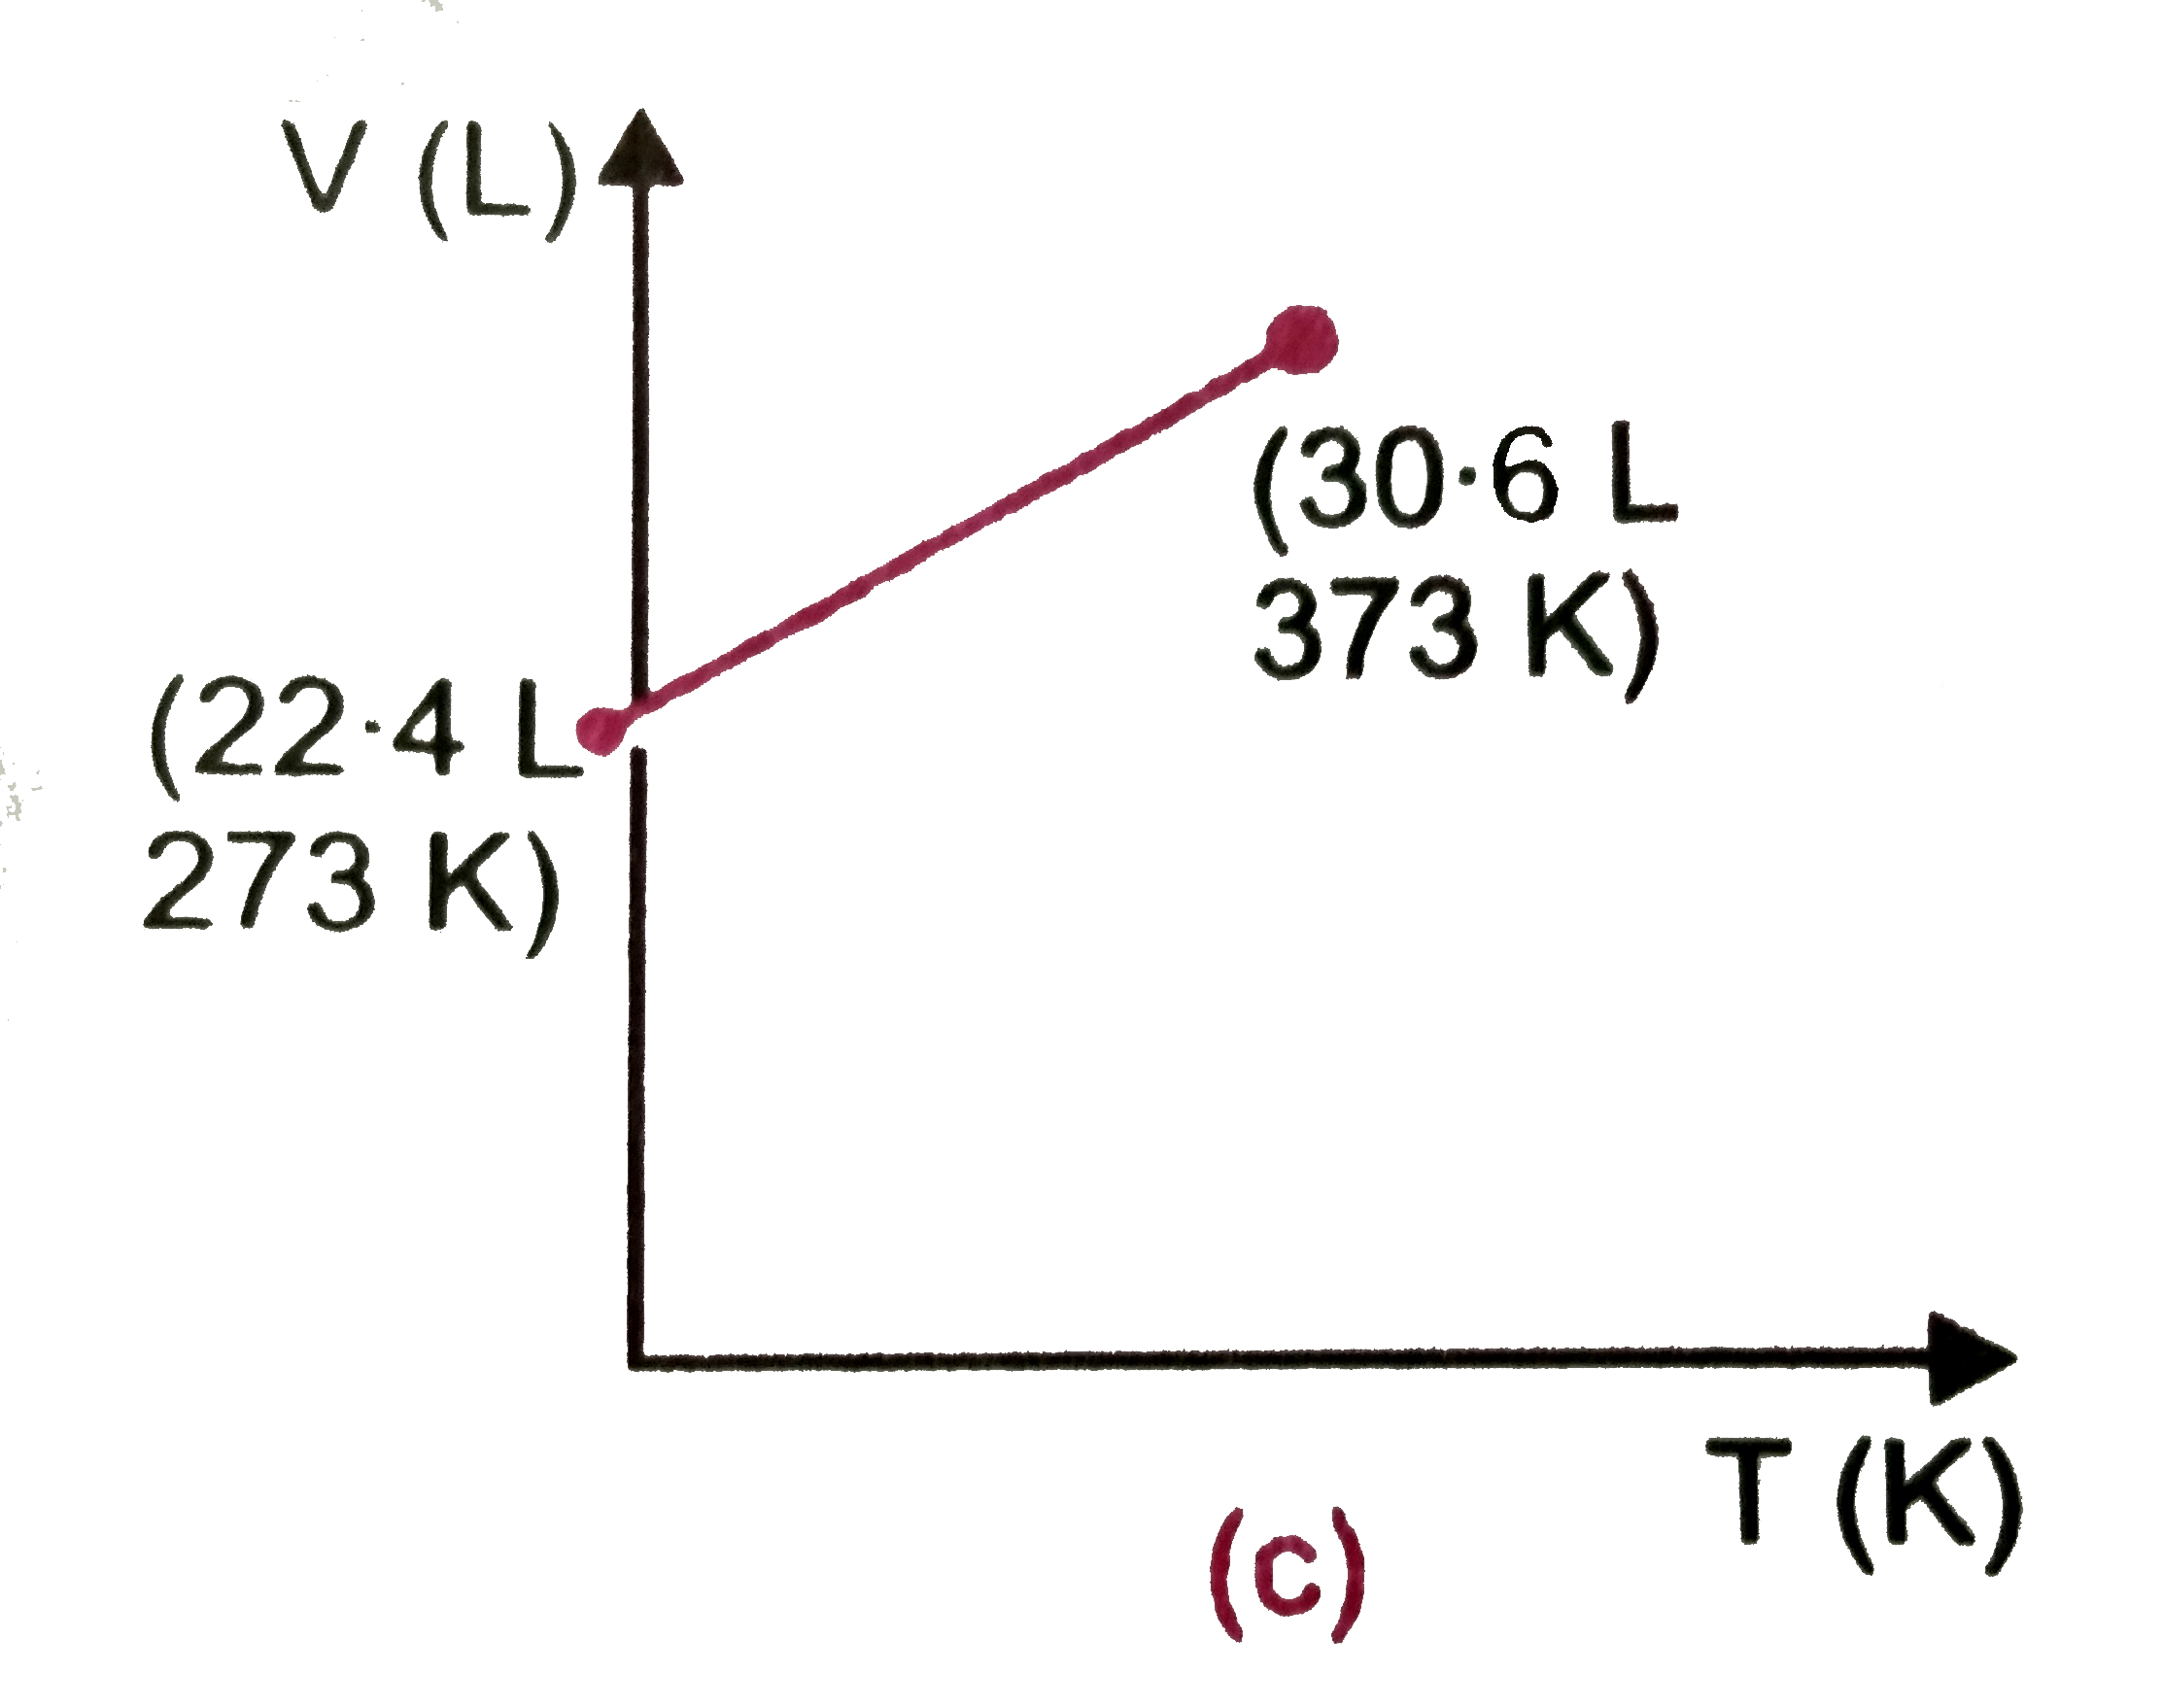 D
D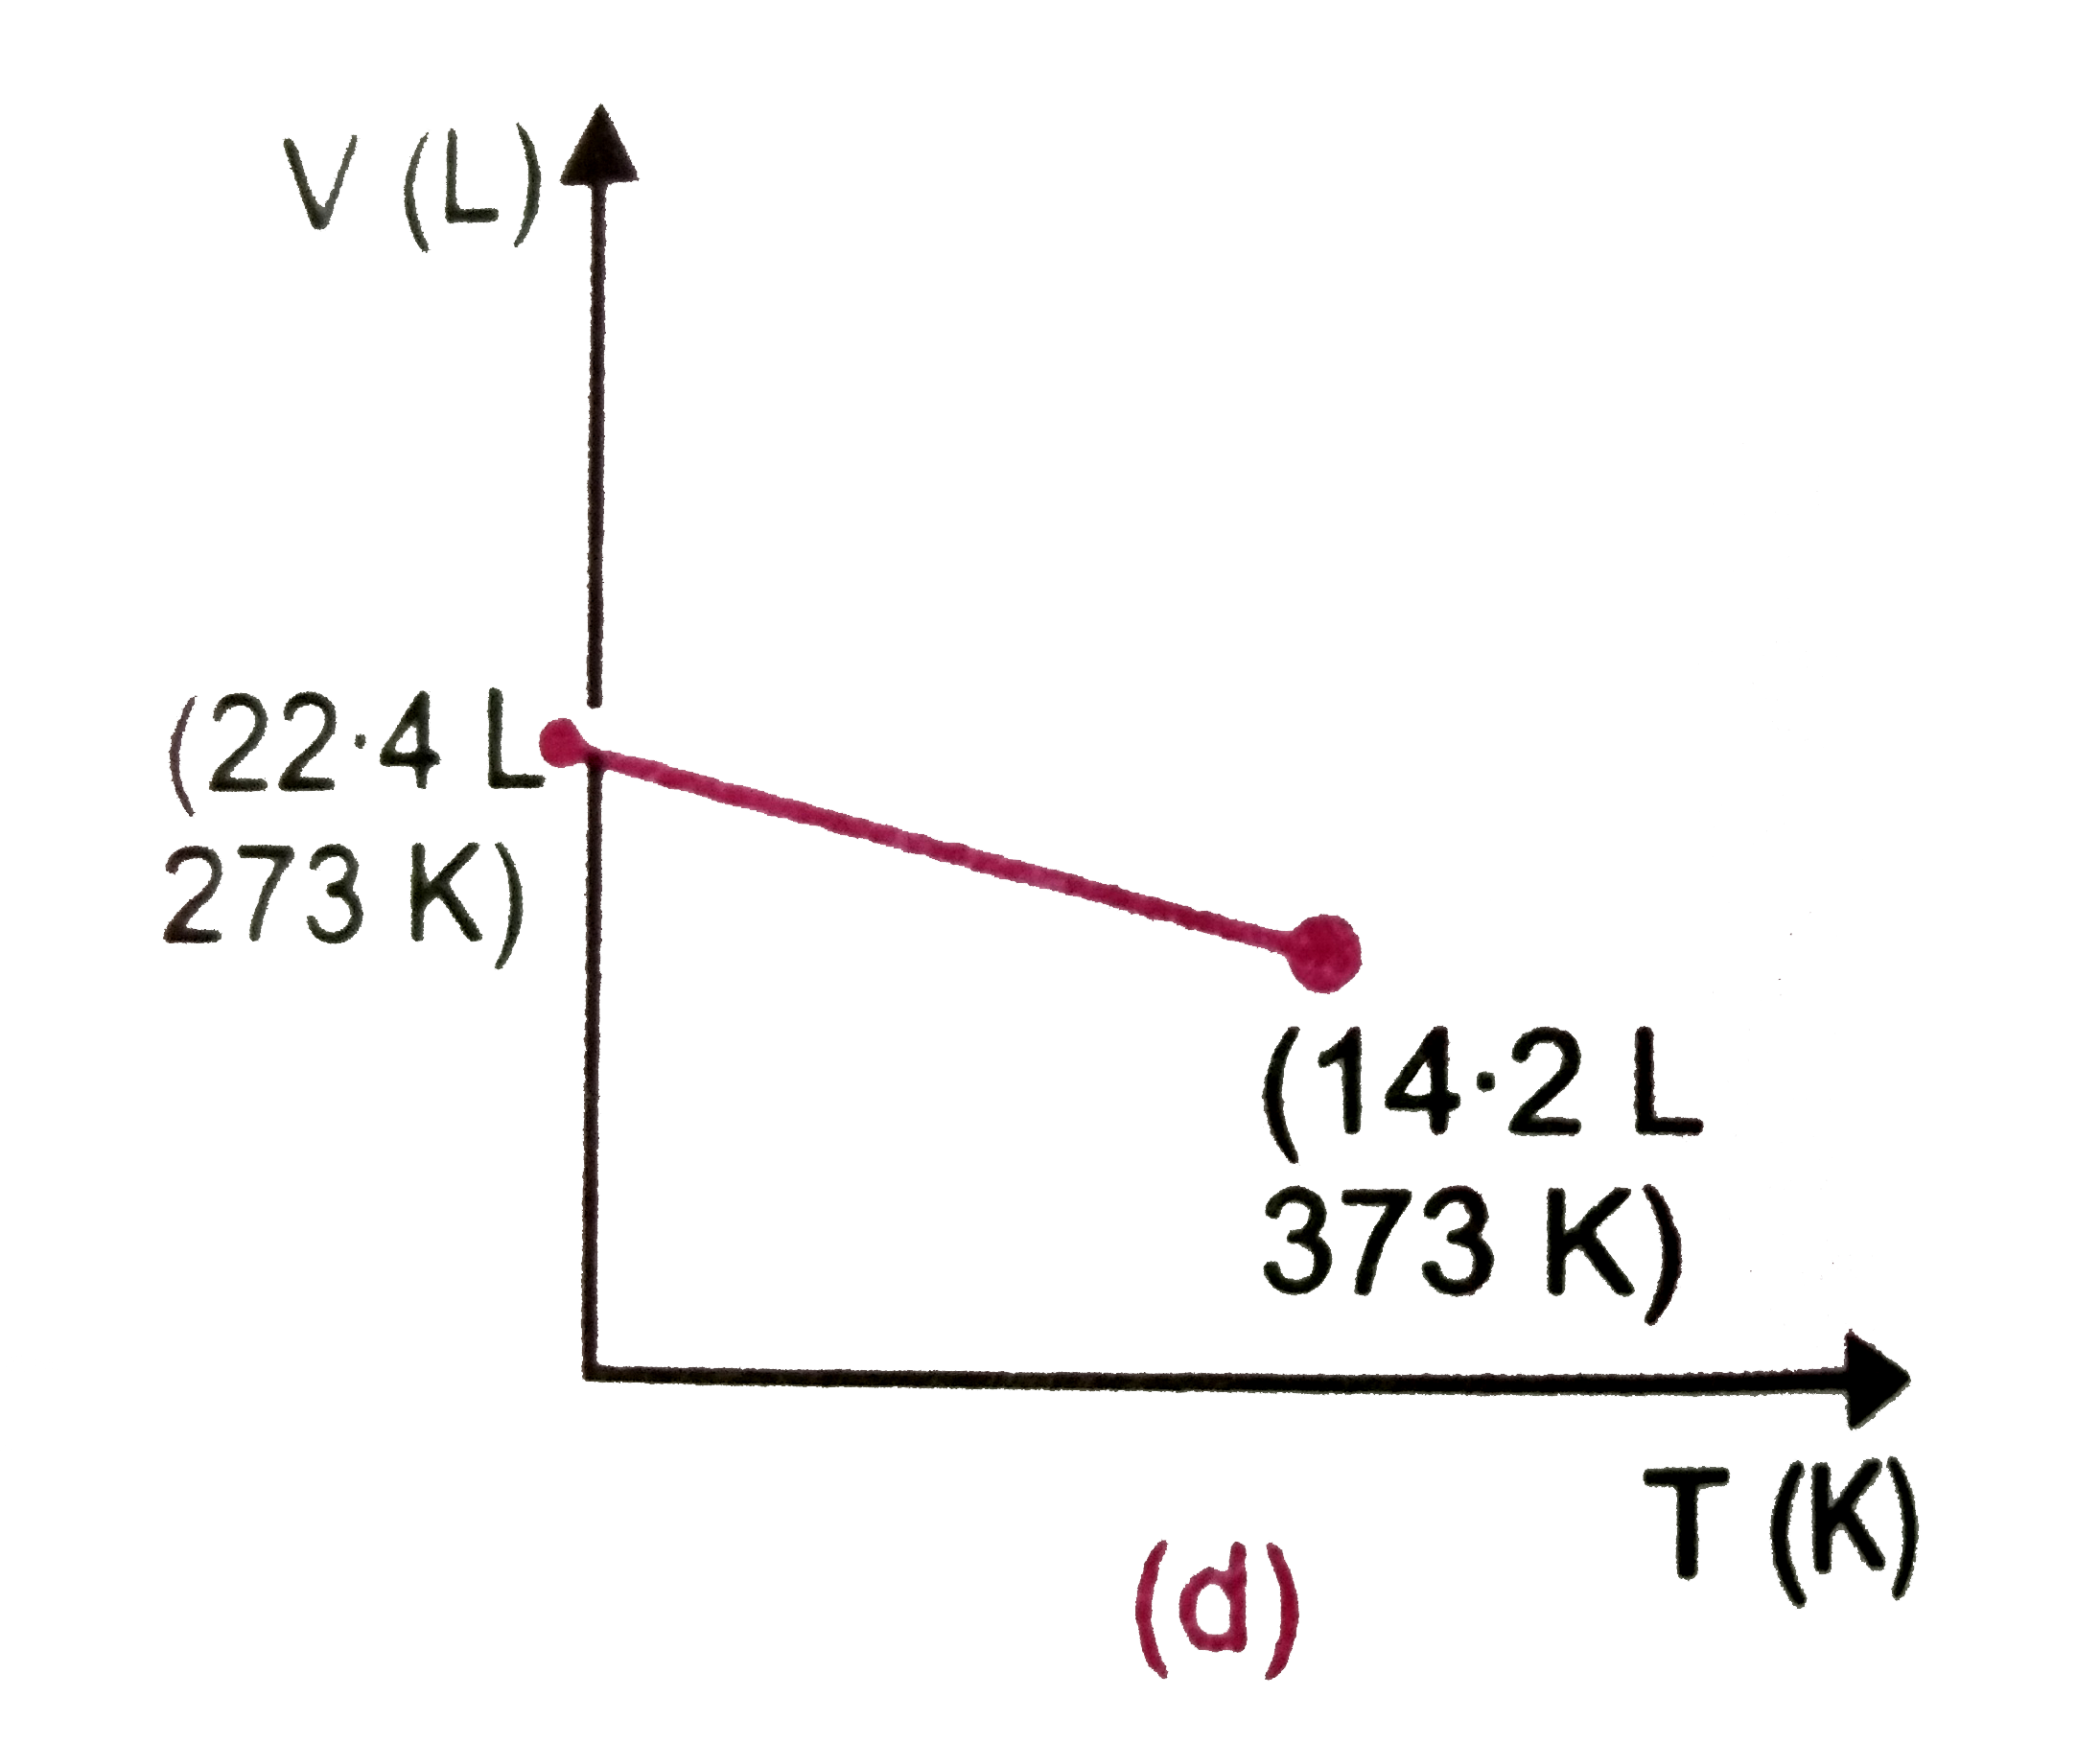
- Question 3 - Select One
Which of the following volume (V) temperature (T) plots represents the behaviour of one mole of an ideal gas at one atmospheric pressure:
A B
B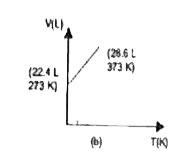 C
C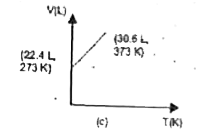 D
D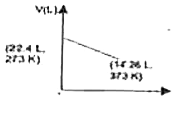
Which of the following volume-temperature (V−I) plots represents the behaviour of 1mole of an ideal gas at the atmospheric pressure?
View SolutionWhich one of the following volume (V)- temperature (T) plots represents the behaviour of one mole of an ideal gas at one atmosphere?
View SolutionThe graph that does represent the behaviour of an ideal gas is :
View SolutionWhich of the following graphs represent the behaviour of an ideal gas ?
View SolutionWhich of the following plots represents the behavior of an ideal binary liquid solution ?
View Solution

