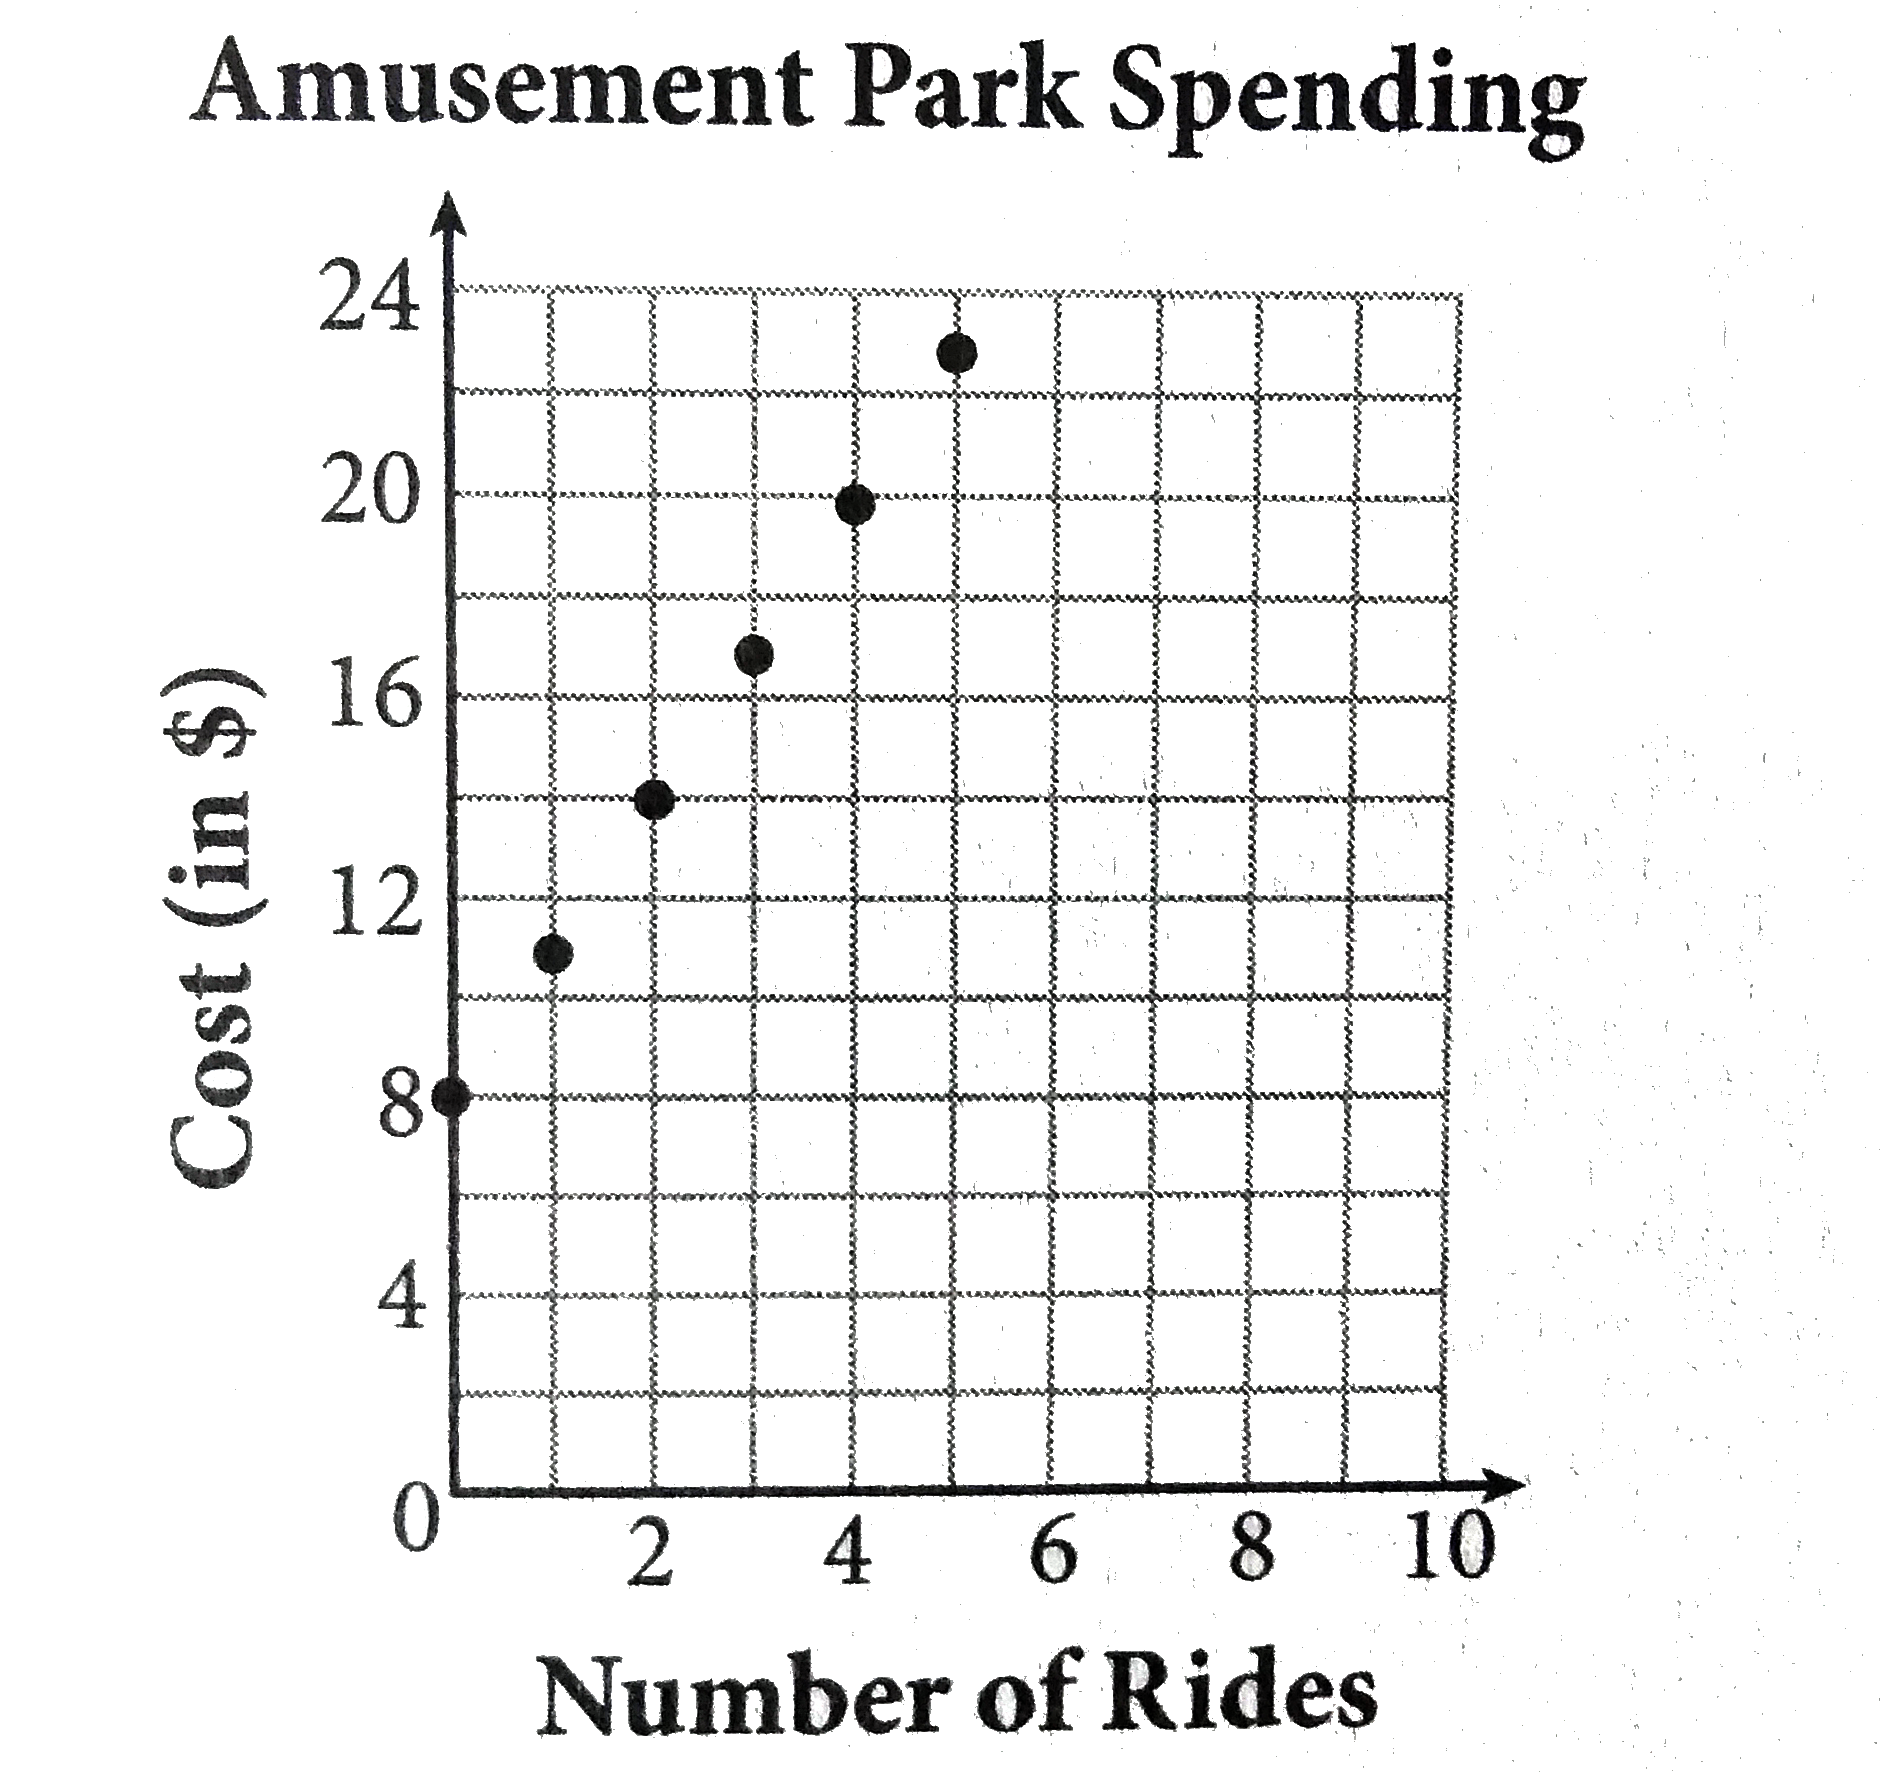
The maximum value of the data shown in the scatterplot above occurs at x=25. It the data is modeled using a quadratic regression and the correlation coefficient is 1.0 (the fit is exact), then what is the y-value when x=35 ?
A
10
B
15
C
22
D
27
Text Solution
The correct Answer is:D
Because the quadratic regression is an exact fit of the data, you can treat the data points as a quadratic function.
The graph of quadratic function is symmetric with respect to its axis of symmetry, which passes through the x-value of the vertex or the maximum (or minimum) of the function. The question tells you the maximum occurs at x=25, which makes it the line of symmetry. Because 35 is 35−25=10 units to the right of the axis of symmetry, you know that the y-value will be the same as the point that is 10 units to the left of the axis of symmetry, which is x=25−10=15. Find the corresponding y-value in the table: 27. Therefore (D) is correct.
|
Topper's Solved these Questions
- QUADRATICSBOOK - KAPLANCHAPTER - QUADRATICSEXERCISE - SOLVING QUADRATICS BY FACTORING
1 Videos
- QUADRATICSBOOK - KAPLANCHAPTER - QUADRATICSEXERCISE - CLASSIC QUADRATICS
1 Videos
- QUADRATICSBOOK - KAPLANCHAPTER - QUADRATICSEXERCISE - SYSTEMS OF QUADRATIC AND LINEAR EQUATIONS
1 Videos
- PAIRED PASSAGES AND PRIMARY SOURCE PASSAGES BOOK - KAPLANCHAPTER - PAIRED PASSAGES AND PRIMARY SOURCE PASSAGES EXERCISE - HOW MUCH HAVE YOU LEARNED
11 Videos
- SAT MATH: TIMING ANS SECTION MANAGEMENT STRATEGIESBOOK - KAPLANCHAPTER - SAT MATH: TIMING ANS SECTION MANAGEMENT STRATEGIESEXERCISE - TRY ON YOU OWN
5 Videos
Similar Questions
Knowledge Check
The mode of the following data is 36. What is the value of x?
 A11B15C13D12
If the regression equation of y x is given by x+ y =8 , then estimate the value of y when x is 3.5 .
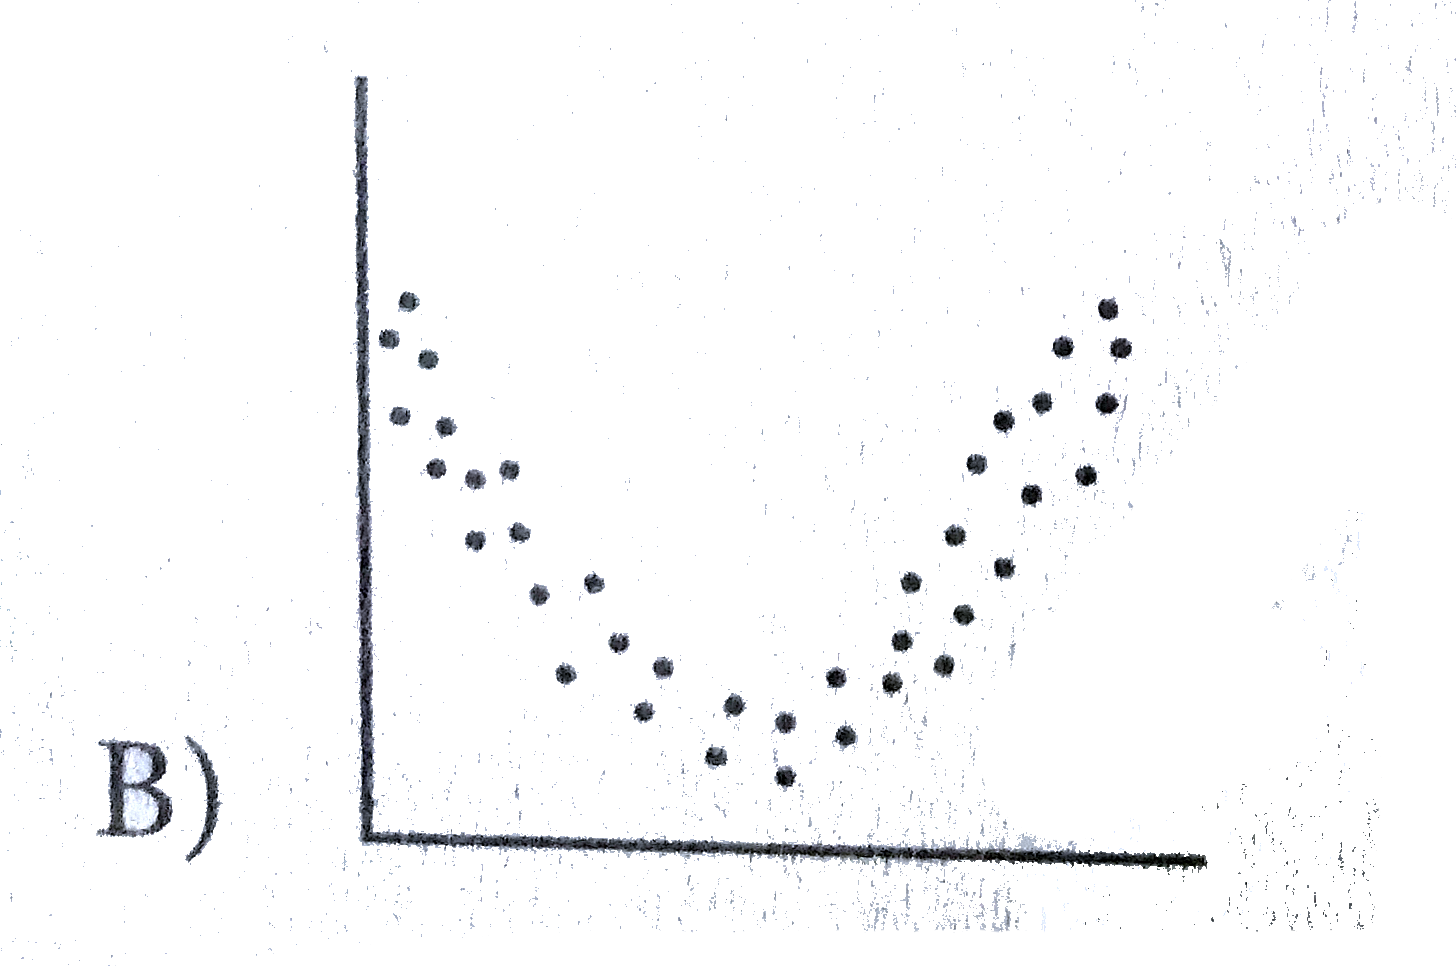
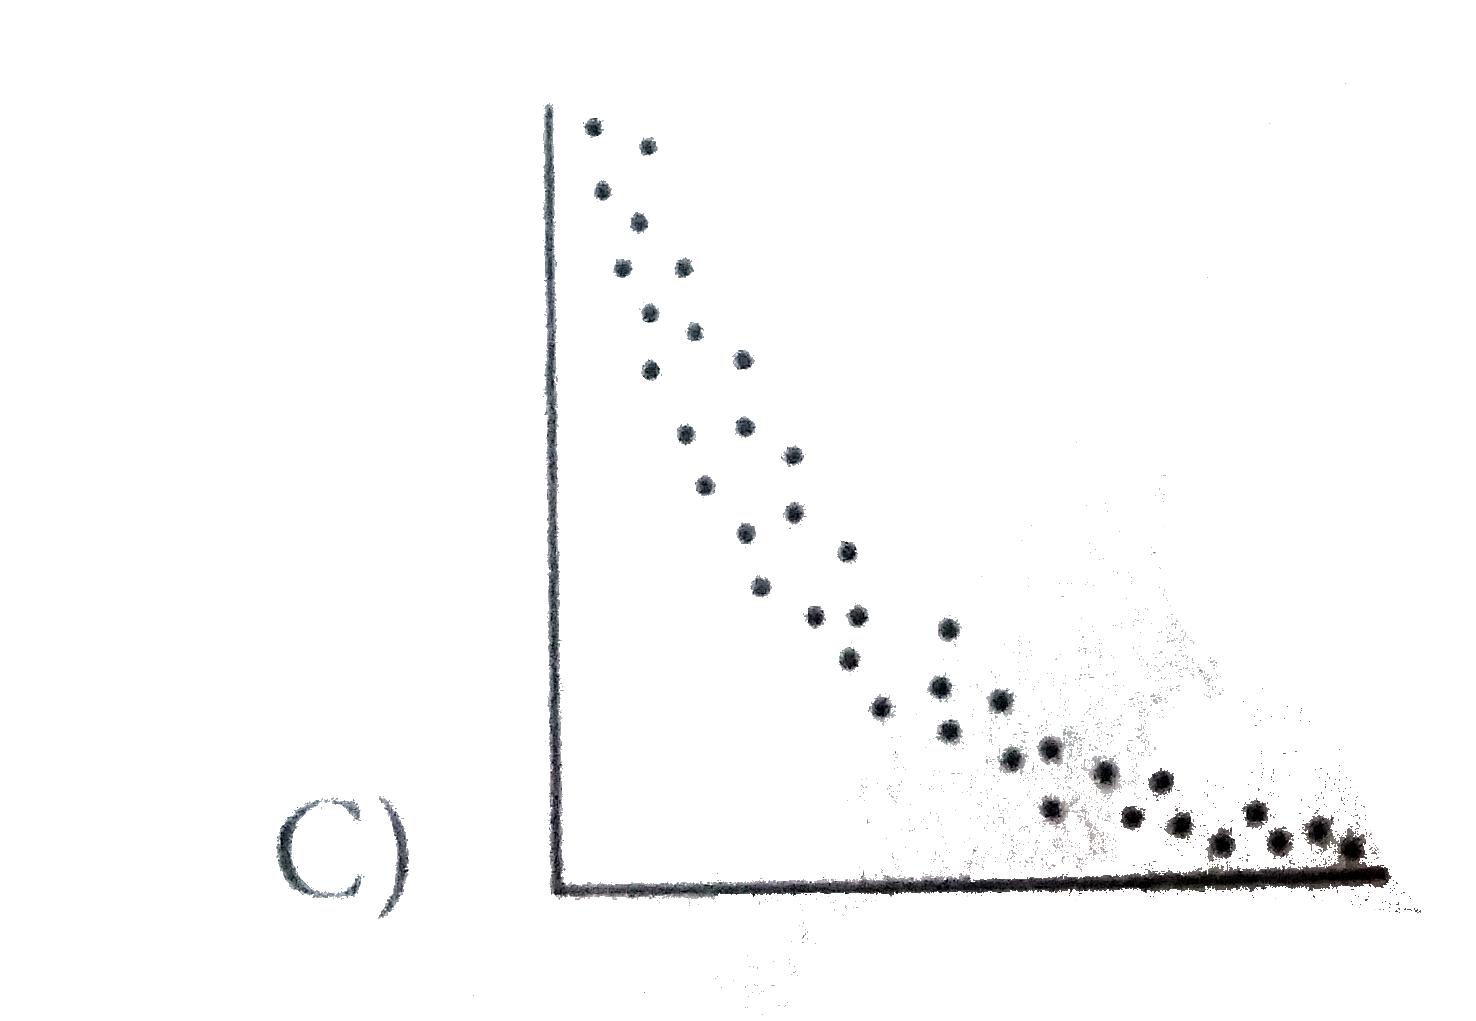
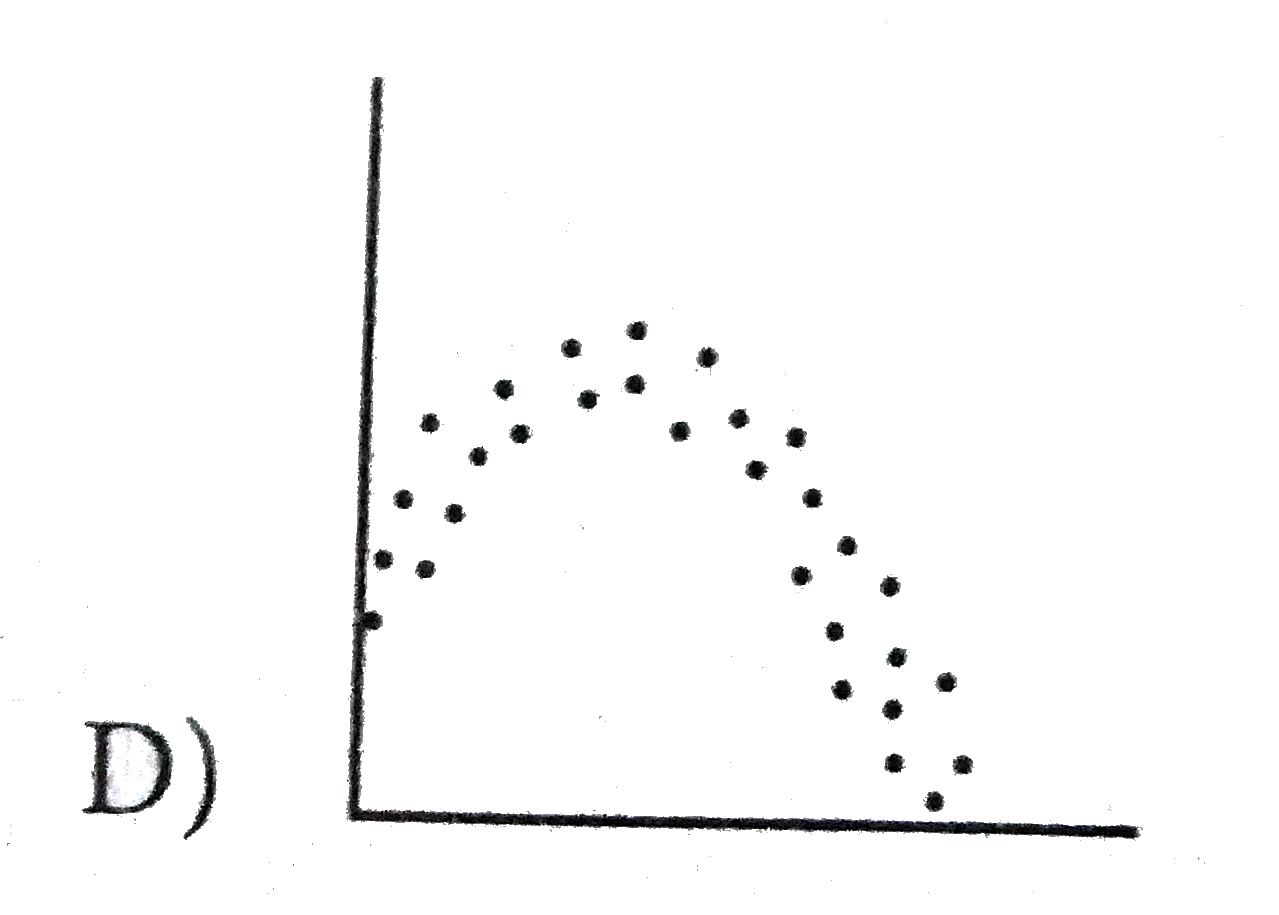
A3B5.5C4.5DNone of theseThe data in which of the following scatterplots would be best modeled by a quadratic function in which the x2 term has a negative coefficient?
A B
B C
C D
D
The two lines of regressions are 4x+2y−3=0and3x+6y+5=0. Find the correlation coefficient between xandy.
View SolutionIf the correlation coefficient between x and y is 0.6, covariance is 27 and variance of y is 25, then what is the variance of x?
View SolutionIf the regression coefficient of Yon X is-6 and the correlation coefficient between X and Y is -1/2. then the regression coefficient od X on Y would be
View SolutionIf the coefficient of correlation between x and y os 0.6, covariance is 27 and variance of y is 25, then what is the variance x?
View SolutionIf the covariance between x and y is 30, variance of x is 25 and variance of y is 144, then what is the correlation coefficient?
View Solution

