Choose the correct P-V graph of an ideal gas for the given V-T graph
 Solution in Gujrati


The correct Answer is:A
P is constant in given graph of V→T for ideal gas.
∴Inx→y process V∝T and for constant V, y→z
∴ Option (A) satisfies both the conditions
Topper's Solved these Questions
- QUESTION ASKED IN NEET -2019 BOOK - KUMAR PRAKASHANCHAPTER - QUESTION ASKED IN NEET -2019 EXERCISE - MULTIPLE CHOICE QUESTIONS
9 Videos
- SYSTEMS OF PARTICLES AND ROTATIONAL MOTIONBOOK - KUMAR PRAKASHANCHAPTER - SYSTEMS OF PARTICLES AND ROTATIONAL MOTIONEXERCISE - SECTION-F (SECTION-D) QUESTIONS PAPER
1 Videos
Similar Questions
When a block of mass M is suspended by a long wire of length L, the length of the wire becomes (L+l). The elastic potential energy stored in the extended wire is:
View SolutionA rope of negligible mass is wound round a hollow cylinder of mass 3 kg and radius 40 cm. What is the angular acceleration of the cylinder if the rope is pulled with a force of 30 N? What is the linear acceleration of the rope? Assume that there is no slipping.
View SolutionStraight line on (p - T) graph for an ideal gas represents isochoric process.
If p∝T,V=constant.
View SolutionOn the P−T graph of an ideal gas, choose the correct option(s):
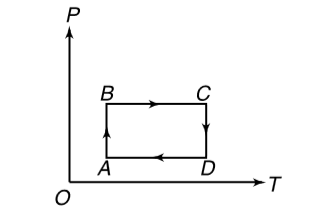
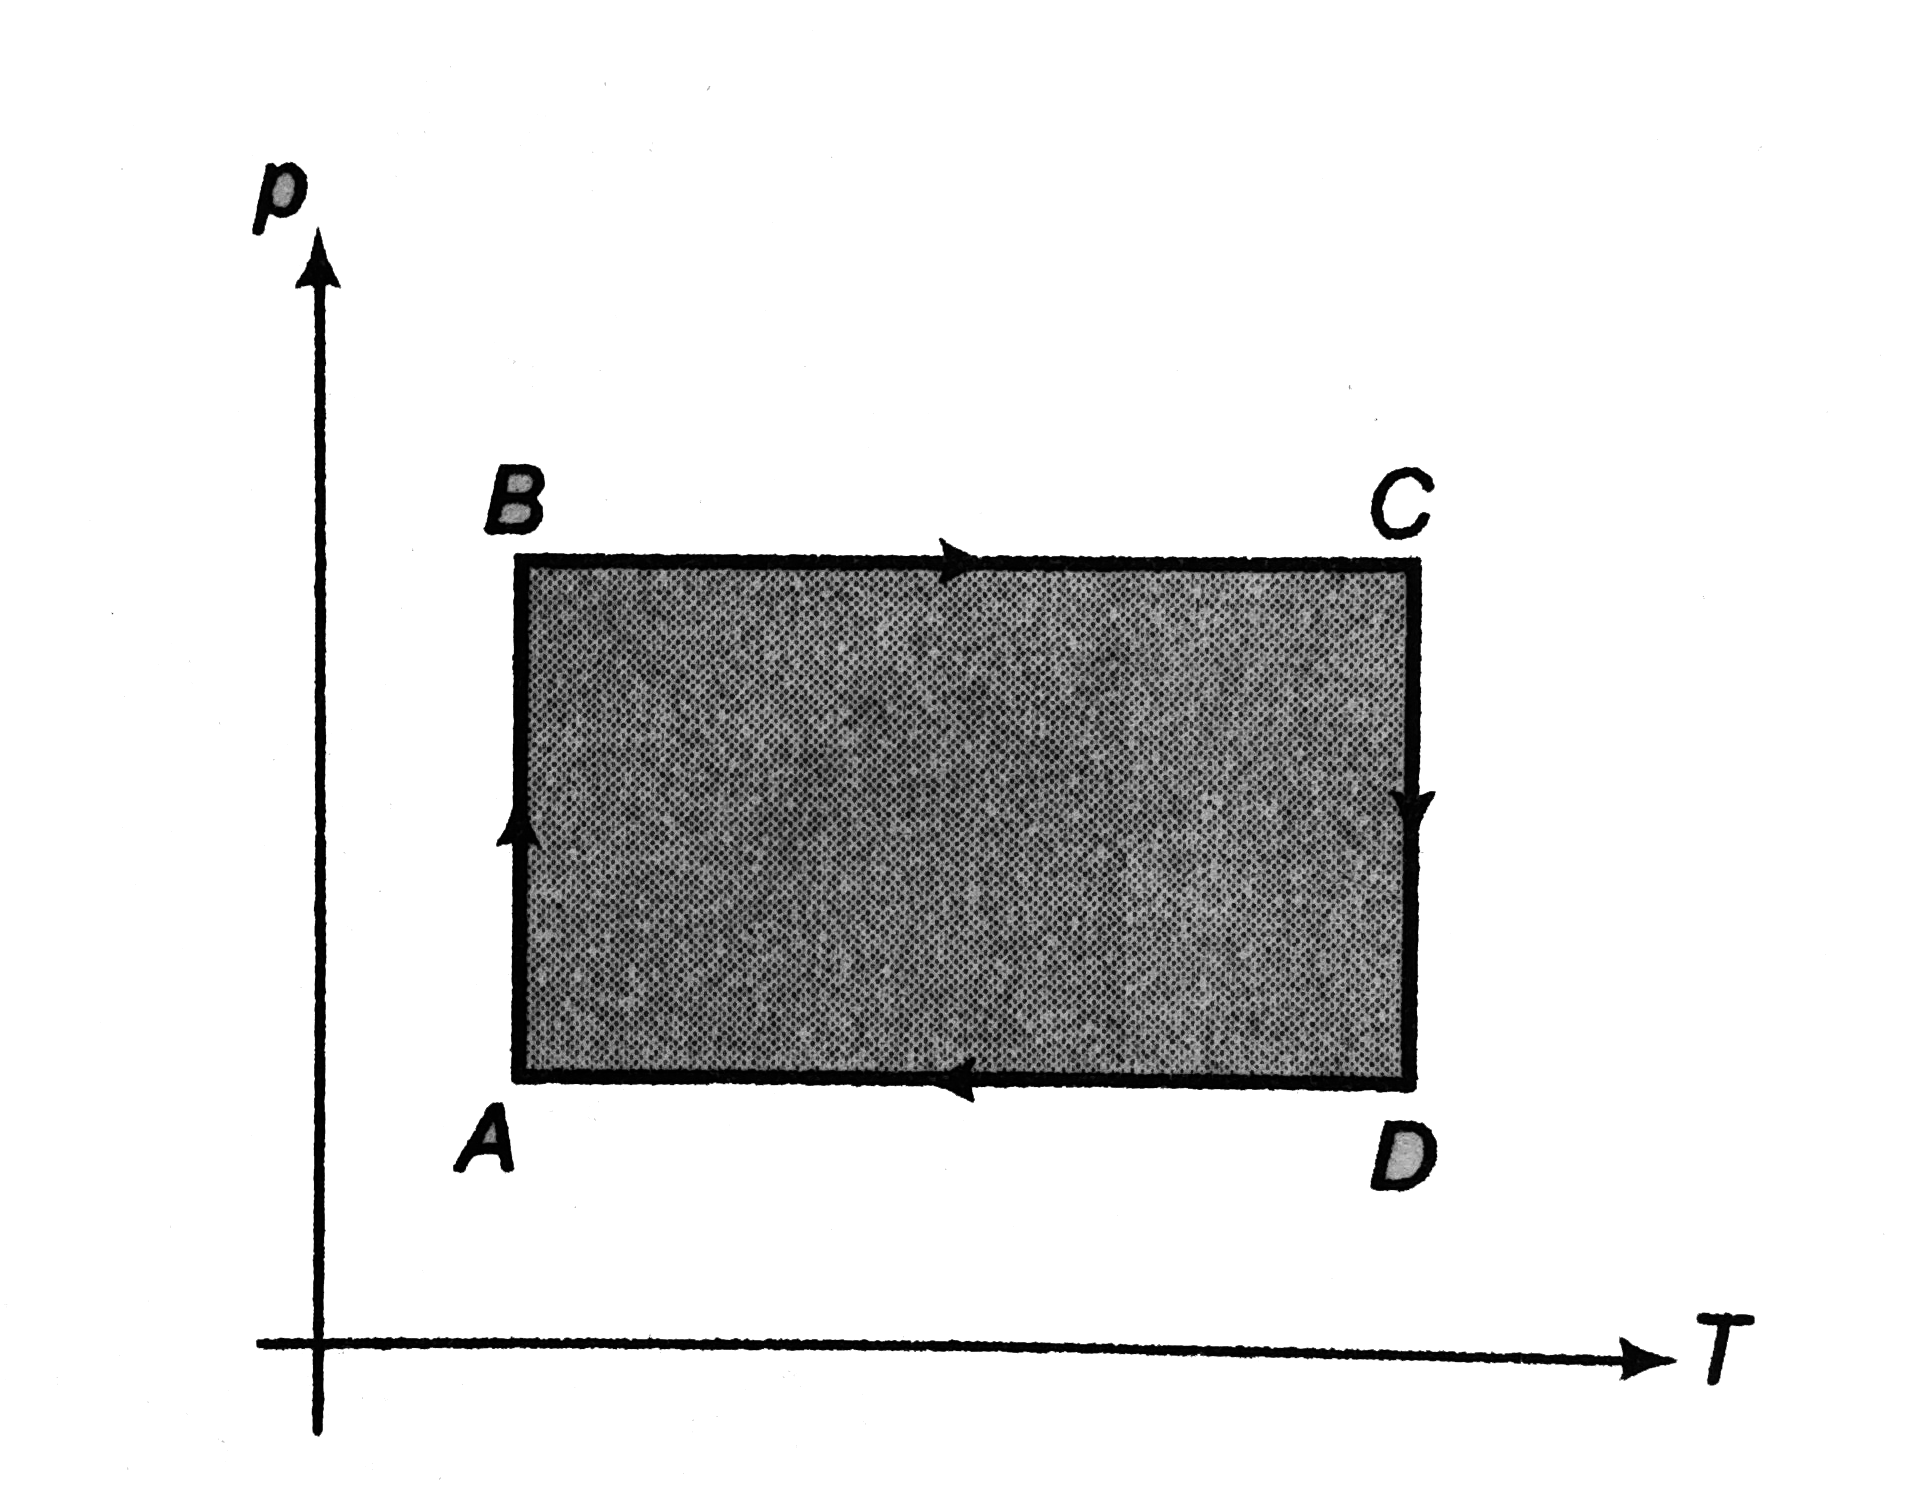
View SolutionAn ideal gas undergoes a cyclic process A→B→C→D for which P – T graph is as shown. Draw P – V and V – T of graph to represent the same process.
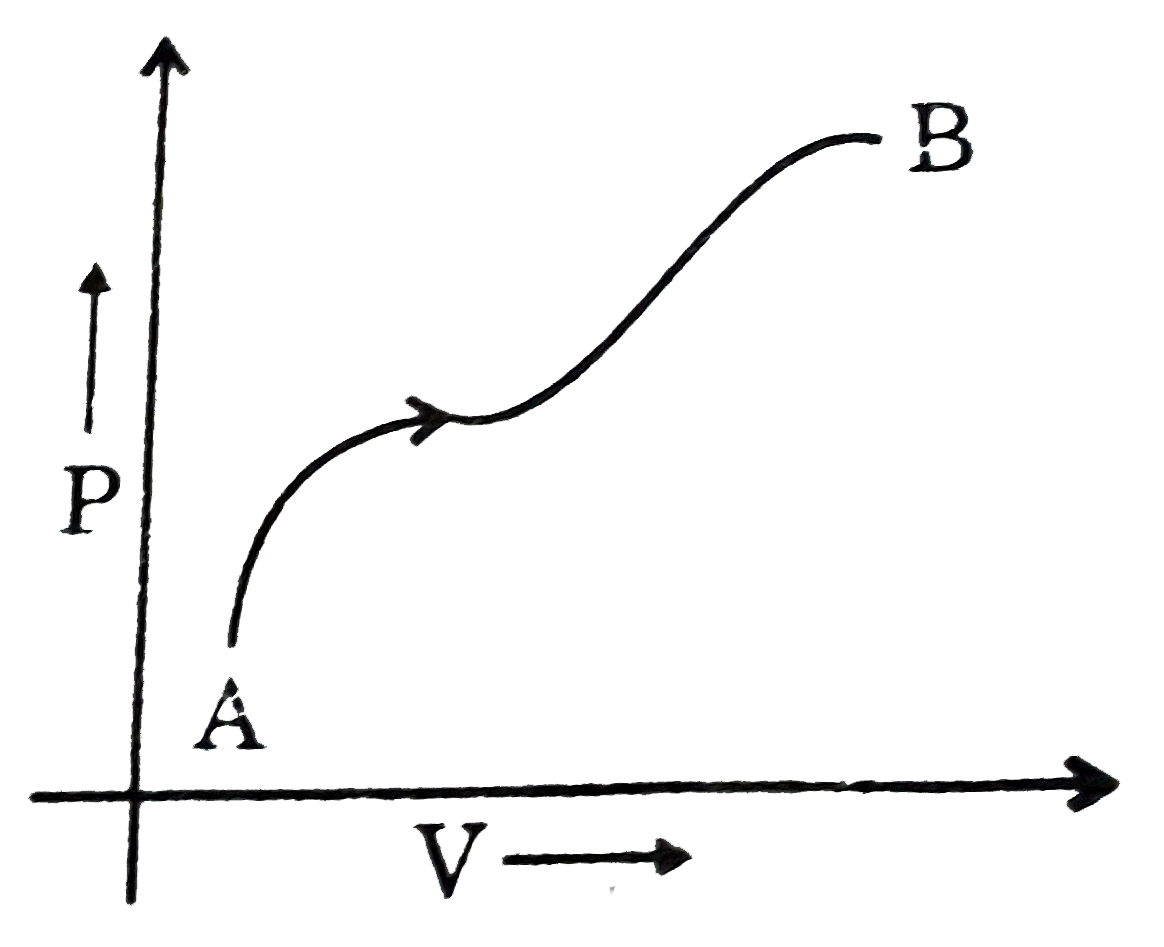
View SolutionThe graph given below shows the P-V plot for a process on an ideal gas. Select the correct statement.
View SolutionConsider the following (P-T) graph for a fixed mass of gas: Correct P-V graph as:
View SolutionPlot P -V, V-T graph corresponding to the P-T graph for an ideal has shown in figure. Explain your answers.
View SolutionFor the given P-V graph for an ideal gas, chose the correct V-T graph. Process BC is adiabatic.
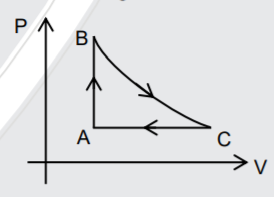
View SolutionFor the given P-V graph for an ideal gas, chose the correct V-T graph. Process BC is adiabatic.
View SolutionPlot P-V, V-T and p-T graph correspongidng to the P-T graph for an ideal gas shown in figure.
View Solutionकिसी गैस का P- V ग्राफ दिया गया है। निम्न में से कौन-सा कथन सही है?
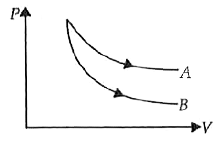
View Solutionकिसी आदर्श गैस के लिए चित्र में दर्शाए गए P- V ग्राफ पर विचार करें।
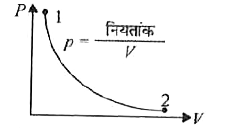
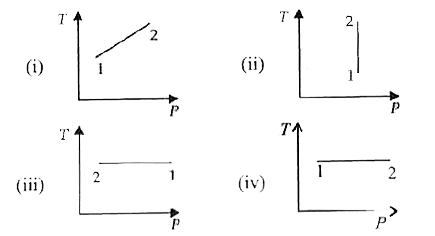
निम्न ग्राफों में से, कौन-सा T-P ग्राफ को प्रदर्शित करता है?
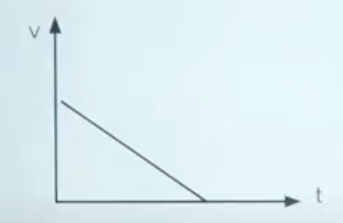
View SolutionFrom given v-t graph identify correct a-t graph
View SolutionPlot (p - V),(V - T) and (ρ - T) graph corresponding to the (p - T) graph for an ideal gas shown in figure.
 .
.
View Solution
