Given below are the seats won by different political parties in thepolling outcome of a state assembly elections:

Draw a bar graph to represent the polling results.
Step by step video & image solution for Given below are the seats won by different political parties in thepolling outcome of a state assembly elections: Draw a bar graph to represent the polling results. by Maths experts to help you in doubts & scoring excellent marks in Class 9 exams.
Topper's Solved these Questions
- BOOK - RS AGGARWALCHAPTER - BAR GRAPH, HISTOGRAM AND FREQUENCY POLYGONEXERCISE - EXERCISE 17B16videos
BAR GRAPH, HISTOGRAM AND FREQUENCY POLYGON
- BOOK - RS AGGARWALCHAPTER - BAR GRAPH, HISTOGRAM AND FREQUENCY POLYGONEXERCISE - EXAMPLE11videos
BAR GRAPH, HISTOGRAM AND FREQUENCY POLYGON
- BOOK - RS AGGARWALCHAPTER - AREAS OF TRIANGLES AND QUADRILATERALSEXERCISE - Multiple Choice Questions (Mcq)16videos
AREAS OF TRIANGLES AND QUADRILATERALS
- BOOK - RS AGGARWALCHAPTER - CIRCLES EXERCISE - MULTIPLE CHOICE QUESTION(MCQ)37videos
CIRCLES
Similar Questions
Given below are the seats won by different political parties in the polling outcome of a state assembly elections

(i) Draw a bar graph to represent the polling results.
(ii) Which political party won the maximum number of seats?View SolutionGiven below are the seats won by different political parties in the polling outcome of a state assembly elections: (i) Draw a bar graph to represent the polling result
 View Solution
Given below are the seats won by different political parties in the polling outcome of a state assembly elections :

Which political party won the minimum number of seats?View SolutionGiven below are the seats won by different political parties in the polling outcome of a state assembly elections :

Which political party won the maximum number of seats?View SolutionThe income of a family i different year are as follows. Draw a bar graph to represent the data
View SolutionThe approximate speeds of some objects are given below. Draw a bar graph to represent them:

View SolutionWrite some of the successful slogans given by different political parties in various elections.
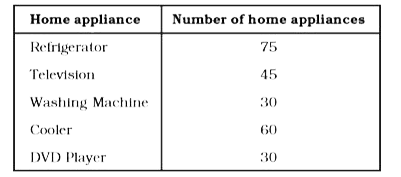
View SolutionHome appliances sold by a shop in one month are given as below:

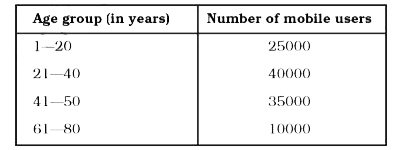
Draw a bar graph to represent the above information.View SolutionNumber of mobile phone users in various age groups in a city is listed below:

Draw a bar graph to represent the above information.View SolutionThe percentage of expenditure on different heads in a budget of a state is as shown below :

Draw a pie diagram to represent the information .View Solution

