Show graphically the variation ofXL with frequency f.Solution in Marathi
Step by step video & image solution for Show graphically the variation of X_L with frequency f. by Physics experts to help you in doubts & scoring excellent marks in Class 12 exams.
Updated on:21/07/2023Topper's Solved these Questions
Similar Questions
A LCR series circuit has the impedance of 240 ohm. If R = 120Ω, find the power factor of the circuit.
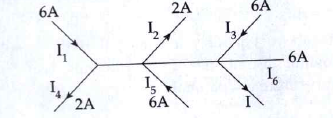
View Solution(1)In the following circuit, calculate the value of the current (I).

View SolutionShow graphically the temperature variation with time associated with a colling hot body.
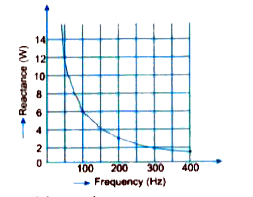
View SolutionThe figure shows the graphical variation of the reactance of a capacitor with frequency of ac source. (a) find the capacitance of the capacitor (b)an ideal inductor has the same reactance at 100 Hz frequency as the capacitor has the same frequency find the value of the inductor. (c) draw the graph showing the variation of the reactance of this inductor with frequency
View SolutionShow graphically variation of AC with time. Explain the nature of the graph.
View SolutionIn given figure three curves a, b and c shows variation of resistance, (R) capacitive reactance (X_c) and inductive (X_L) reactance with frequency. Identify the respective curves for these.
View SolutionRepresent the variation of kinetic energy of photoelectrons with respect to frequency graphically.
View SolutionHow does the reactance of the device X vary with frequency of the ac? Show this variation graphically?
View SolutionWhich of the following represents the variation of inductive reactance (XL) with the frequency of voltage source (υ) ?
View SolutionThe figure shows the graphical variation of the reactance of a capacitor with frequency of ac source. (a) find the capacitance of the capacitor (b)an ideal inductor has the same reactance at 100 Hz frequency as the capacitor has the same frequency find the value of the inductor. (c) draw the graph showing the variation of the reactance of this inductor with frequency
View SolutionThe figure shows the graphical variation of the rectance of a capacitor with frequency of acsource.

(a) Find the capacitance of the capacitor.
(b) An ideal inductor has the same reactance at 100 Hz frequency as the capacitor has at the same frequency. Find the value of inductance of the inductor.
(c ) Draw the graph showing the variation of the rectance of this inductor with frequency.
View SolutionFollowing graphs show the variation of stopping potential corresponding to the frequency of incident radiation (F) for a given metal. The correct variation is shown in graph (V_0=" Threshold frequency")
View SolutionDraw a graphical representation of variation of current amplitude (i_omega) with frequency omega
View SolutionShow graphically, the variation of inductive reactance with frequency. (Write the answer only).
View SolutionIndicate graphically, the variation of reactance of an inductor with frequency.
View Solution
