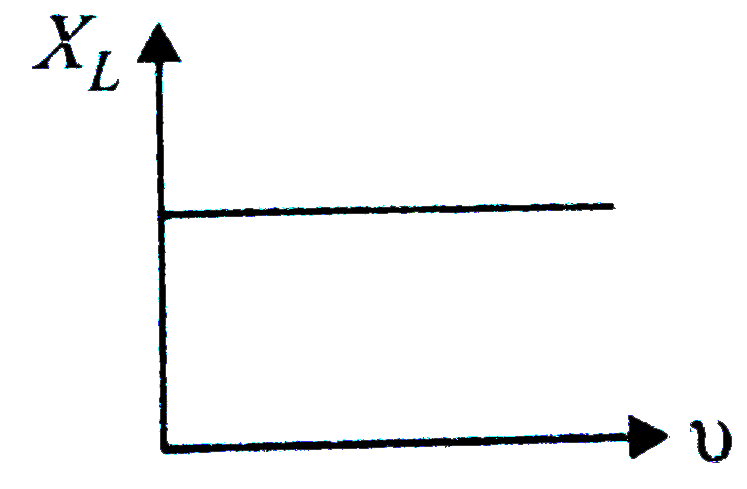
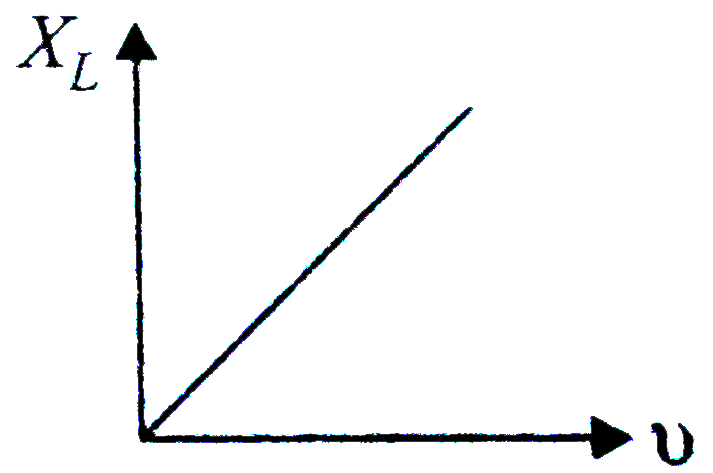
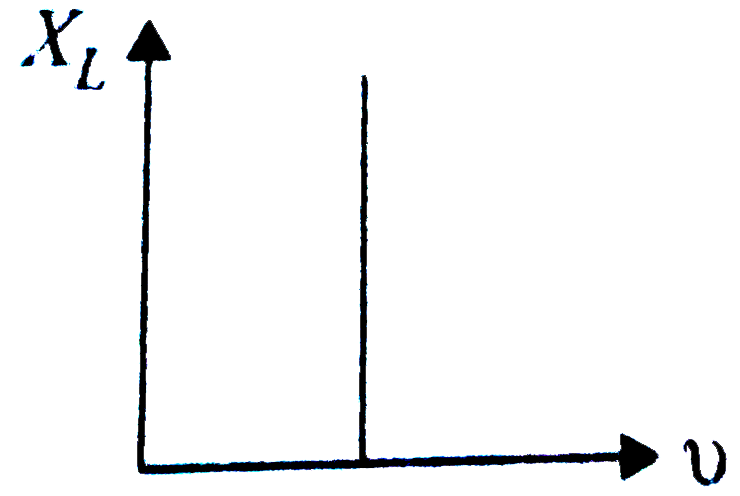
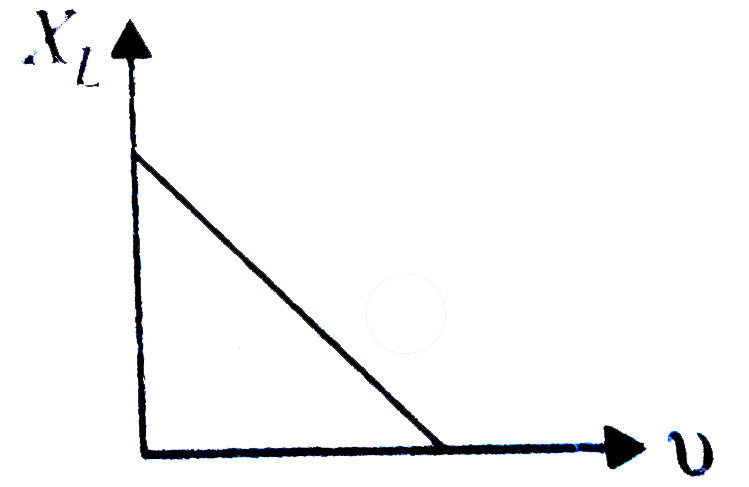
Show graphically, the variation of inductive reactance with frequency. (Write the answer only.)
As, Inductive reactance,
XL=ωL=2πfL
So, XL∝f
∴ Graph between XL and f will be a straight line.

Similar Questions
Explain the term 'inductive reactance'.Show graphically the variation of inductive reactance with frequency of the applied alternating voltage.
An a.c. voltage E=E0sinωt is applied across a pure inductor L.Show mathematically that the current flowing through it lags behind the applied voltage by a phase angle of π/2.
View SolutionExplain the term 'inductive reactance'.Show graphically the variation of inductive reactance with frequency of the applied alternating voltage.
An a.c. voltage E=E0sinωt is applied across a pure inductor L.Show mathematically that the current flowing through it lags behind the applied voltage by a phase angle of π/2.
View Solution
Knowledge Check
The graph between inductive reactance and frequency is
AparabolaBstraight lineChyperbolaDan arc of a circleWhich of the following graphs represent the correct variation of inductive reactance XL with frequency υ?
A B
B C
C D
D
Which of the following graphs represent the correct variation of inductive reactance XL with frequency υ?
A B
B C
C D
D
Explain the term 'capacitive reactance'.Show graphically the variation of capacitive reactance with frequency of the applied alternating voltage.
An a.c. voltage E=E0sinωt is applied a across a pure capacitor C.Show mathematically that the current flowing through it leads the applied voltage by a phase angle of π/2
View SolutionExplain the term 'capacitive reactance'.Show graphically the variation of capacitive reactance with frequency of the applied alternating voltage.
An a.c. voltage E=E0sinωt is applied a across a pure capacitor C.Show mathematically that the current flowing through it leads the applied voltage by a phase angle of π/2
View SolutionSketch a graph showing the variation of capacitive reactance with the change in frequency of the a.c. source.
View SolutionHow inductive reactance depends on the frequency of AC ?
View SolutionThe figure shows the graphical variation of the reactance of a capacitor with frequency of ac source. (a) find the capacitance of the capacitor (b)an ideal inductor has the same reactance at 100 Hz frequency as the capacitor has the same frequency find the value of the inductor. (c) draw the graph showing the variation of the reactance of this inductor with frequency

View Solution
