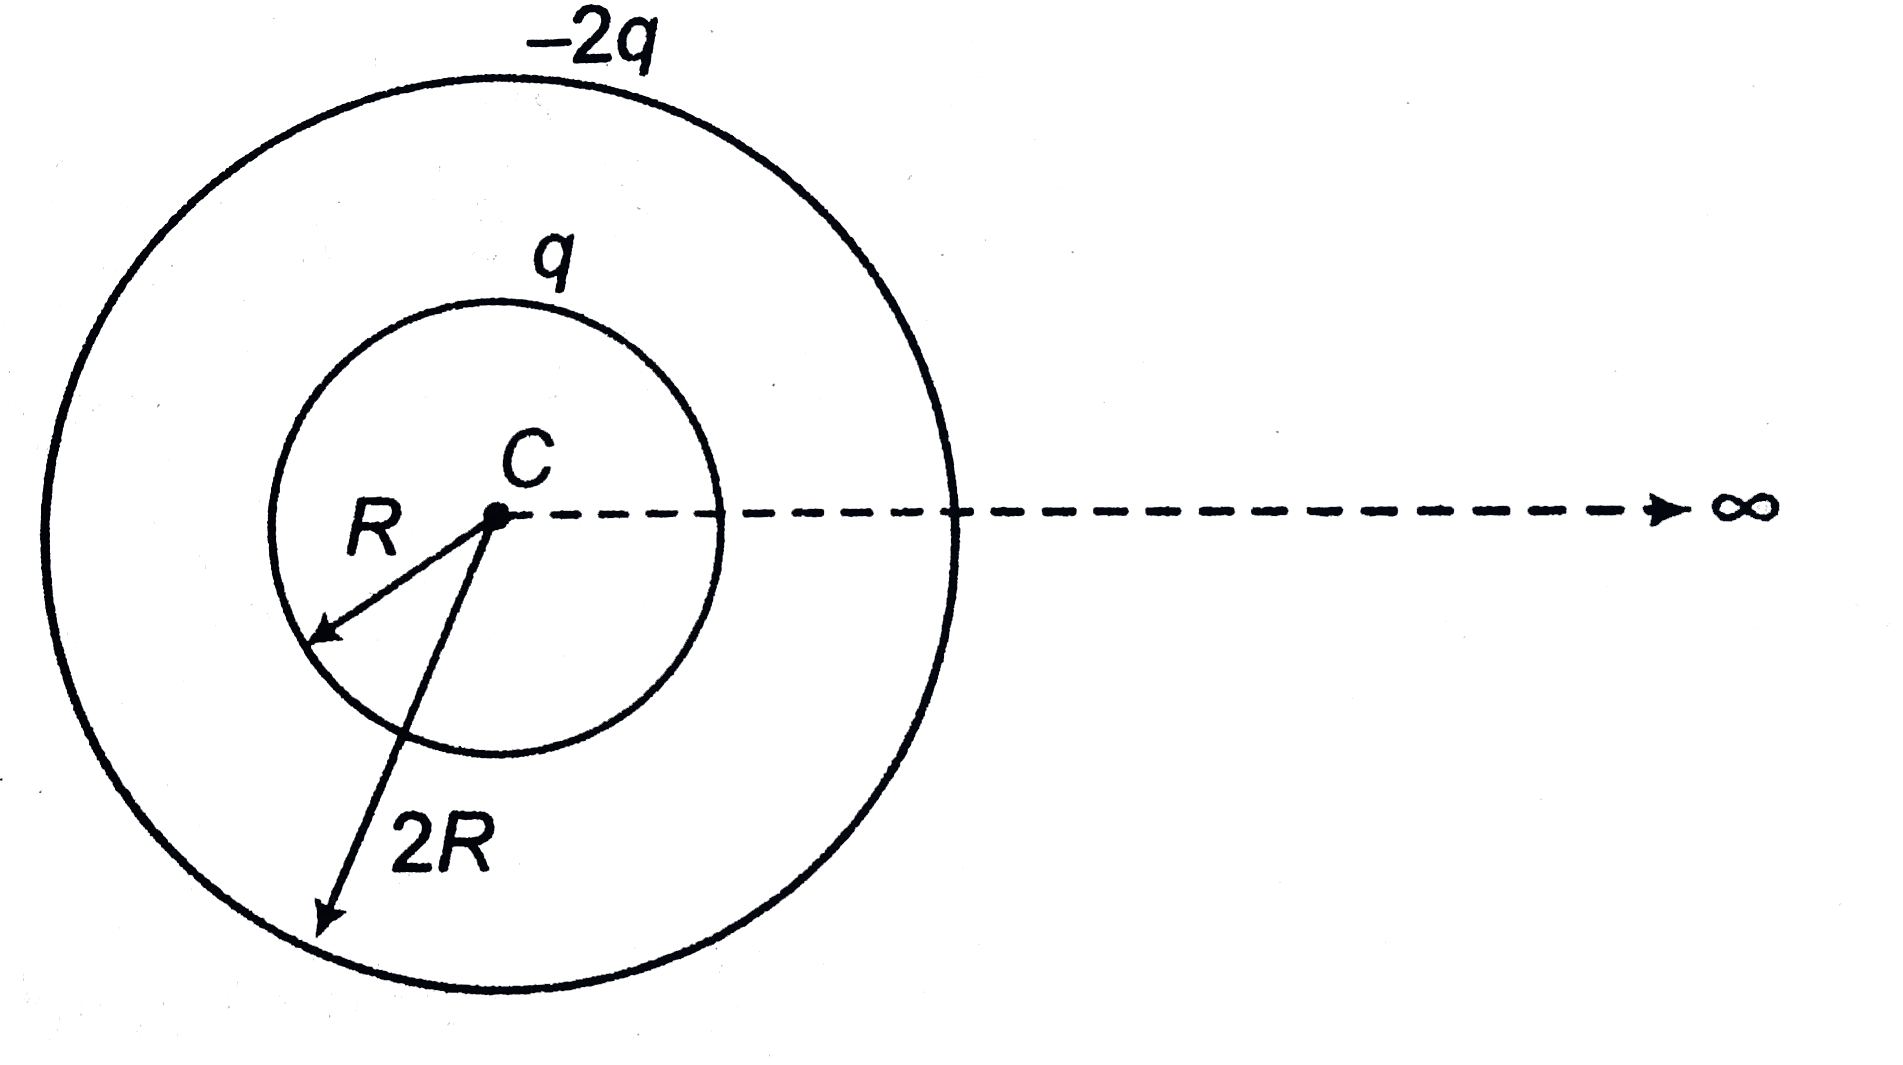
Draw E−r and V−r graphs due to two point charges +q and −2q kept at some along the line joining these two charges.
To solve the problem of drawing the E−r (Electric Field vs. Distance) and V−r (Electric Potential vs. Distance) graphs due to two point charges +q and −2q kept at some distance along the line joining these two charges, we will follow these steps:
Step 1: Understand the Configuration
We have two point charges:
- Charge 1: +q
- Charge 2: −2q
These charges are placed at a distance apart. We will analyze the electric field and potential at different points along the line joining the two charges.
Step 2: Identify Regions
We can categorize the space into three regions based on the positions of the charges:
1. Region 1: To the left of charge +q
2. Region 2: Between charge +q and charge −2q
3. Region 3: To the right of charge −2q
Step 3: Electric Field (E) Calculation
The electric field due to a point charge is given by:
\( E = \frac{1}{4\pi\epsilon_0} \frac{Q}{r^2} \)
- Region 1 (Left of +q):
- The electric field due to +q is directed away from the charge (positive).
- The electric field due to −2q is directed towards the charge (negative).
As we move away from +q, the electric field decreases and approaches 0 as \( r \to \infty \).
- Region 2 (Between +q and −2q):
- The electric field will be a combination of the fields due to both charges. The field due to +q is positive and directed away from it, while the field due to −2q is negative and directed towards it.
At some point between the charges, the fields will cancel each other out, leading to a point of zero electric field.
- Region 3 (Right of −2q):
- The electric field due to −2q is directed towards it (negative), and the field due to +q is directed away from it (positive).
As we move away from −2q, the electric field decreases and approaches 0 as \( r \to \infty \).
Step 4: Electric Potential (V) Calculation
The electric potential due to a point charge is given by:
\( V = \frac{1}{4\pi\epsilon_0} \frac{Q}{r} \)
- Region 1:
- The potential due to +q is positive and increases as we approach the charge, while the potential due to −2q is negative and decreases as we approach it.
- Region 2:
- The potential will be a combination of both charges. As we approach +q, the potential increases, and as we approach −2q, the potential decreases.
- Region 3:
- The potential due to −2q becomes more negative as we approach it, while the potential due to +q remains positive and decreases as we move away from −2q.
Step 5: Graphing E vs. r and V vs. r
Now we can plot the graphs:
1. E-r Graph:
- In Region 1, the electric field starts positive and decreases to 0.
- In Region 2, it goes to zero at some point and then becomes negative in Region 3, decreasing further as we move away from −2q.
2. V-r Graph:
- In Region 1, the potential starts high (positive) and decreases as we approach −2q.
- In Region 2, it crosses zero at some point and continues to decrease into the negative region in Region 3.
Final Graphs
- E-r Graph: Starts from positive, crosses zero, and goes negative.
- V-r Graph: Starts from positive, crosses zero, and goes negative.
We have two point charges:
- Charge 1: +q
- Charge 2: −2q
We can categorize the space into three regions based on the positions of the charges:
1. Region 1: To the left of charge +q
2. Region 2: Between charge +q and charge −2q
3. Region 3: To the right of charge −2q
The electric field due to a point charge is given by:
\( E = \frac{1}{4\pi\epsilon_0} \frac{Q}{r^2} \)
- The electric field due to +q is directed away from the charge (positive).
- The electric field due to −2q is directed towards the charge (negative).
As we move away from +q, the electric field decreases and approaches 0 as \( r \to \infty \).
- The electric field will be a combination of the fields due to both charges. The field due to +q is positive and directed away from it, while the field due to −2q is negative and directed towards it.
At some point between the charges, the fields will cancel each other out, leading to a point of zero electric field.
- The electric field due to −2q is directed towards it (negative), and the field due to +q is directed away from it (positive).
As we move away from −2q, the electric field decreases and approaches 0 as \( r \to \infty \).
The electric potential due to a point charge is given by:
\( V = \frac{1}{4\pi\epsilon_0} \frac{Q}{r} \)
- The potential due to +q is positive and increases as we approach the charge, while the potential due to −2q is negative and decreases as we approach it.
- The potential will be a combination of both charges. As we approach +q, the potential increases, and as we approach −2q, the potential decreases.
- The potential due to −2q becomes more negative as we approach it, while the potential due to +q remains positive and decreases as we move away from −2q.
Now we can plot the graphs:
- In Region 1, the electric field starts positive and decreases to 0.
- In Region 2, it goes to zero at some point and then becomes negative in Region 3, decreasing further as we move away from −2q.
- In Region 1, the potential starts high (positive) and decreases as we approach −2q.
- In Region 2, it crosses zero at some point and continues to decrease into the negative region in Region 3.
- E-r Graph: Starts from positive, crosses zero, and goes negative.
- V-r Graph: Starts from positive, crosses zero, and goes negative.
Topper's Solved these Questions
- BOOK - DC PANDEY ENGLISHCHAPTER - ELECTROSTATICSEXERCISE - Exercise 24.14videos
ELECTROSTATICS
- BOOK - DC PANDEY ENGLISHCHAPTER - ELECTROSTATICSEXERCISE - Exercise 24.29videos
ELECTROSTATICS
- BOOK - DC PANDEY ENGLISHCHAPTER - ELECTROSTATICSEXERCISE - Example Type 83videos
ELECTROSTATICS
- BOOK - DC PANDEY ENGLISHCHAPTER - ELECTROSTATIC POTENTIAL AND CAPACITORSEXERCISE - (C) Chapter exercises50videos
ELECTROSTATIC POTENTIAL AND CAPACITORS
- BOOK - DC PANDEY ENGLISHCHAPTER - GRAVITATIONEXERCISE - All Questions135videos
GRAVITATION
Similar Questions
Draw E-r and V-r graphs due to two charged spherical shells as shown in figure (along the line between C and ∝)
 View Solution
Two charges each having magnitude q and same polarity are fixed some distance apart.A point charge Q is kept on exactly middle of the line joining the two charges.Then equilibrium of Q is
View SolutionDraw E and V versus r on the same graph for a point charge.
View SolutionIf Two charges +qand+4q are separated by a distance d and a point charge Q is placed on the line joining the above two charges and in between them such that all charges are in equilibrium. Then the charge Q and it's position are
View SolutionTwo charge +aq and -q are kept apart. Then , at any point on the right bisector of line joining the two charge
View SolutionTwo point charges +4q and +q are placed 30cm apart. At what point on the line joining them is the electric field zero
View SolutionTwo idential point charges Q are kept at a distance r from each other. A third point charge is placed on the line joing the above two charges such that all the three charges are in equilibrium. The third charge
(a) should be of magnitude q=………..
(b) should be of sign .......
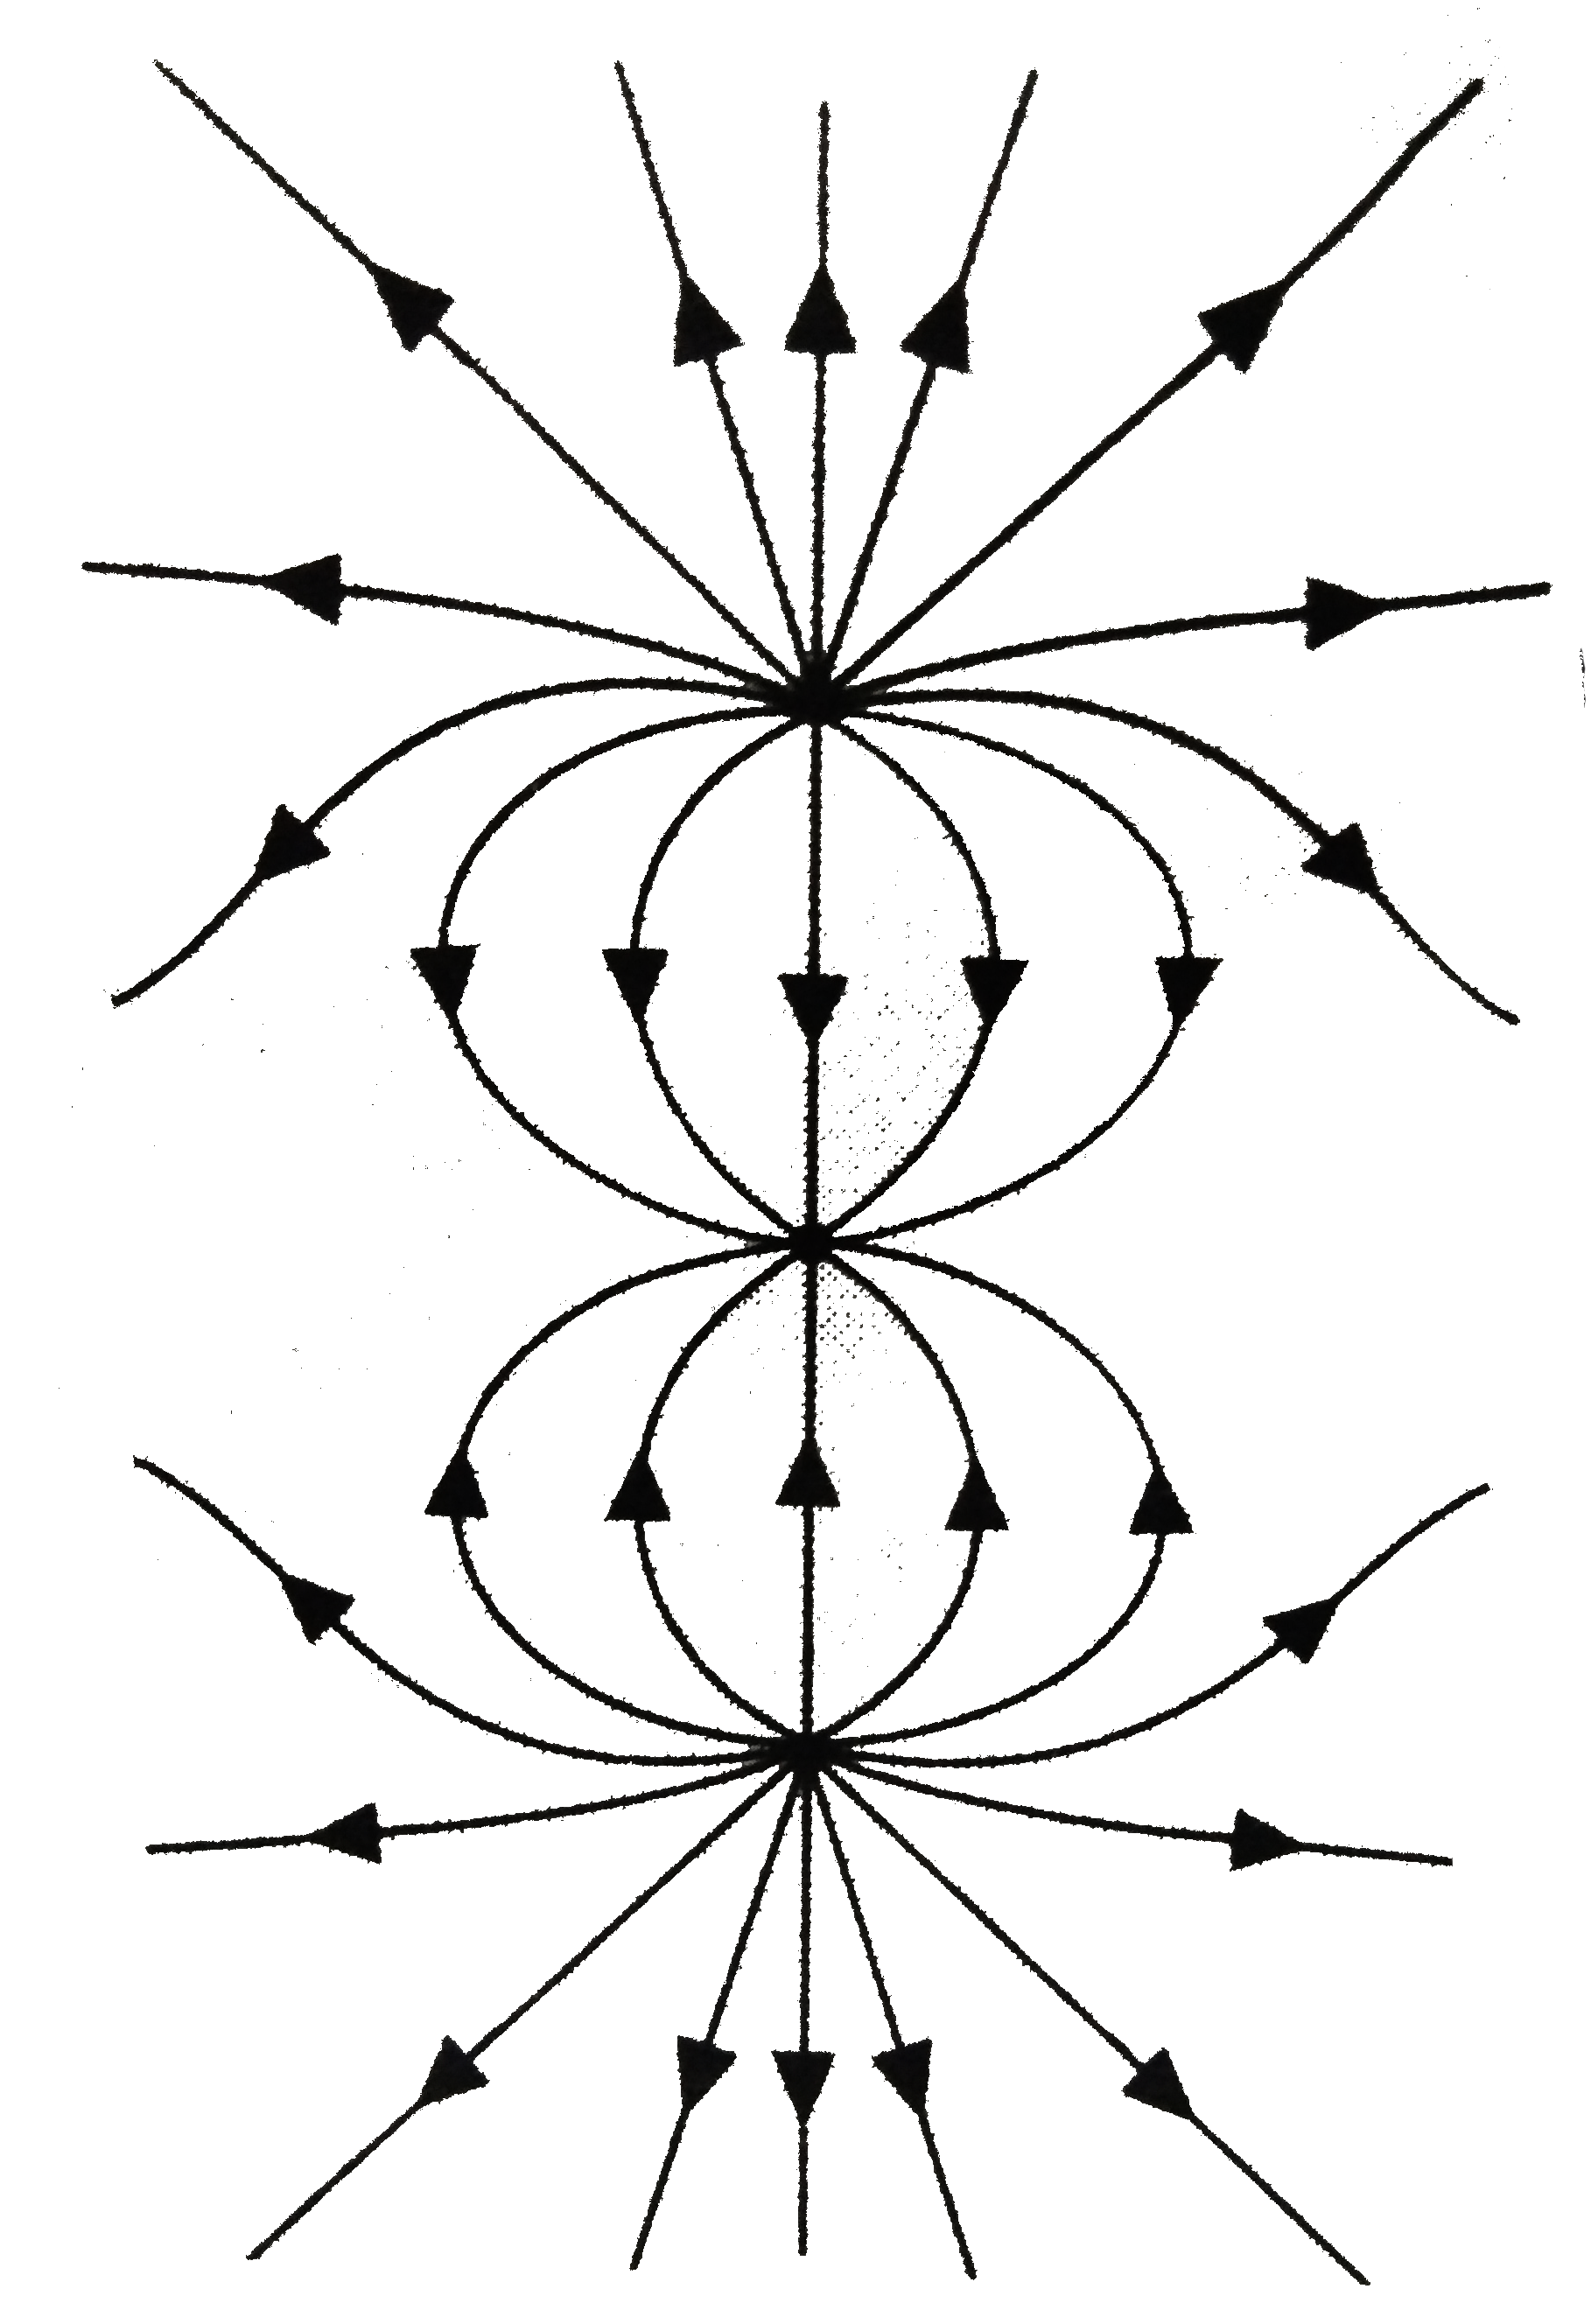
(c ) should be placed ........ .View SolutionFig. shows some of the electric field lines due to three point charges arranged along the vertical axis. All three charges have the same magnitude.
(a) What are the signs of each of the three charges? Explain your reasoning.
(b) At what points(s) is the magnitude of the electric field the smallest? Explain your reasoning. Explain how the fields produced by each individual point charge combine to give a small net field at this point or points.
(c ) Two point charges q and -q are placed at a distance d apart. What are the points at which the resultant electric field is parallel to the line joining the two charge?
 .View Solution
Two points masses 'm' and 2m are kept at certain distance as shows in figure. Draw E−r and V−r graphs along the line joining them corresponding to given mass system.
 View Solution
Two point charges q and −q are separated by a distance 2l. Find the flux strength vector across the circle of radius R placed with its centre coinciding with the of line joining the two charges in the perpendicular plane.
View Solution

