Isn't the result of the previous problem in contradiction with the fact that the ideal gas isochore in p-T coordinates is represented by a linear graph, while the iso chore of saturated vapour is nonlinear. ( see 35.3 Fig. 35.2)?
As distinct from an ideal gas, whose molecular concentration (and density) does not change in an isochoric process, the molecular concentration and density) of a saturated vapour rises with temperature because of additional evaporation of the liquid. 22.3. The density of saturated vapour at 55∘Cis104.3g/m3. Therefore at this temperature 8 g of saturated vapour occupies a volume of 810.4.3=7.6×10⁻³m=7.6 litres. In a smaller volume there will be a precipitation of dew.
समान प्रश्न
The P-T graph for the given mass of an ideal gas is shown in figure. Then the volume
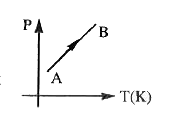
View SolutionPlot (p - V),(V - T) and (ρ - T) graph corresponding to the (p - T) graph for an ideal gas shown in figure.
 .
.
View SolutionAssertion: Straight line on (p - T) graph for an ideal gas represents isochoric process.
Reason: If p∝T,V=constant.
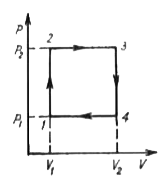
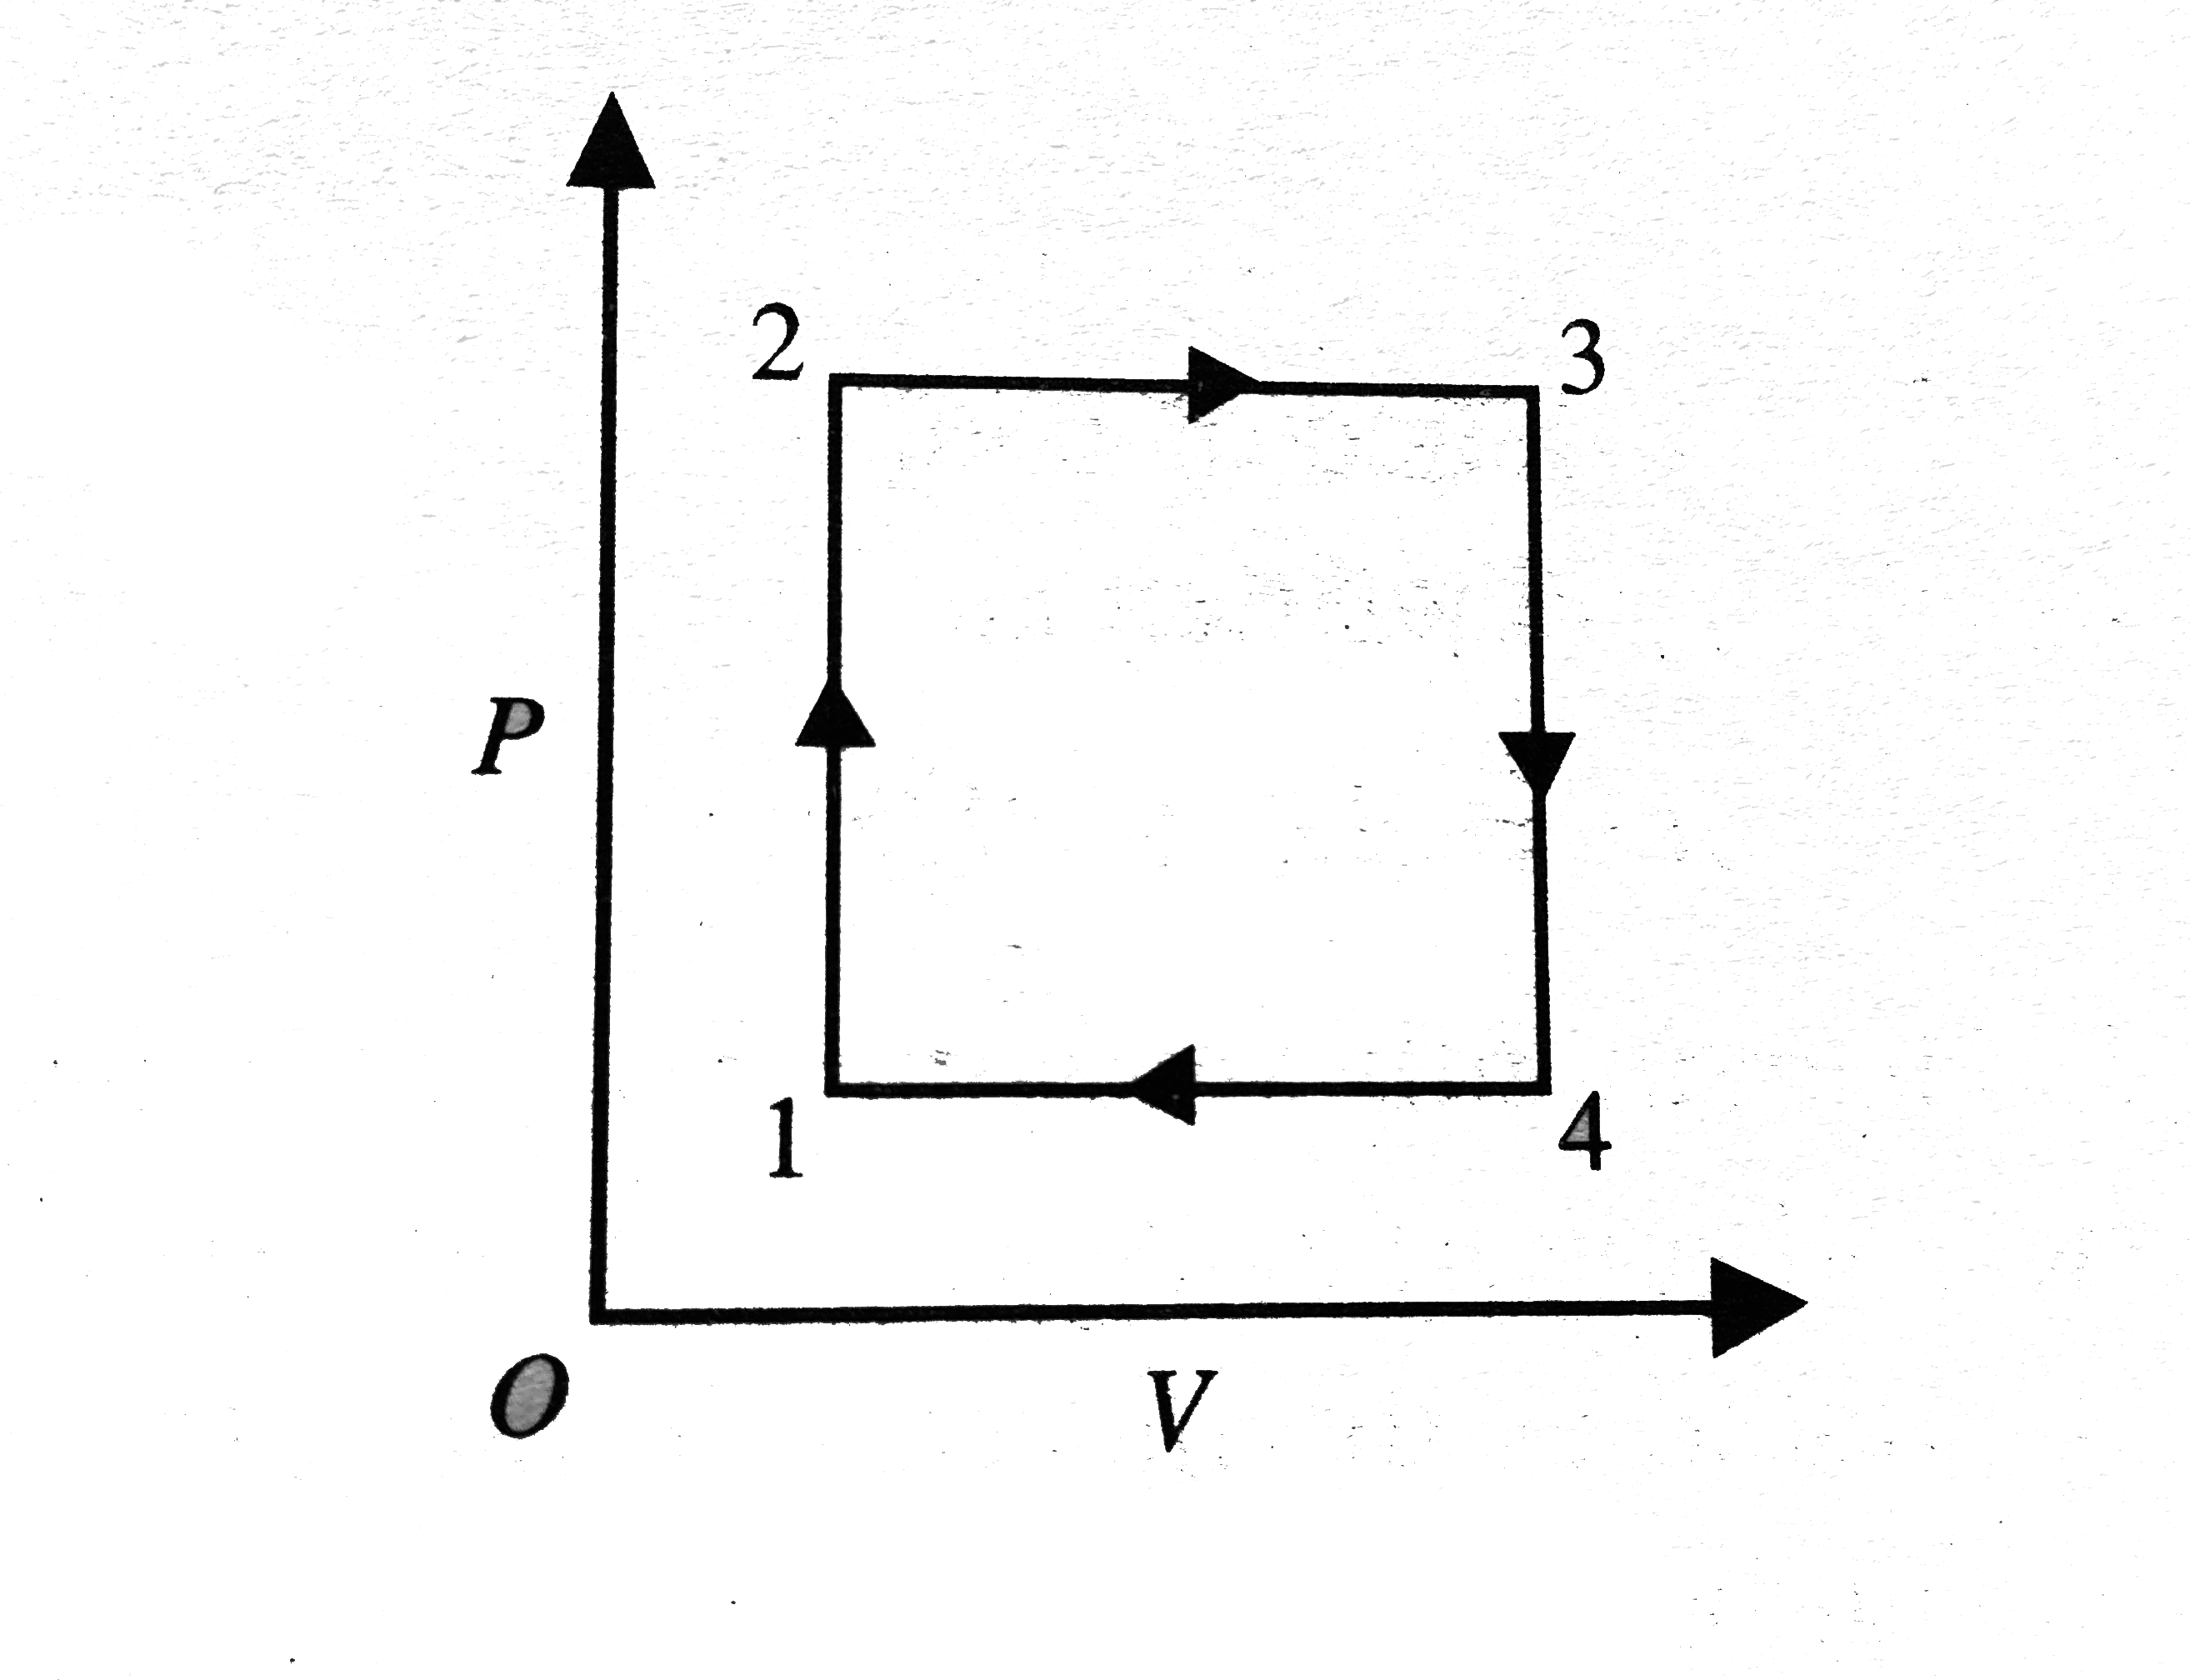
View SolutionA gas has been subjected to an isochoric-isobaric cycle 1-2-3-4-1 (Fig.). Plot the graph of this cycle in the p−ρ,V−T and p-T coordinates.
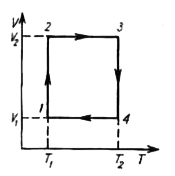
View SolutionA gas has been subjected to isothermal-isochoric cycle 1-2-3-4-1 (Fig.). Plot the graph of this cycle in p−V,p−ρ, and p-T coordinates.
View SolutionIsn't the result of the previous problem in contradiction with the fact that the ideal gas isochore in p-T coordinates is represented by a linear graph, while the iso chore of saturated vapour is nonlinear. ( see 35.3 Fig. 35.2)?
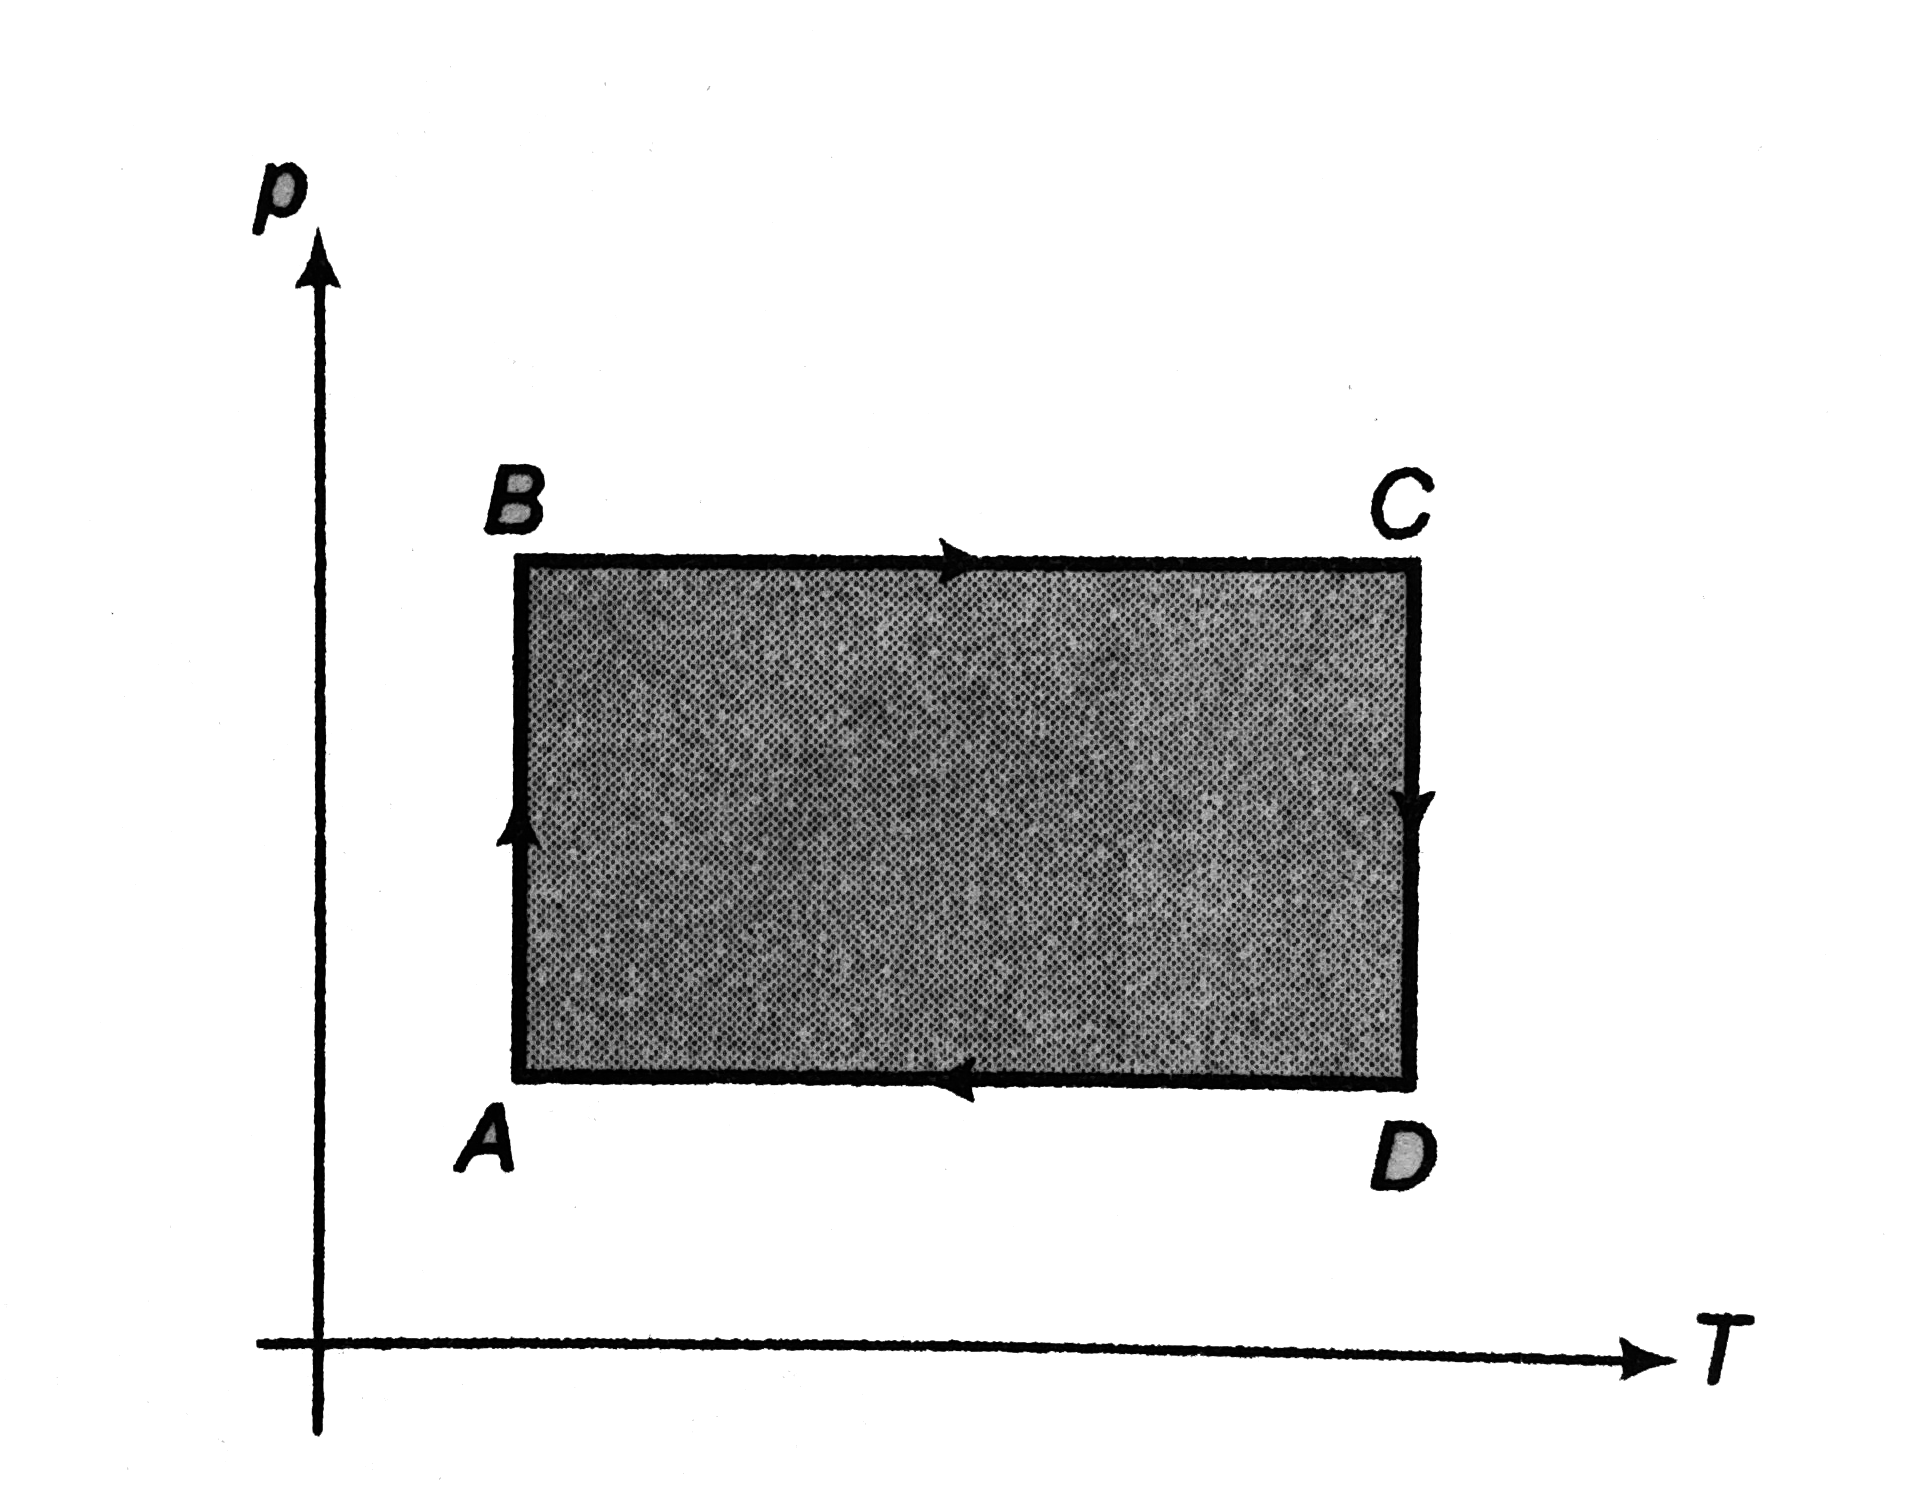
View SolutionA gas has been subjected to isochoric-isobaric processes 1-2-3-4-1 see Fig. Plot this process on T - V and P - T diagrams.
View Solution
