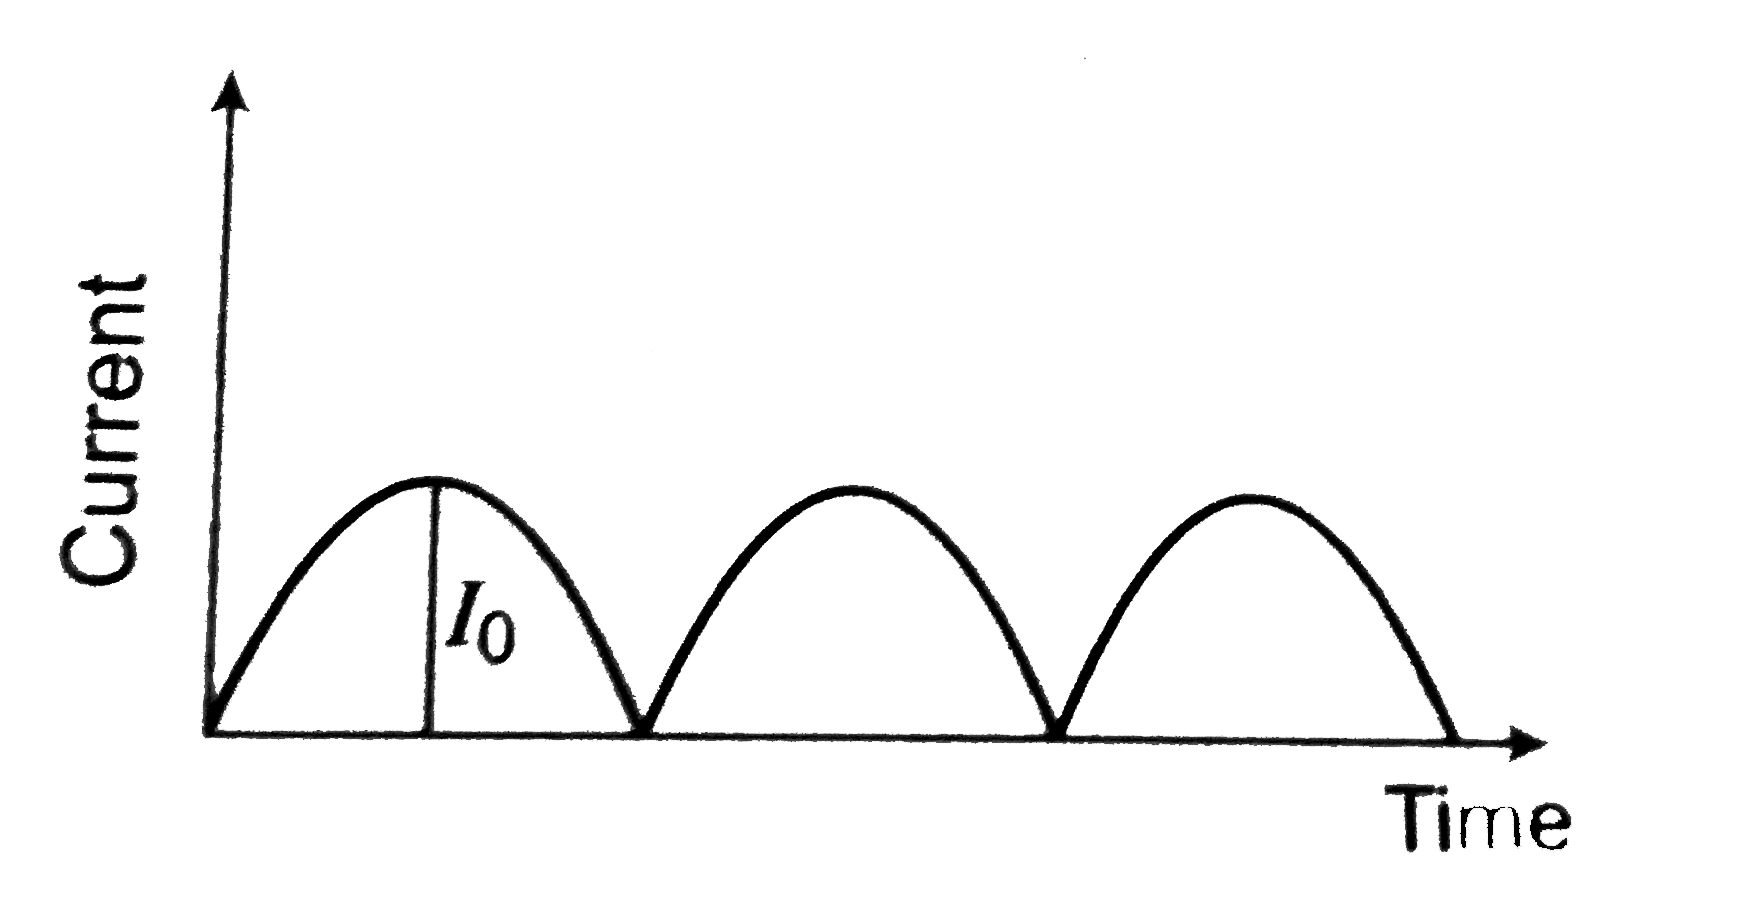
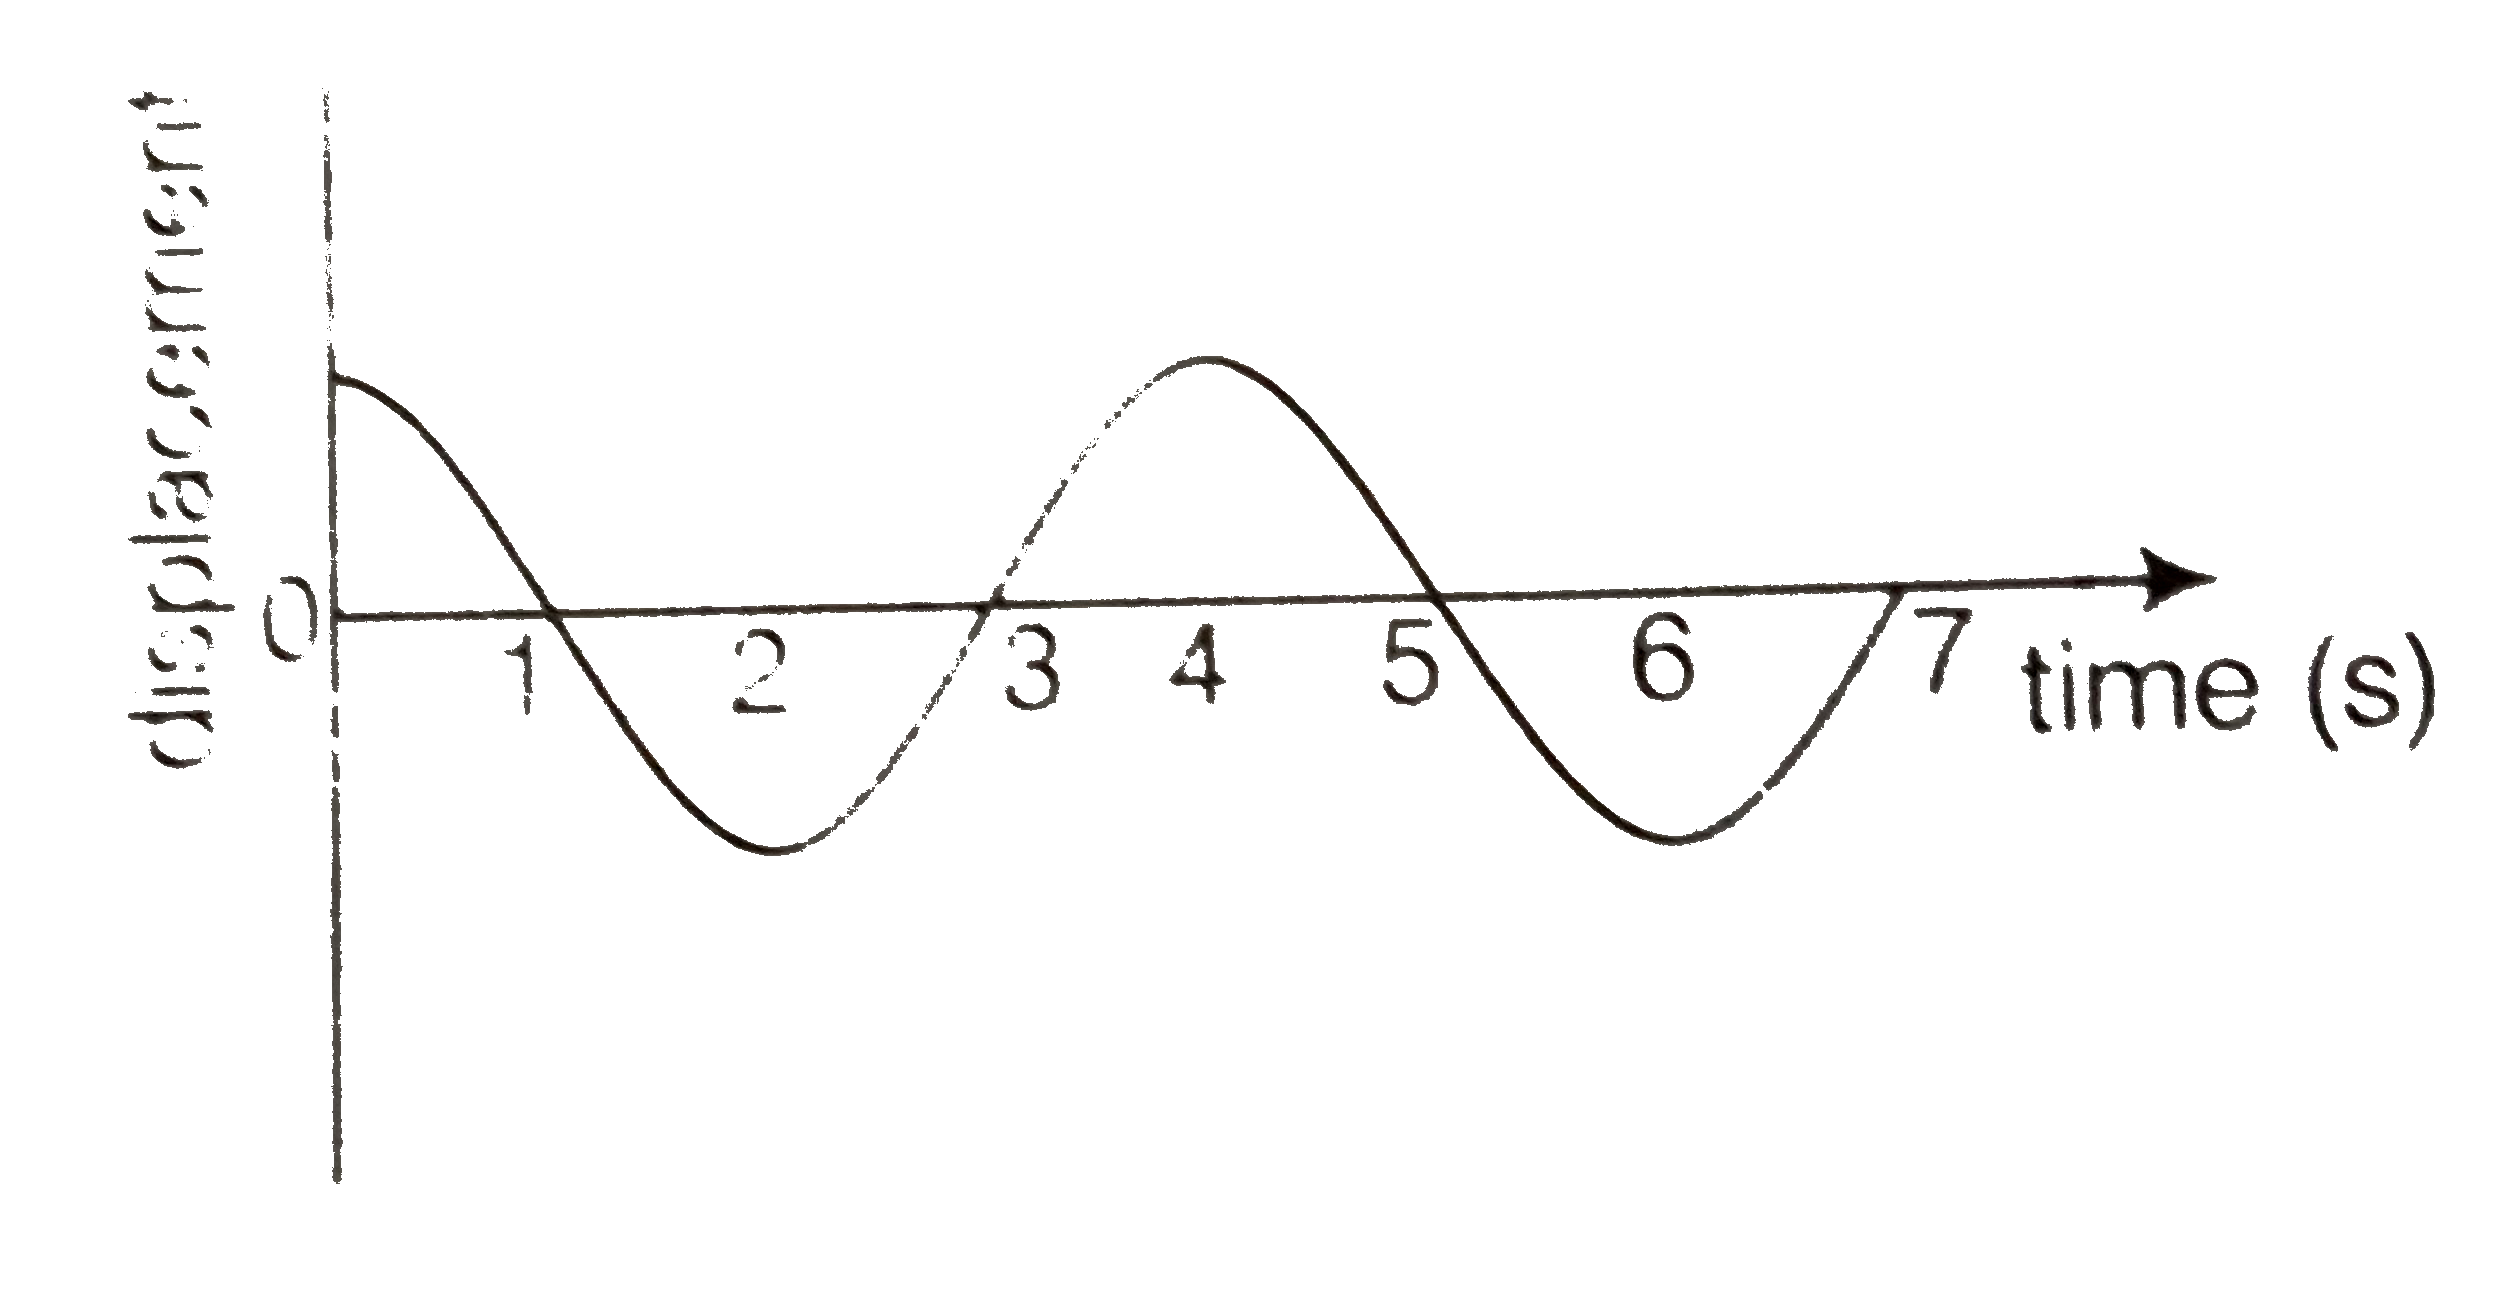
The output current versus time curve of a rectifier is shown in the figure. The average value of output current in this case is
0
I22
2I2π
I0
The correct Answer is:C
Step by step video & image solution for The output current versus time curve of a rectifier is shown in the figure. The average value of output current in this case is by Physics experts to help you in doubts & scoring excellent marks in Class 12 exams.
Updated on:21/07/2023Topper's Solved these Questions
- ALTERNATING CURRENTBOOK - CENGAGE PHYSICS ENGLISHCHAPTER - ALTERNATING CURRENTEXERCISE - Comphension Based
8 Videos
- ALTERNATING CURRENTBOOK - CENGAGE PHYSICS ENGLISHCHAPTER - ALTERNATING CURRENTEXERCISE - Single Correct
10 Videos
- ALTERNATING CURRENTBOOK - CENGAGE PHYSICS ENGLISHCHAPTER - ALTERNATING CURRENTEXERCISE - Archives Integer
1 Videos
- ATOMIC PHYSICSBOOK - CENGAGE PHYSICS ENGLISHCHAPTER - ATOMIC PHYSICSEXERCISE - ddp.4.3
15 Videos
Similar Questions
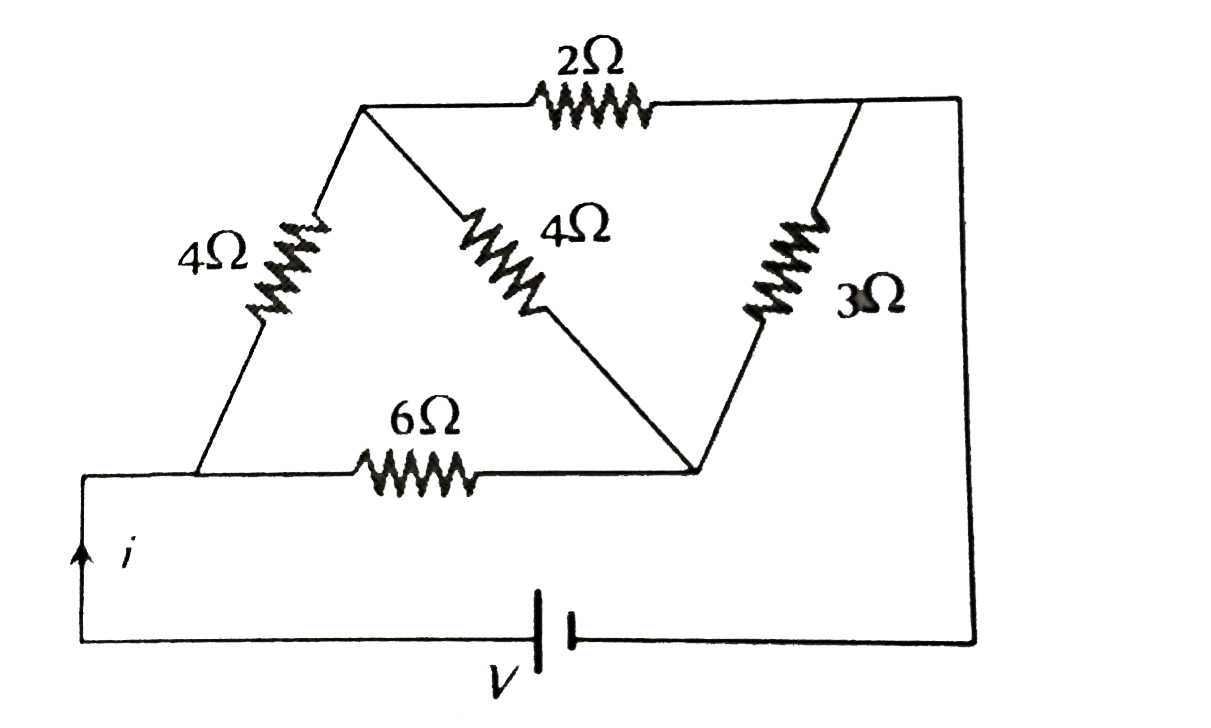
For the network shown in the figure the value of the current i is -

View SolutionFor the network shown in the figure the value of the current i is
View SolutionIn the circuit shown in the figure
 .
.
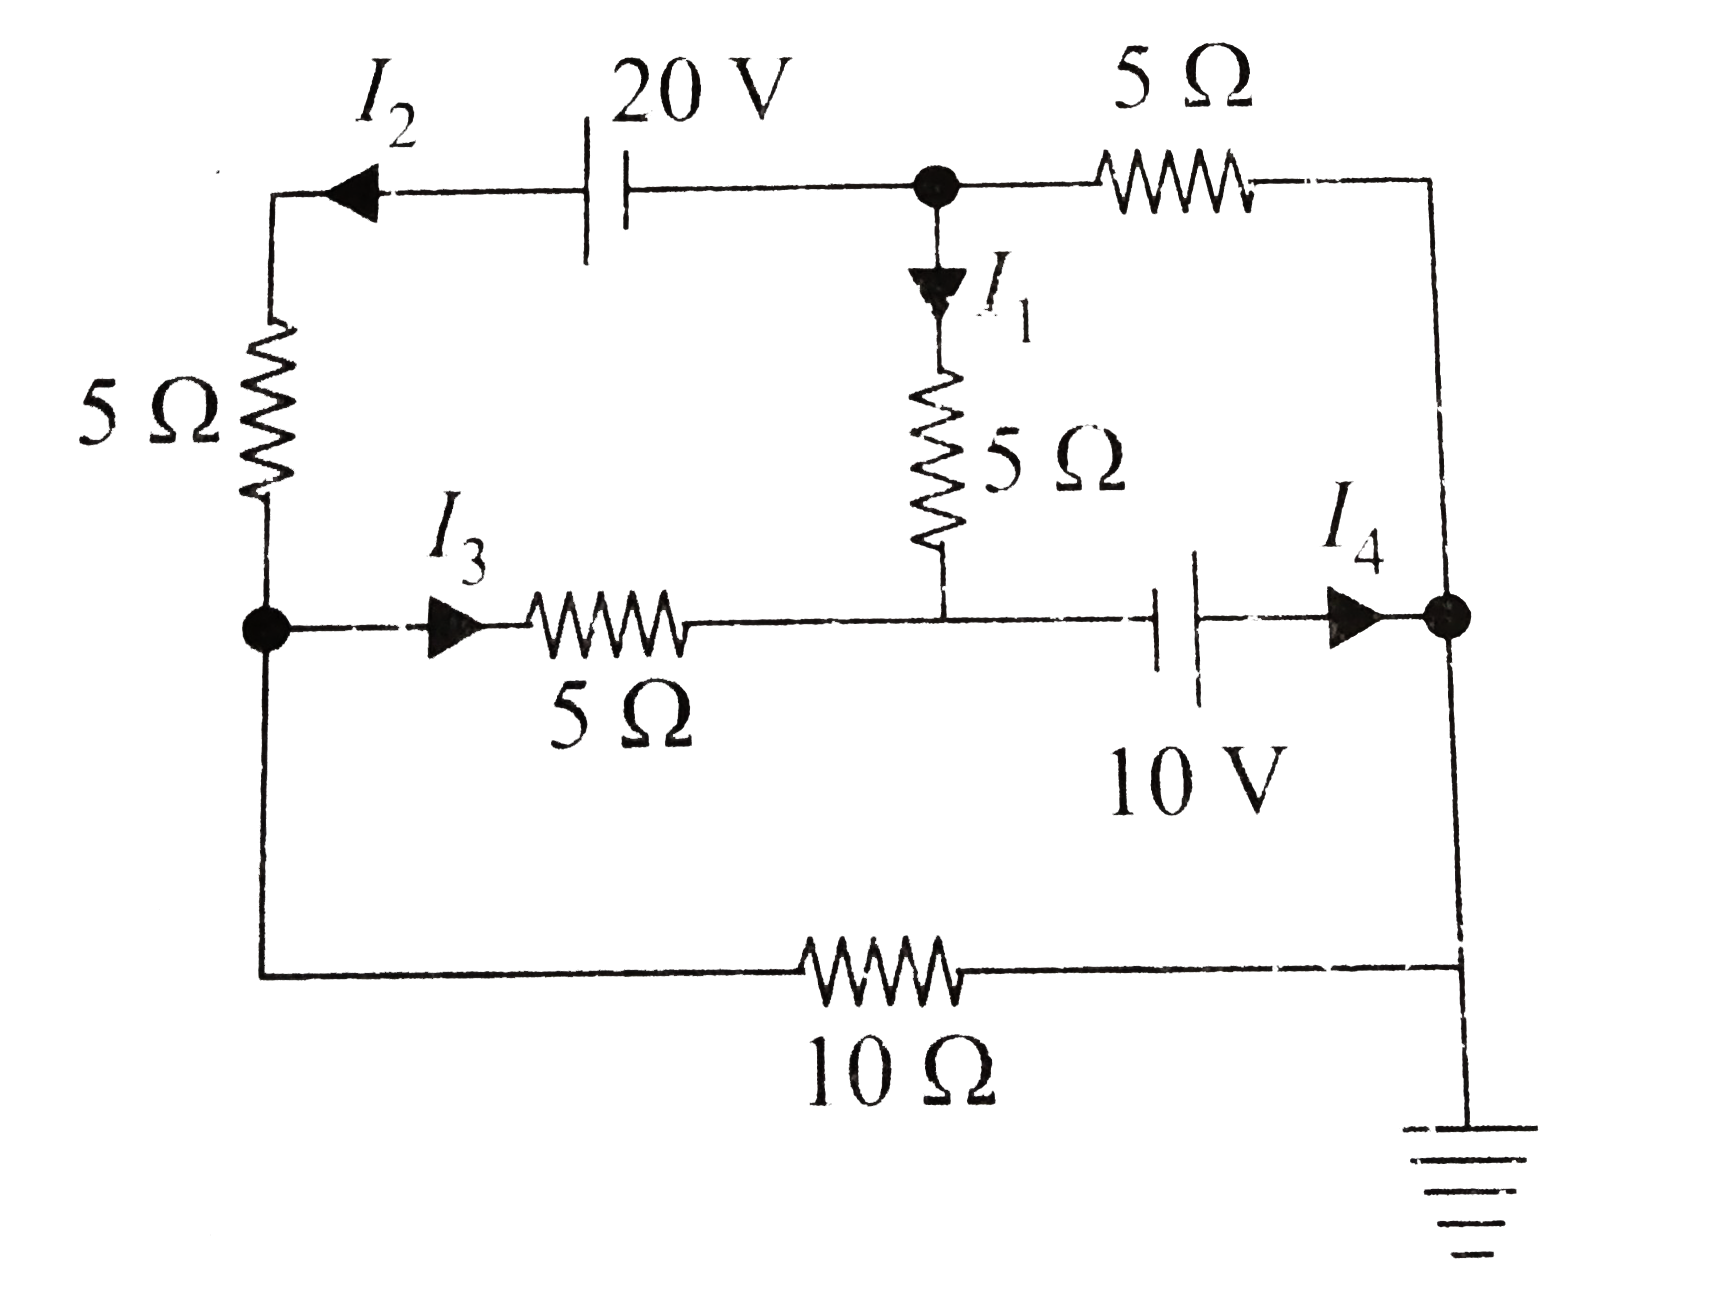
The value of current I4 is
View SolutionThe value of current i, in the electrical network as shown in the figure is

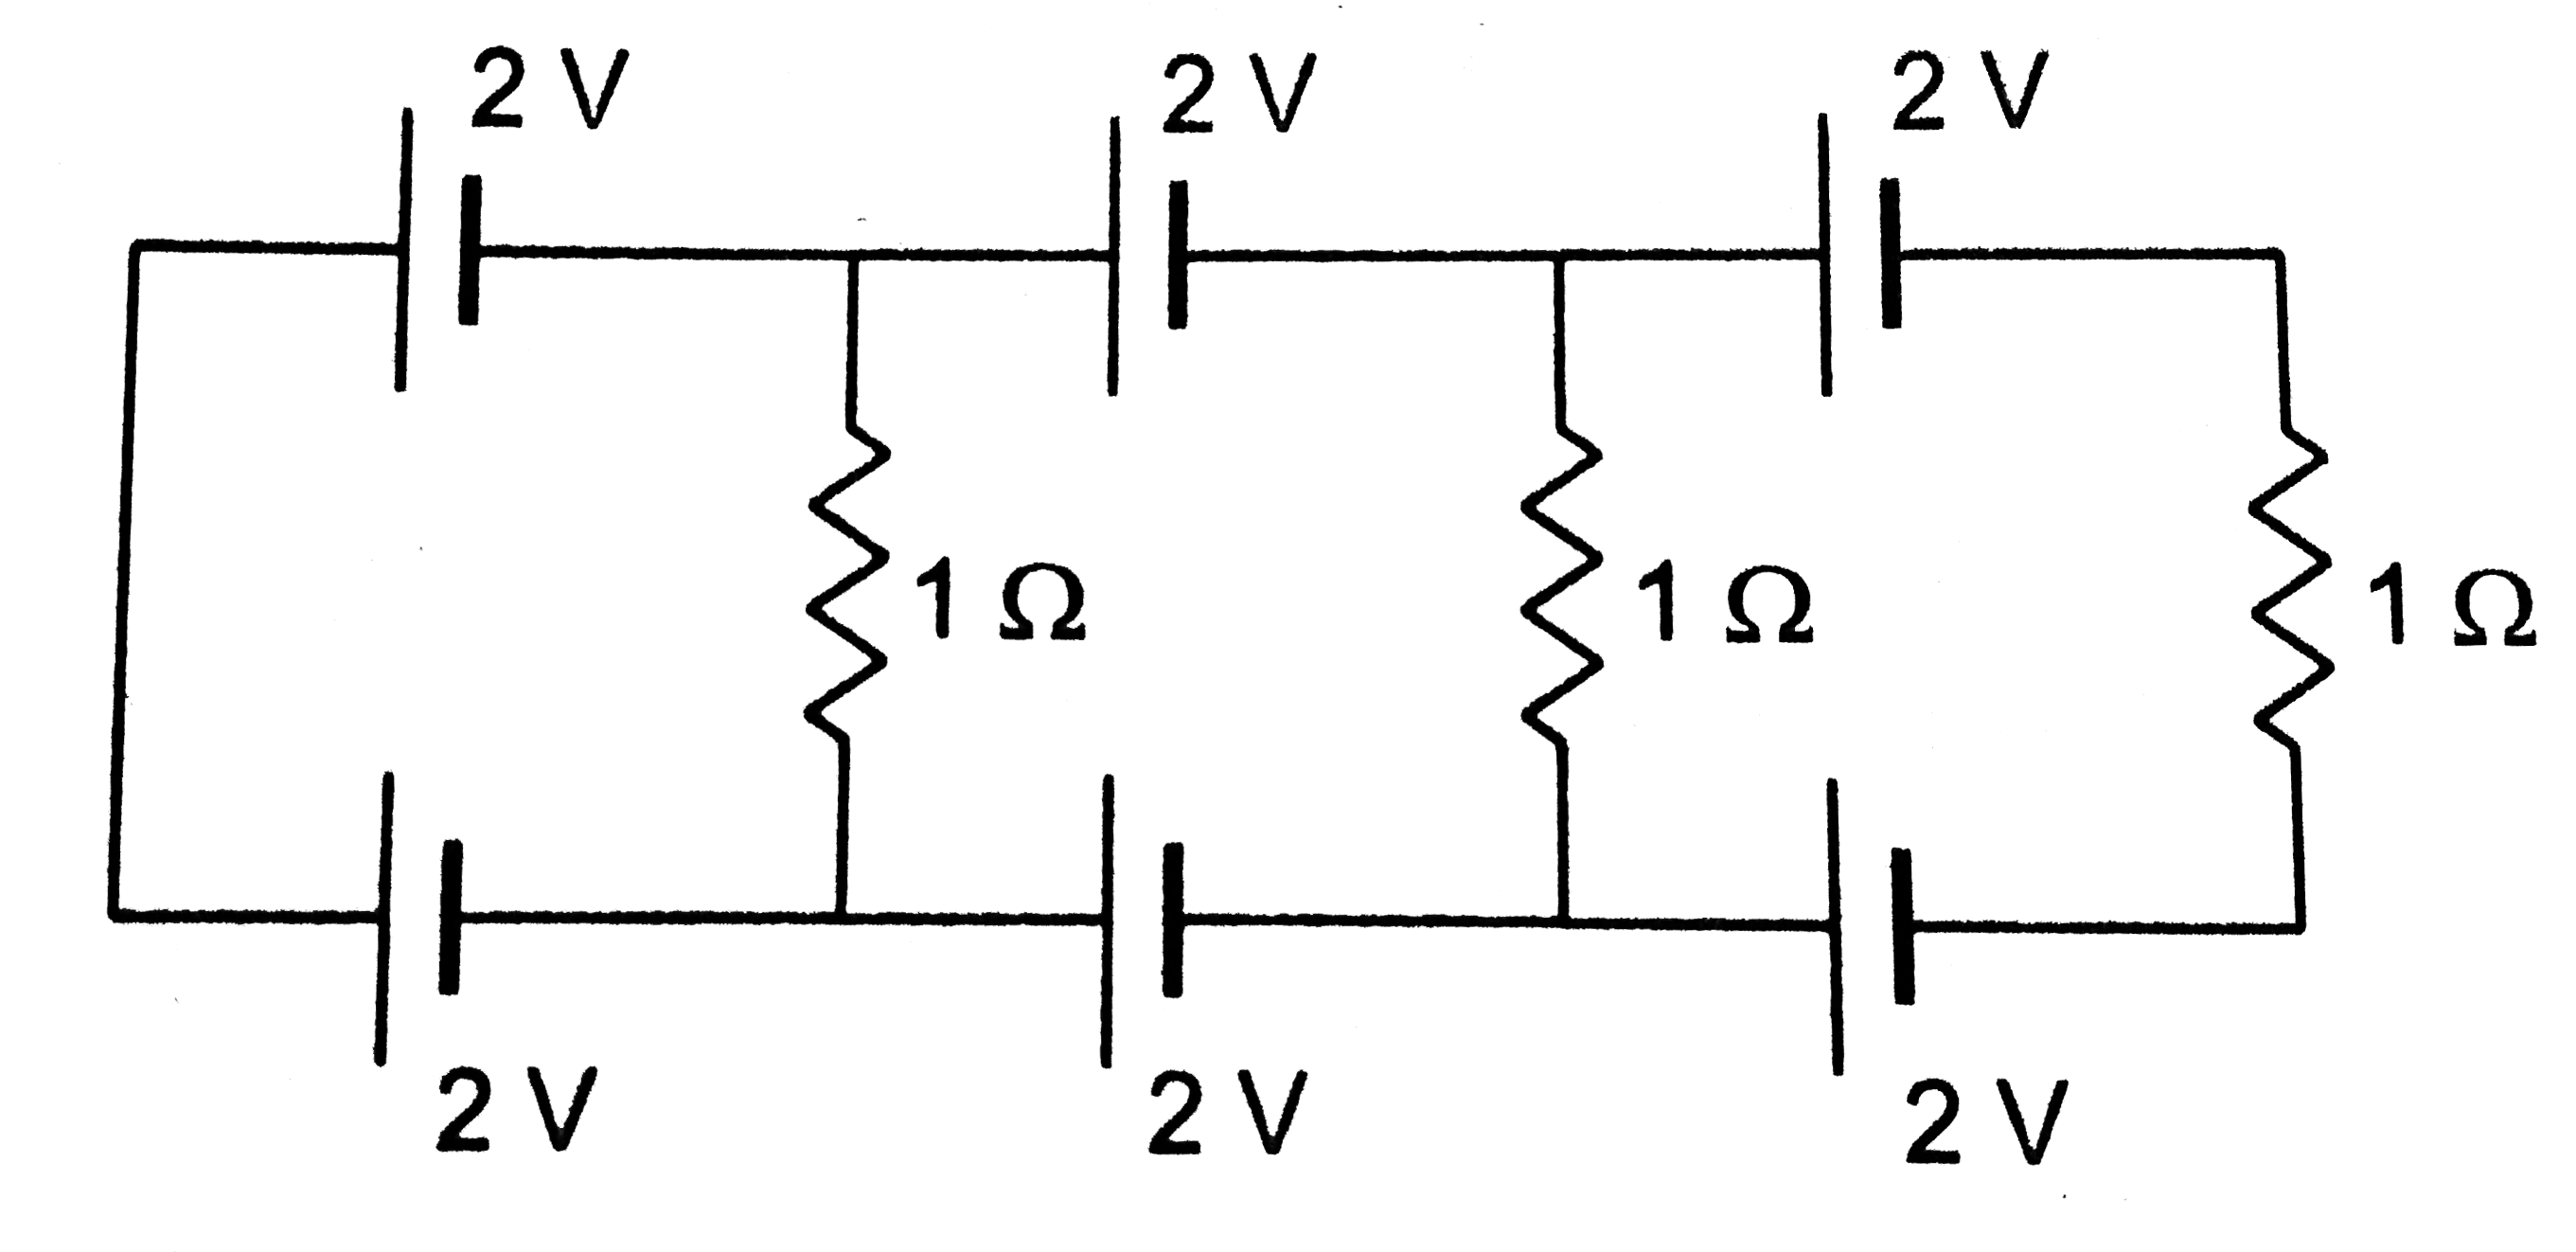
View SolutionFind the current in the resistor shown in figure.
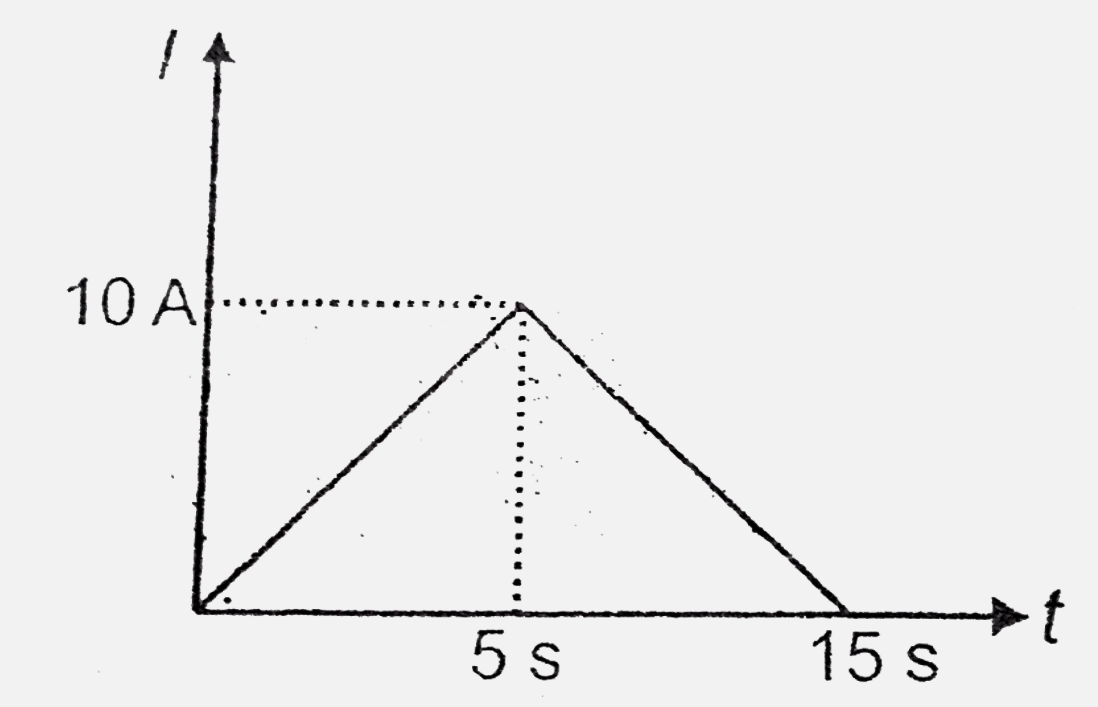
View SolutionCurrent l versus time t graph through a conductor is shown in the figure. Average current through the conductor in the interval 0 to 15 s is
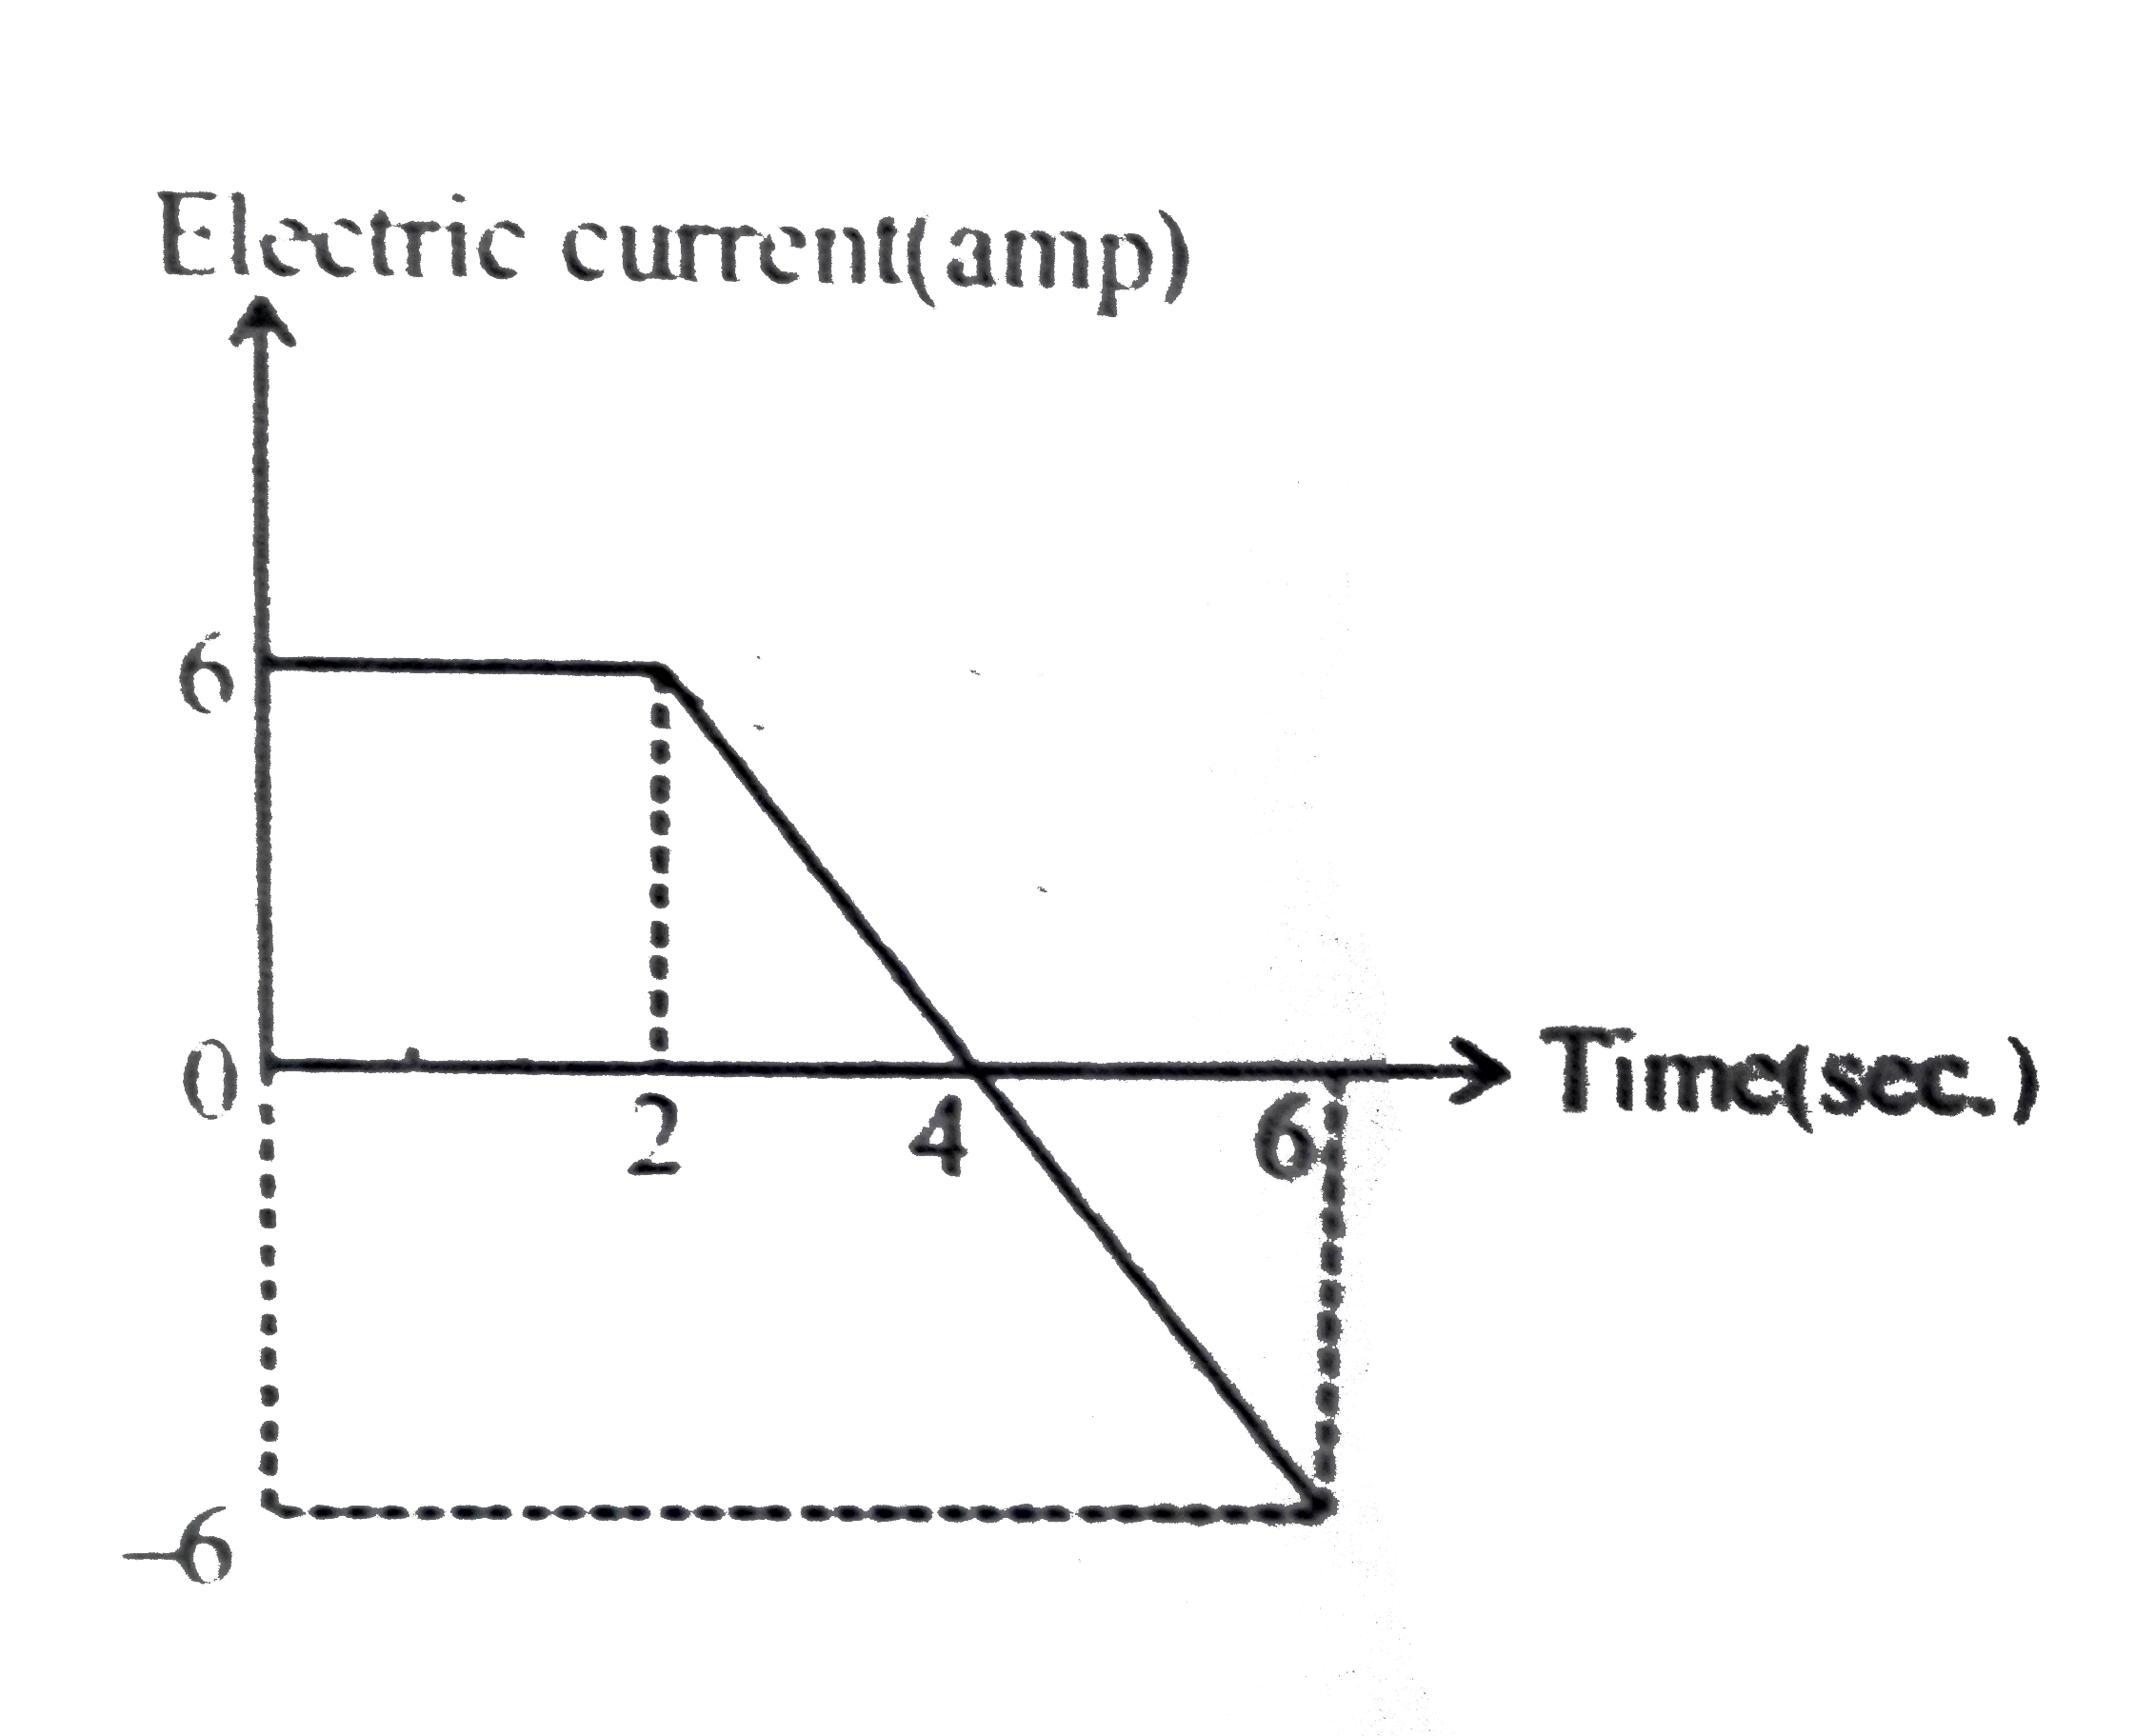
View SolutionIf Electric-current 'i' time (t) graph shown in figure. The average current in first 6 sec. is :-
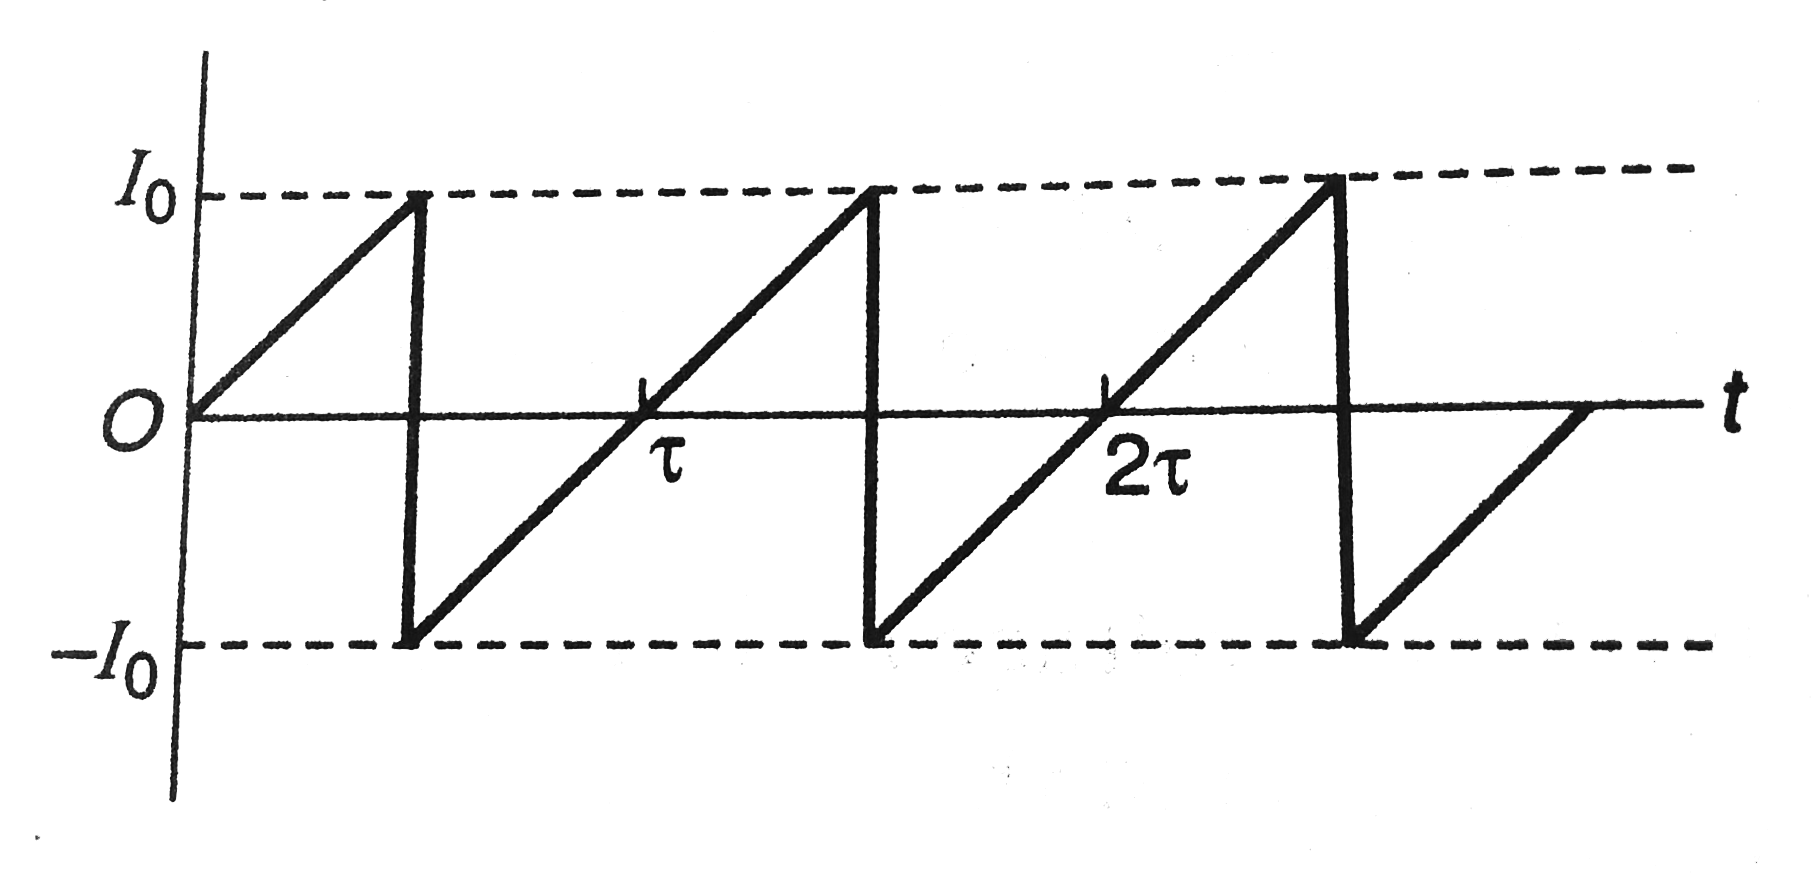
View SolutionThe current in a certain circuit varies with time as shown in figure. Find the average current and the rms current in terms of I0
 .
.
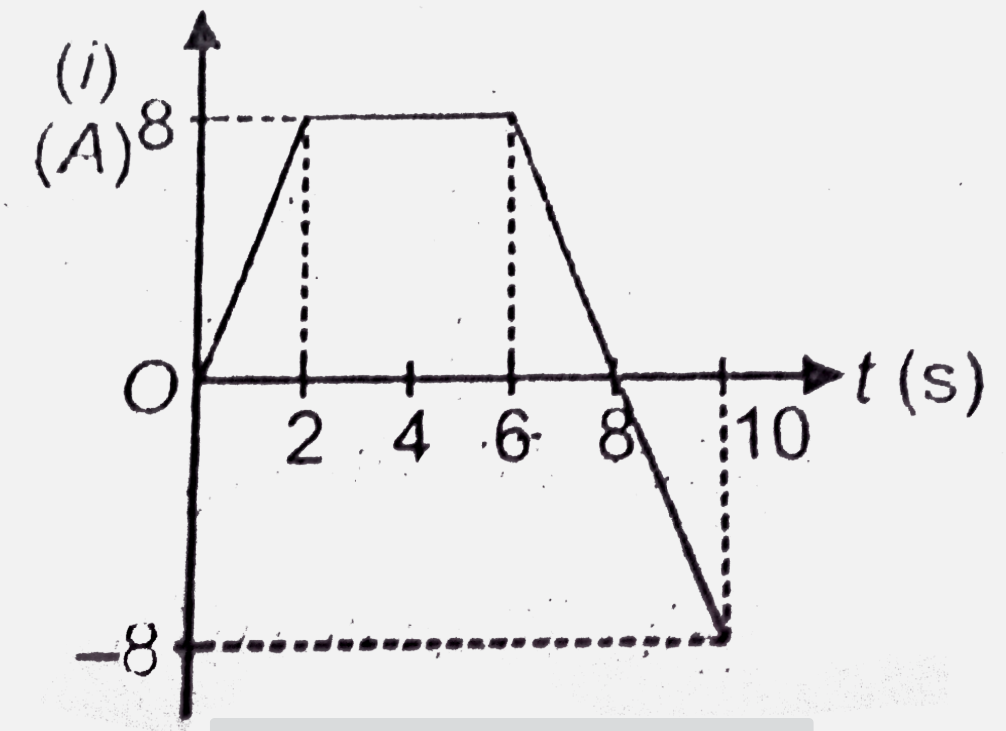
View SolutionThe current I through a conductor varies with time t as shown in figure. The average electric current during t=0 to t=10 s will be
View SolutionDisplacement versus time curve for a particle executing SHM is shown in figure. Choose the correct statements.
View Solution
