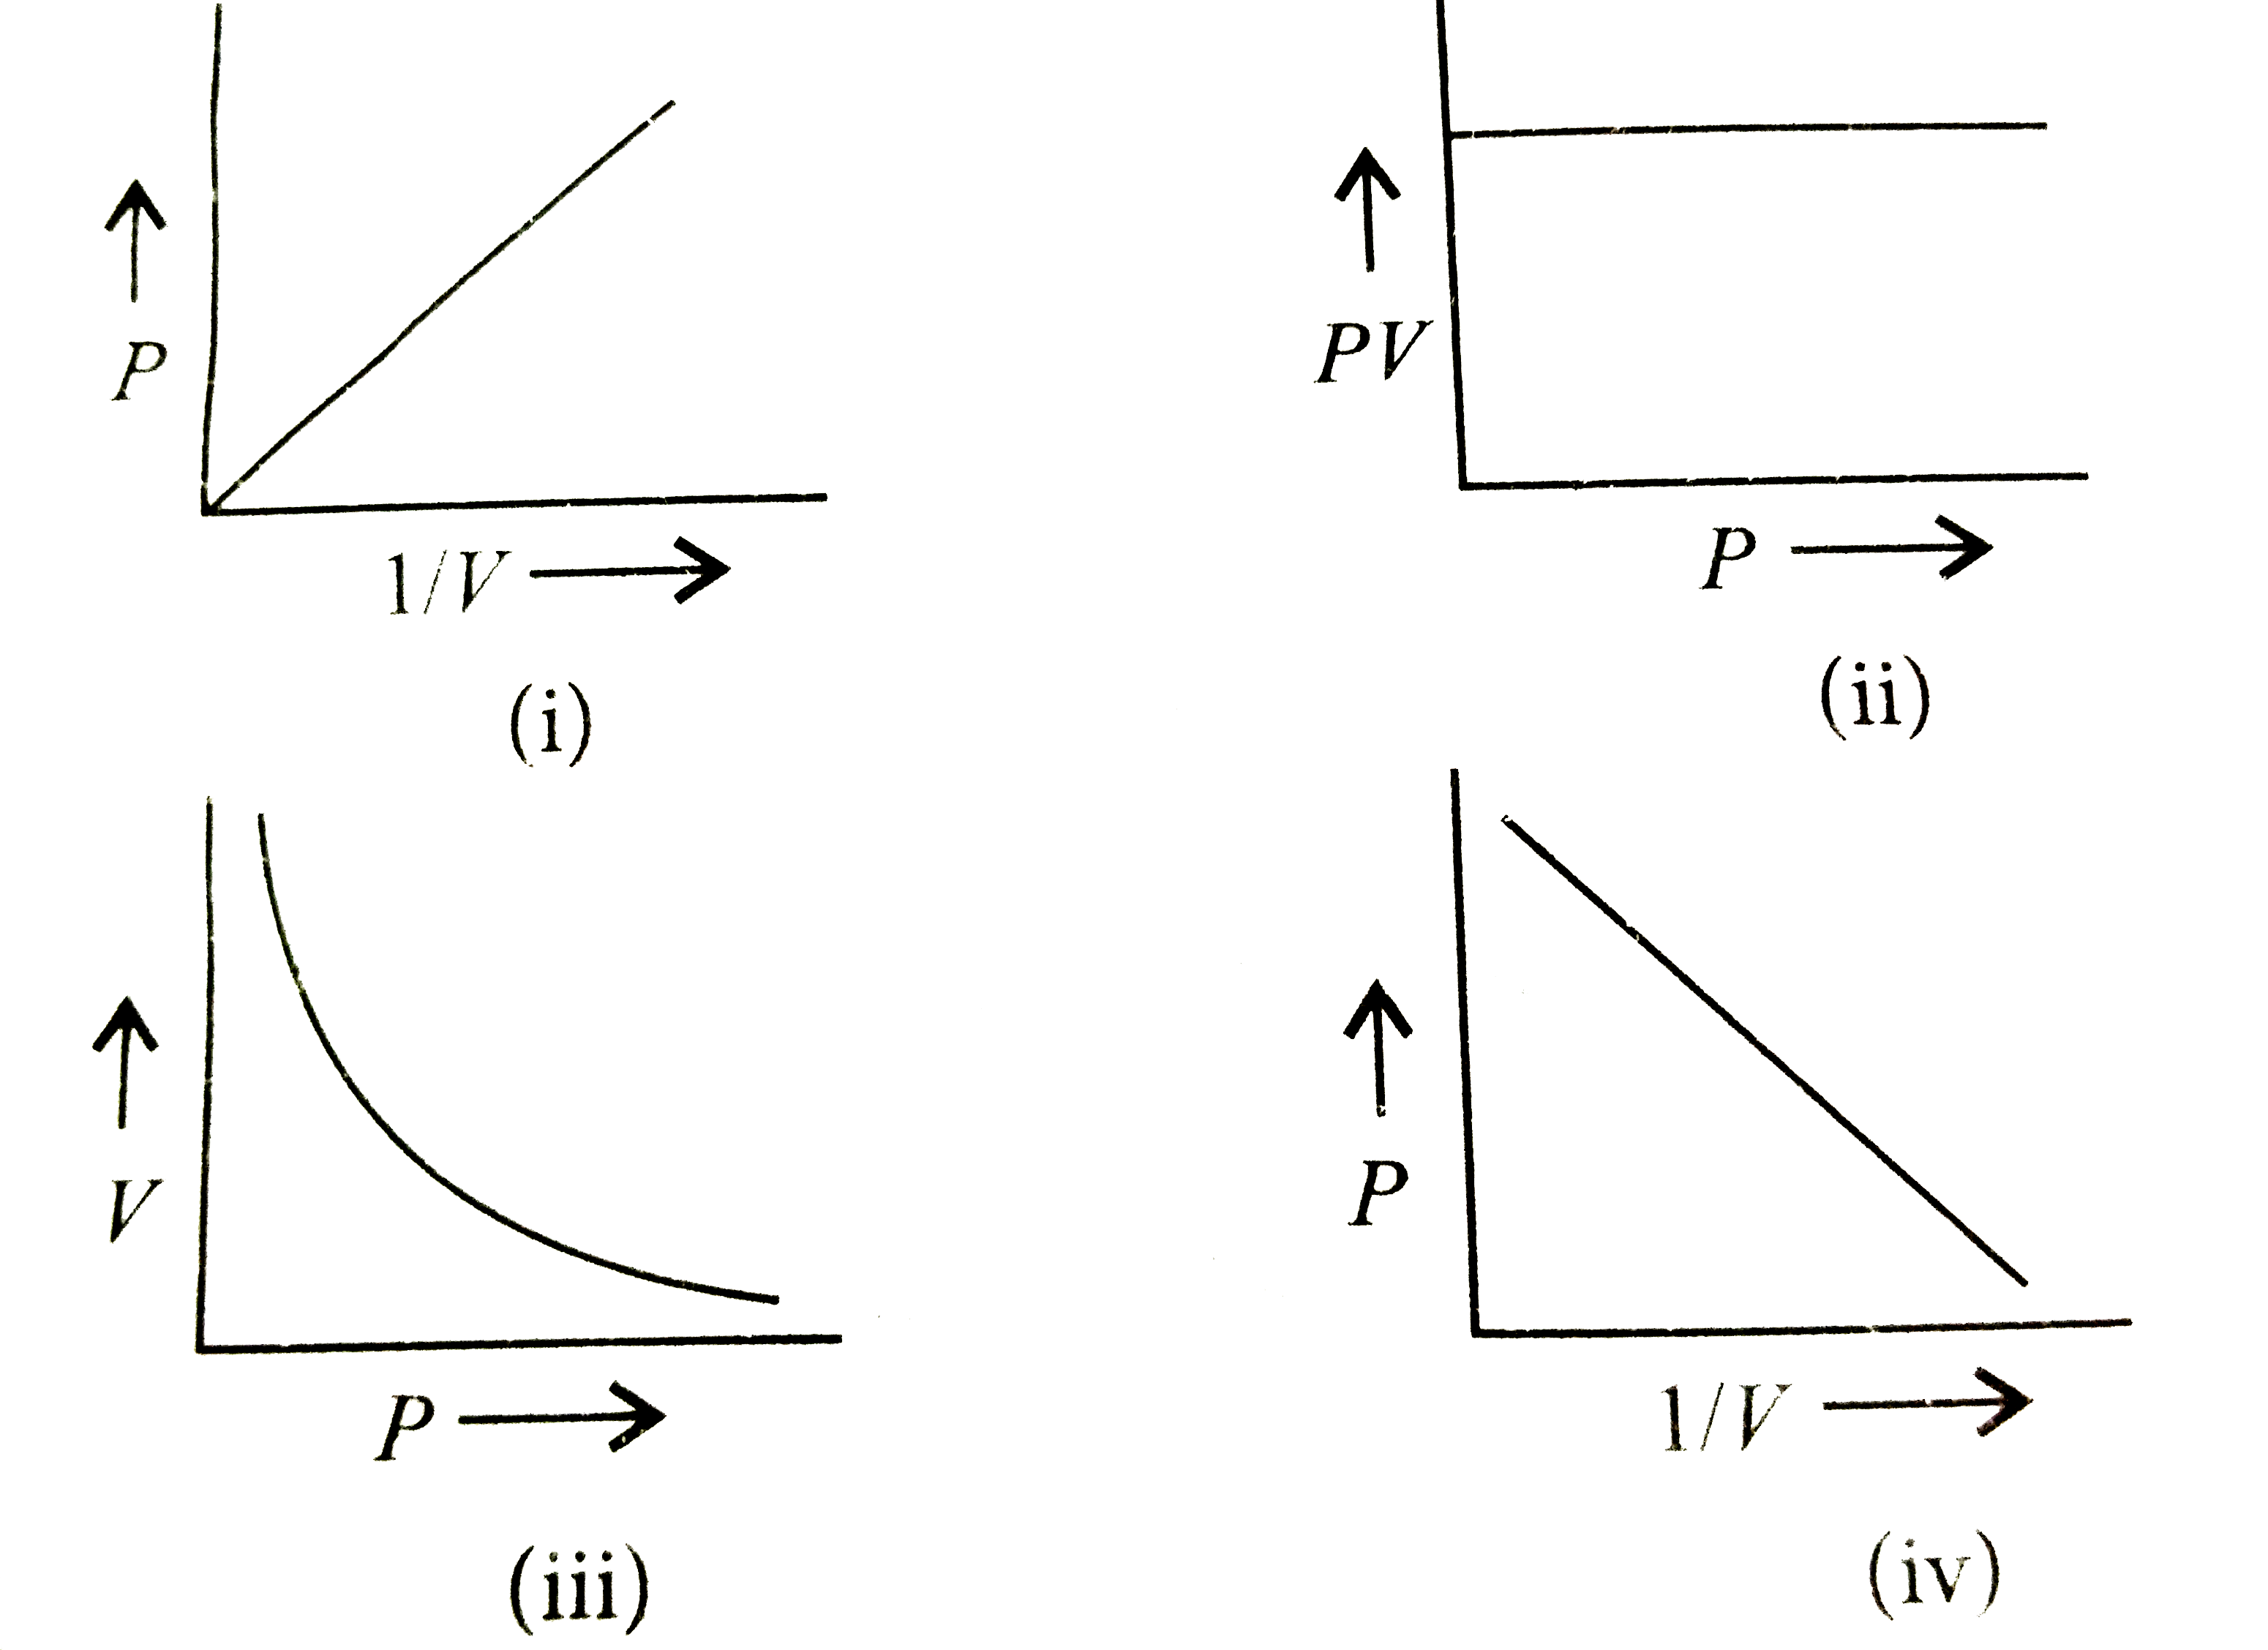
Which of the following graphs represent the correct variation of capacitive reactance XC with frequency upsilon ?
A

B

C

D

Video Solution
Text Solution
The correct Answer is:B
|
Answer
Step by step video & image solution for Which of the following graphs represent the correct variation of capacitive reactance X_(C ) with frequency upsilon ? by Physics experts to help you in doubts & scoring excellent marks in Class 12 exams.
Updated on:21/07/2023Topper's Solved these Questions
- ALTERNATING CURRENTBOOK - CENGAGE PHYSICS ENGLISHCHAPTER - ALTERNATING CURRENTEXERCISE - Comphension Based
8 Videos
- ALTERNATING CURRENTBOOK - CENGAGE PHYSICS ENGLISHCHAPTER - ALTERNATING CURRENTEXERCISE - Single Correct
10 Videos
- ALTERNATING CURRENTBOOK - CENGAGE PHYSICS ENGLISHCHAPTER - ALTERNATING CURRENTEXERCISE - Archives Integer
1 Videos
- ATOMIC PHYSICSBOOK - CENGAGE PHYSICS ENGLISHCHAPTER - ATOMIC PHYSICSEXERCISE - ddp.4.3
15 Videos
Similar Questions
Knowledge Check
Which of the following graphs represent the correct variation of inductive reactance XL with frequency υ?
A B
B C
C D
D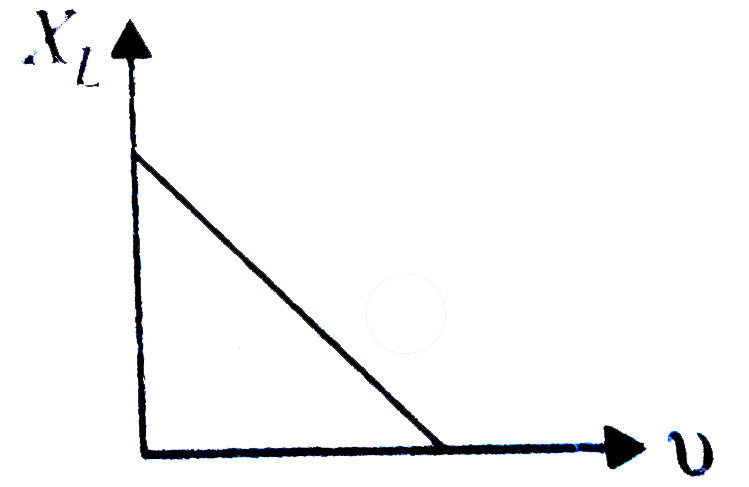
Identify the graph which correctly reperesents the variation of capacitive reactance XC with frequency
A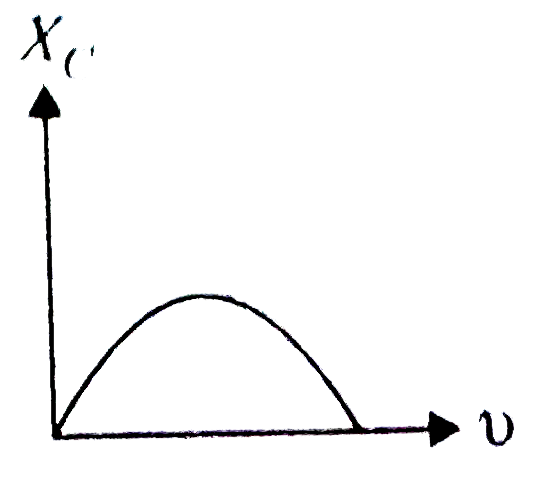 B
B C
C D
D
Which of the following graph represents correct graph for SN1 reaction :
A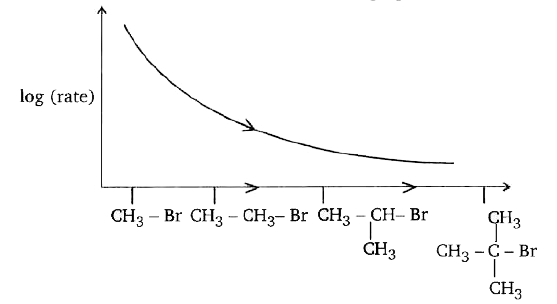 B
B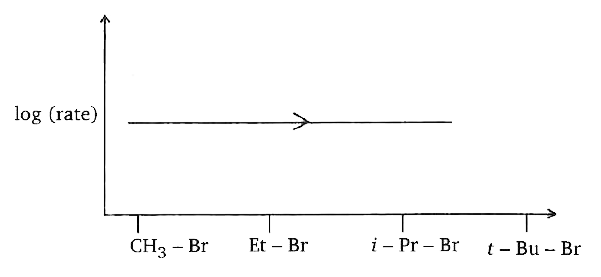 C
C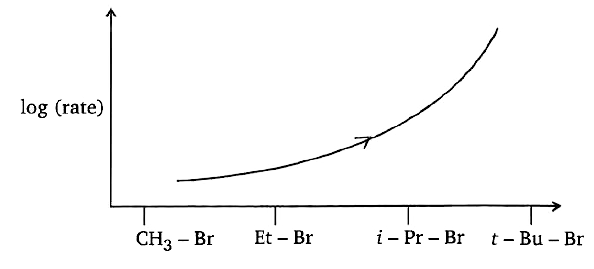 D
D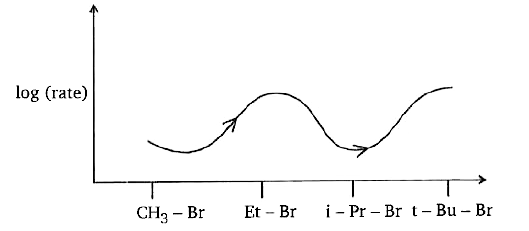
Which of the following curves correctly represent the variation of capacitve reactance (XC) with frequency (f) ?
View SolutionWhich of the following graphs correctly represents the variation of g on the - Earth?
View SolutionWhich of the following graphs best represents the variation of acceleration 'a' with displacement x?
View SolutionWhich of the following represents the correct graph for SN2 reaction ?
View SolutionWhich of the following x-t graphs does not represent periodic motion?
View Solution

