In the figure, the position time graph of a particle of mass 0.1 kg is shown. The impulse at t=2 second is :
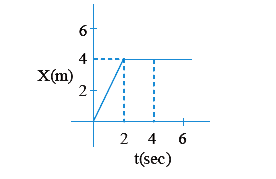
0.2gkm/sec
−0.2kgmsec−1
0.1kgmsec−1
−0.1kgm/sec
The correct Answer is:B
Corresponding velocity -time graph is
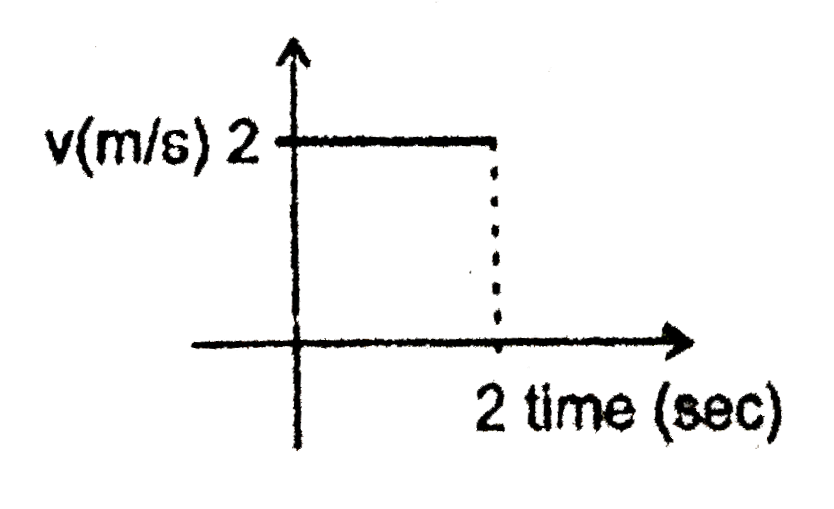
Accordingly, change in momentum at t=2 sec is
Δp=pf−pi=0.1×0−0.1×2=0.2
or impulse =-0.2 kg m/s
Topper's Solved these Questions
Similar Questions
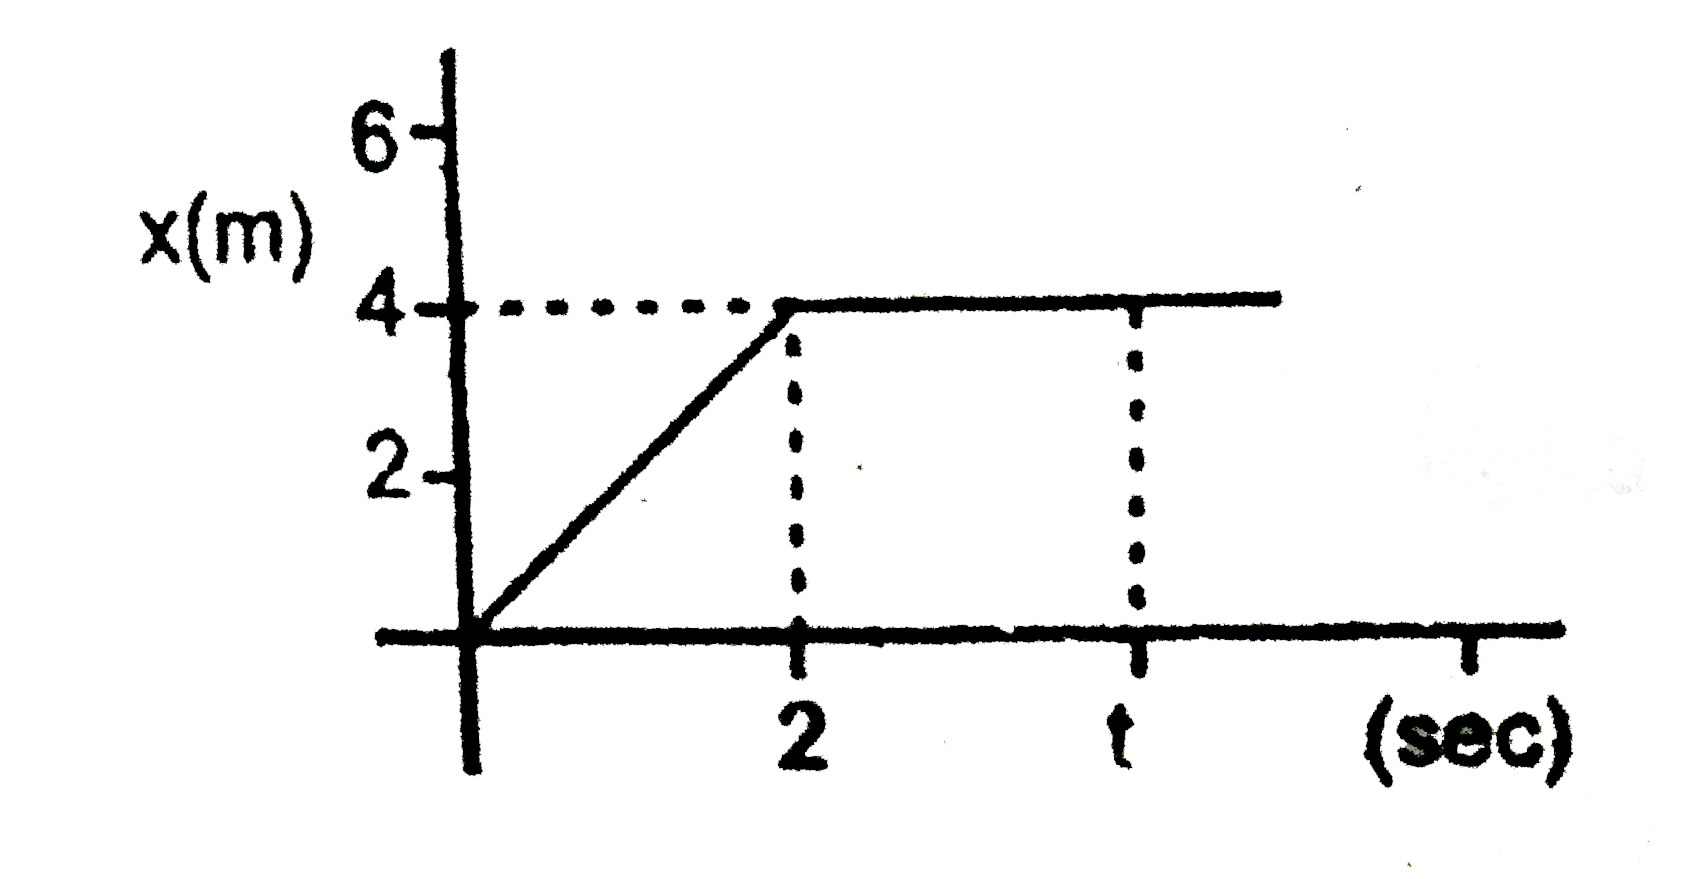
In the figure given below, the position time graph of a particle of mass 0.1kg is shown. The impulse at t=2 sec is
 View Solution
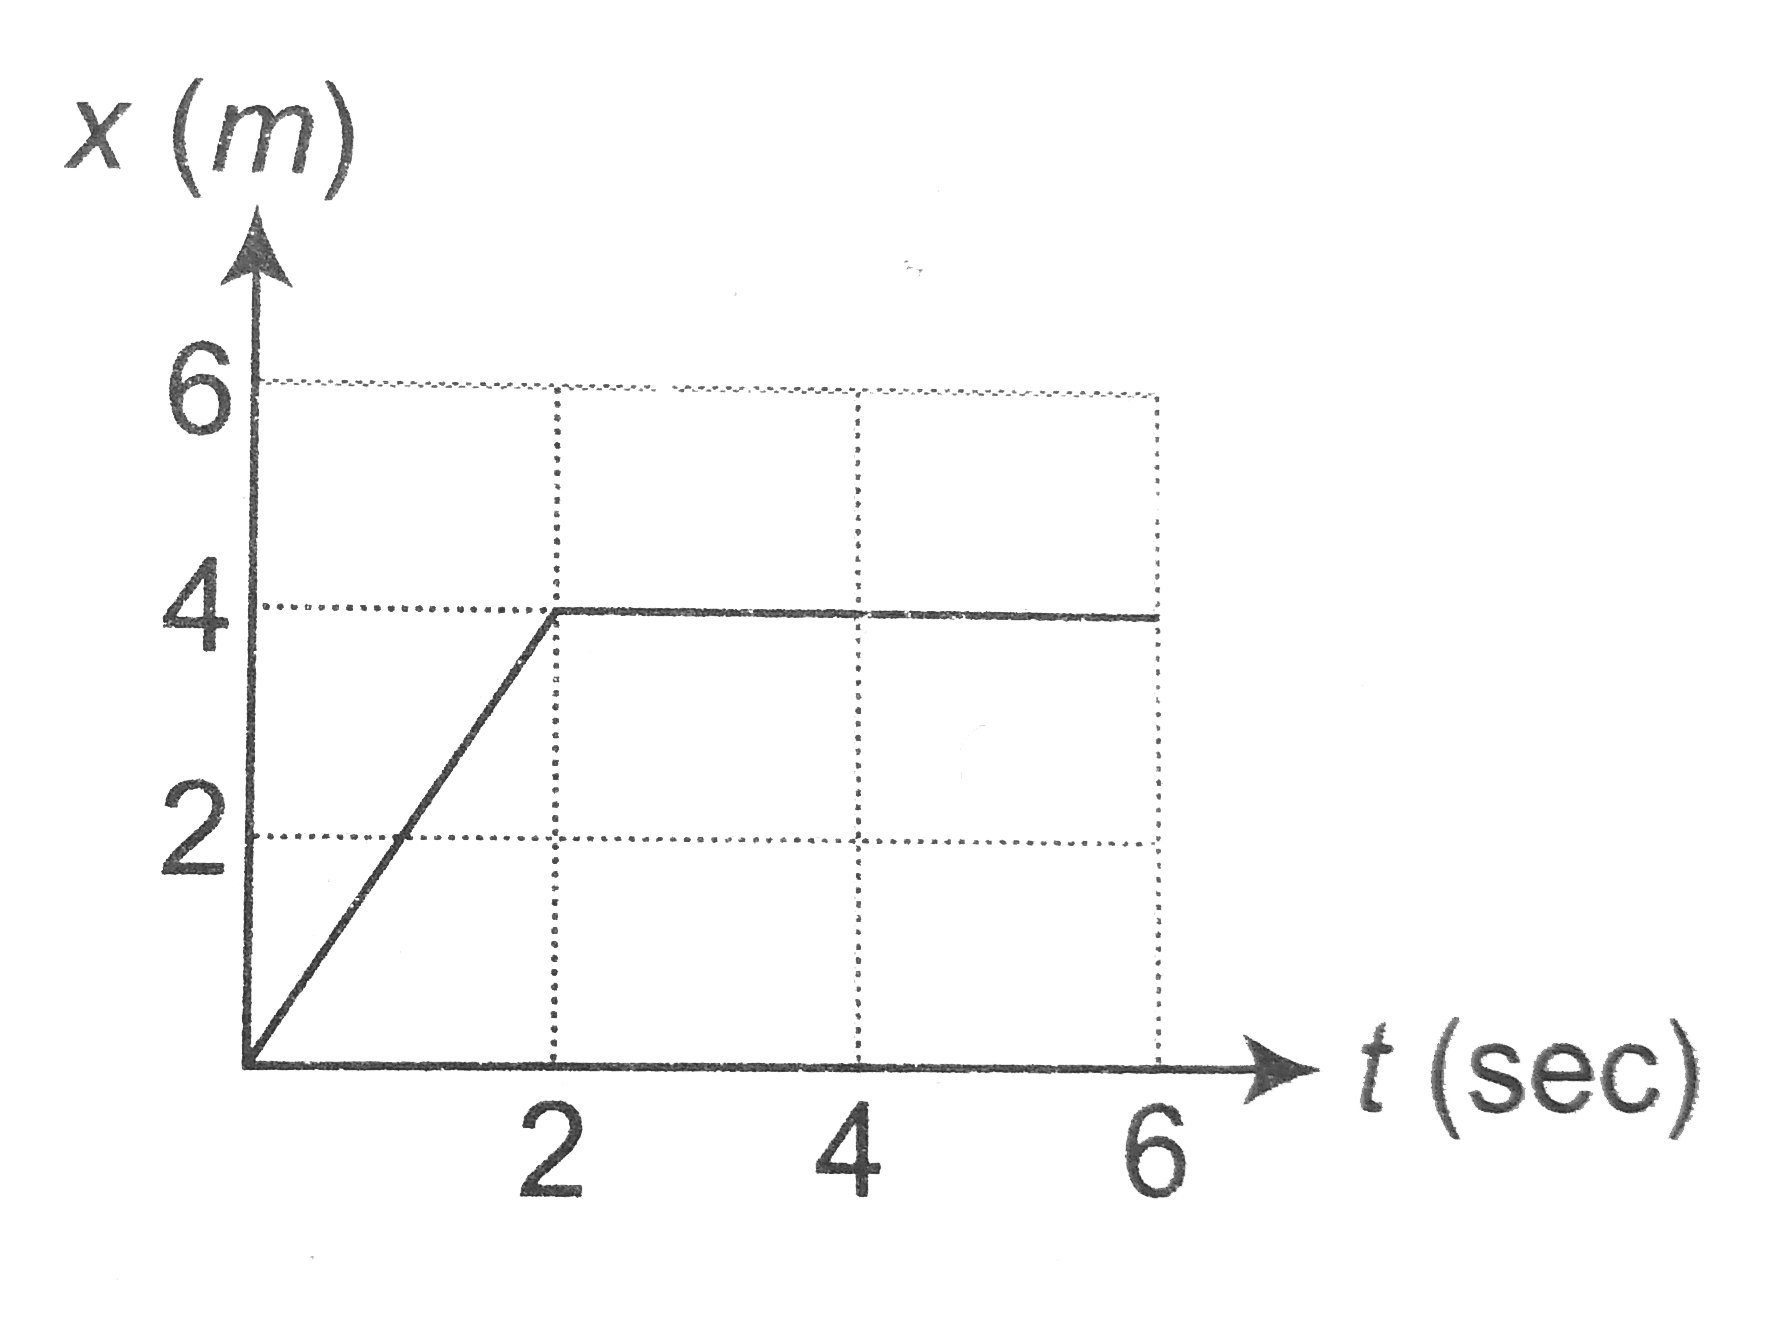
In the figure given below, the position-time graph of a particle of mass 0.1kg is shown. The impuslse at t=2 sec is
 View Solution
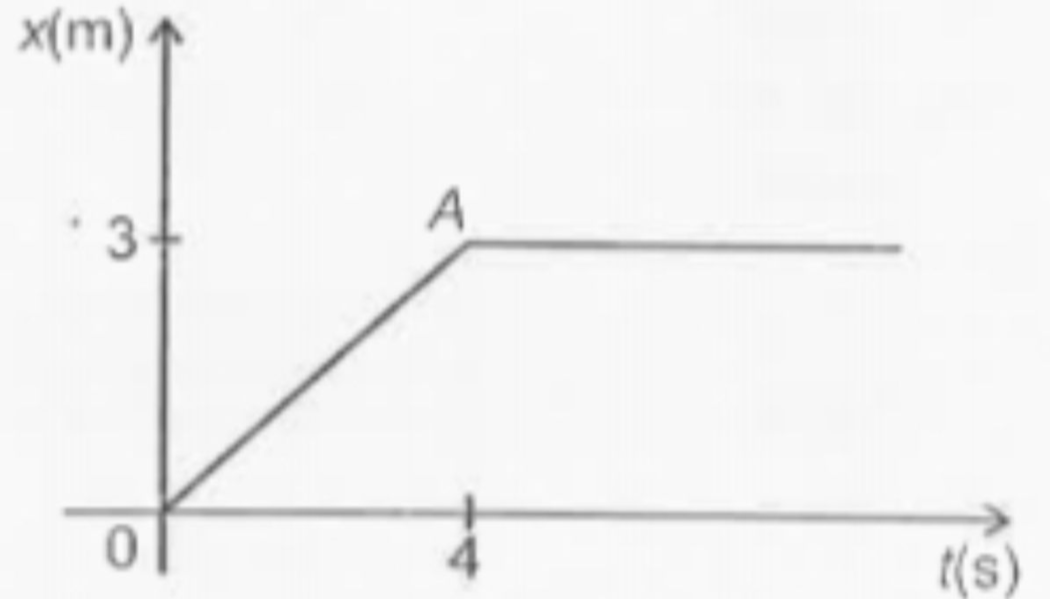
The figure shows the position time graph of a particle of mass 40 kg. What is the force acting on the particle of 0<t<4 s
 View Solution
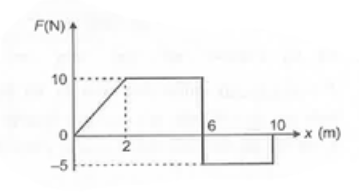
The force versus position (F-x) graph of a particle of mass 2 kg is shown in the figure. If at x = 0 velocity of particle is 2 m/s then velocity of the particle at x = 8 m will be
 View Solution
The velocity − time graph of a particle is as shown in figure
 View Solution
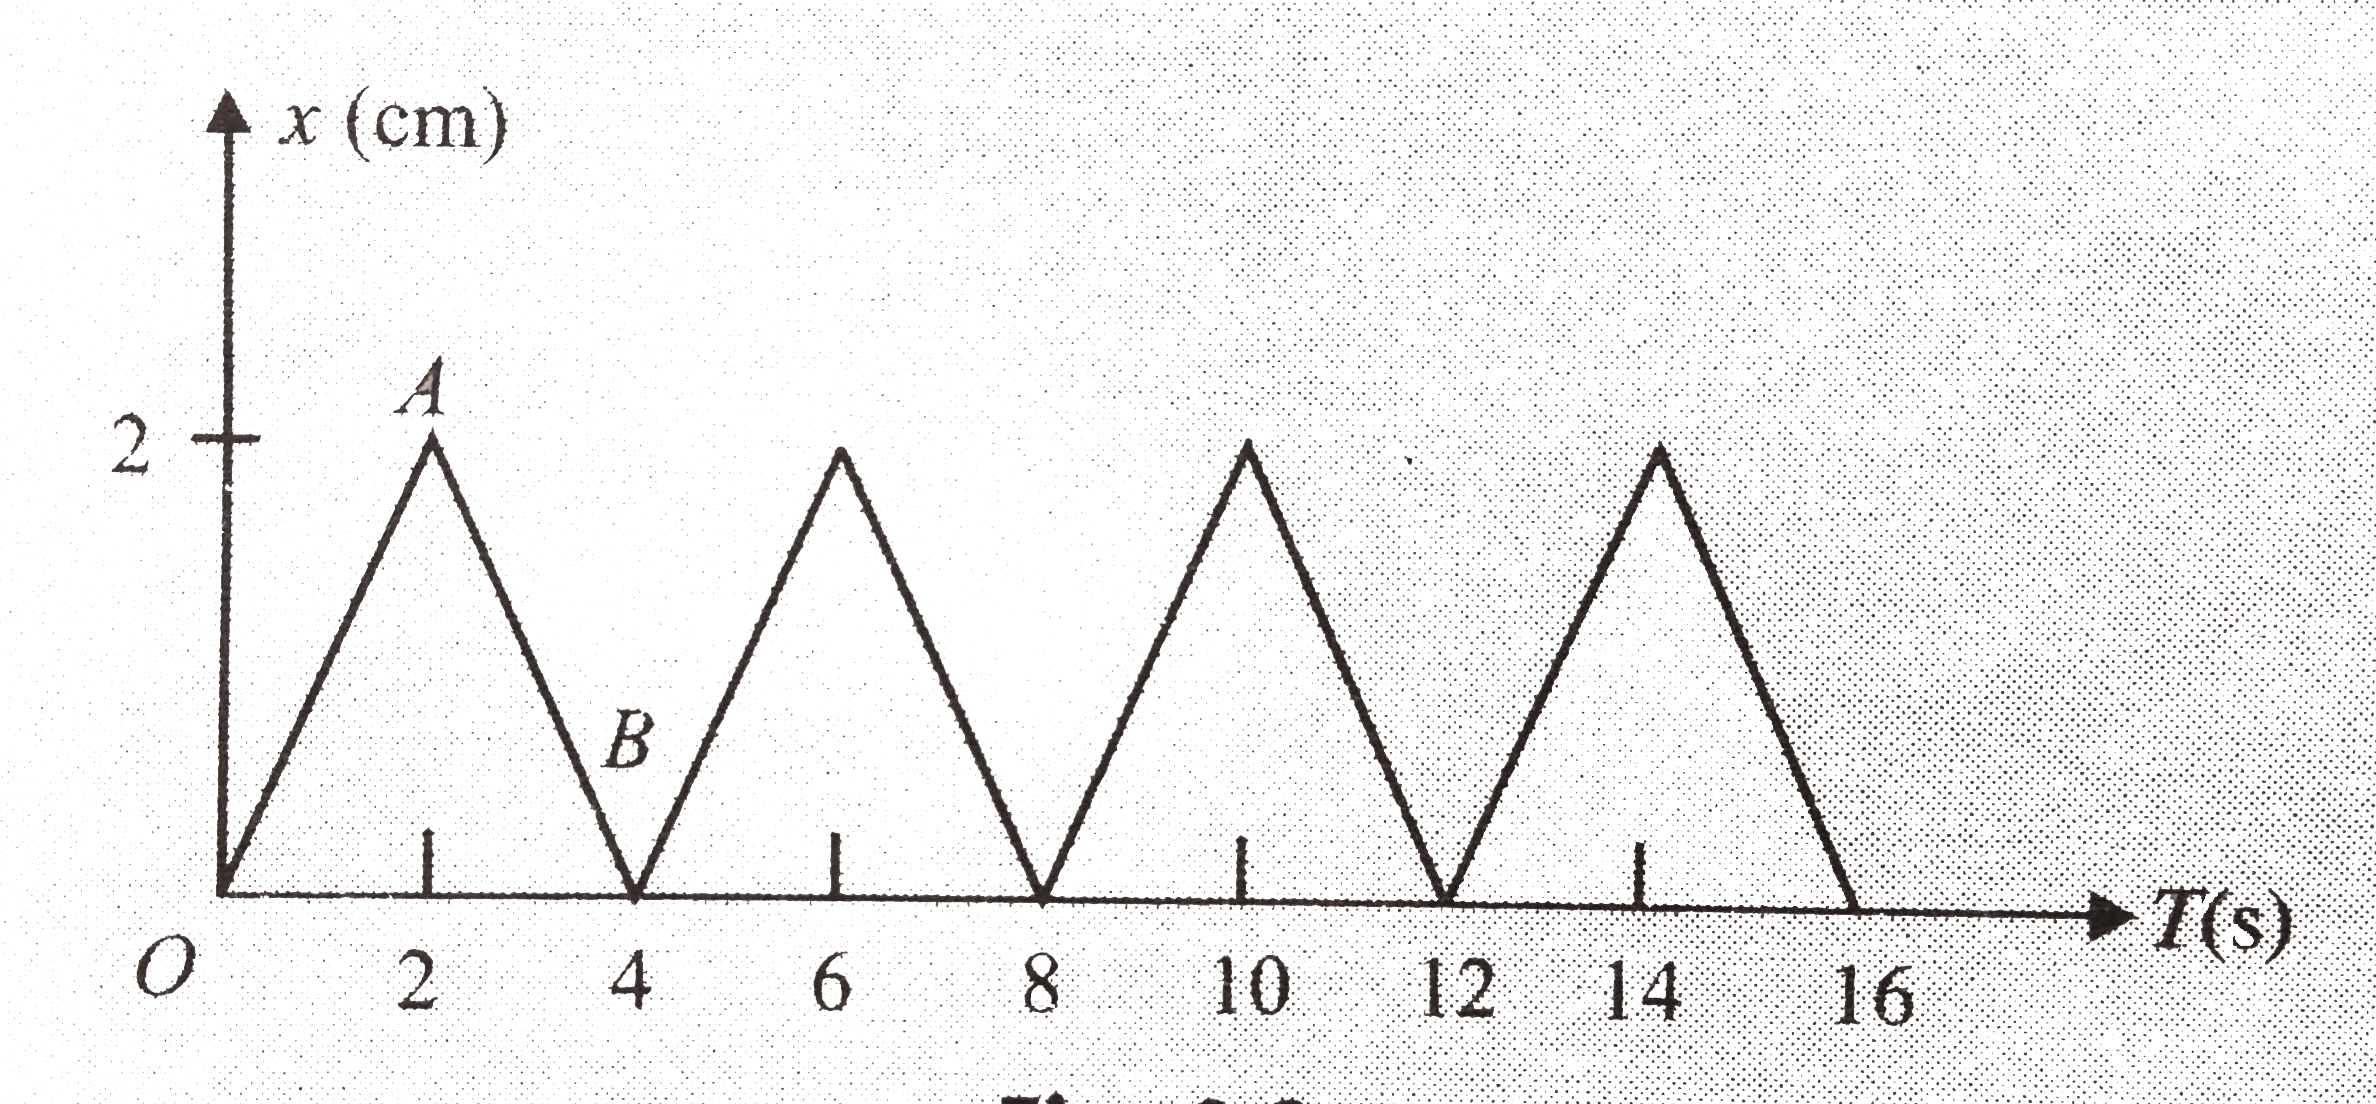
Figure shows the position-time graph of a particle of mass 0.04kg. Suggest a suitable physical context for this motion. What is the time between two consecutive impulses received by the particle? What is the magnitude of each impulse?
 View Solution
Figure shows the position-time graph of a particle of mass 0.04kg. Suggest a suitable physical context for this motion. What is the time between two consecutive impulses received by the particle? What is the magnitude of each impluse?
 View Solution
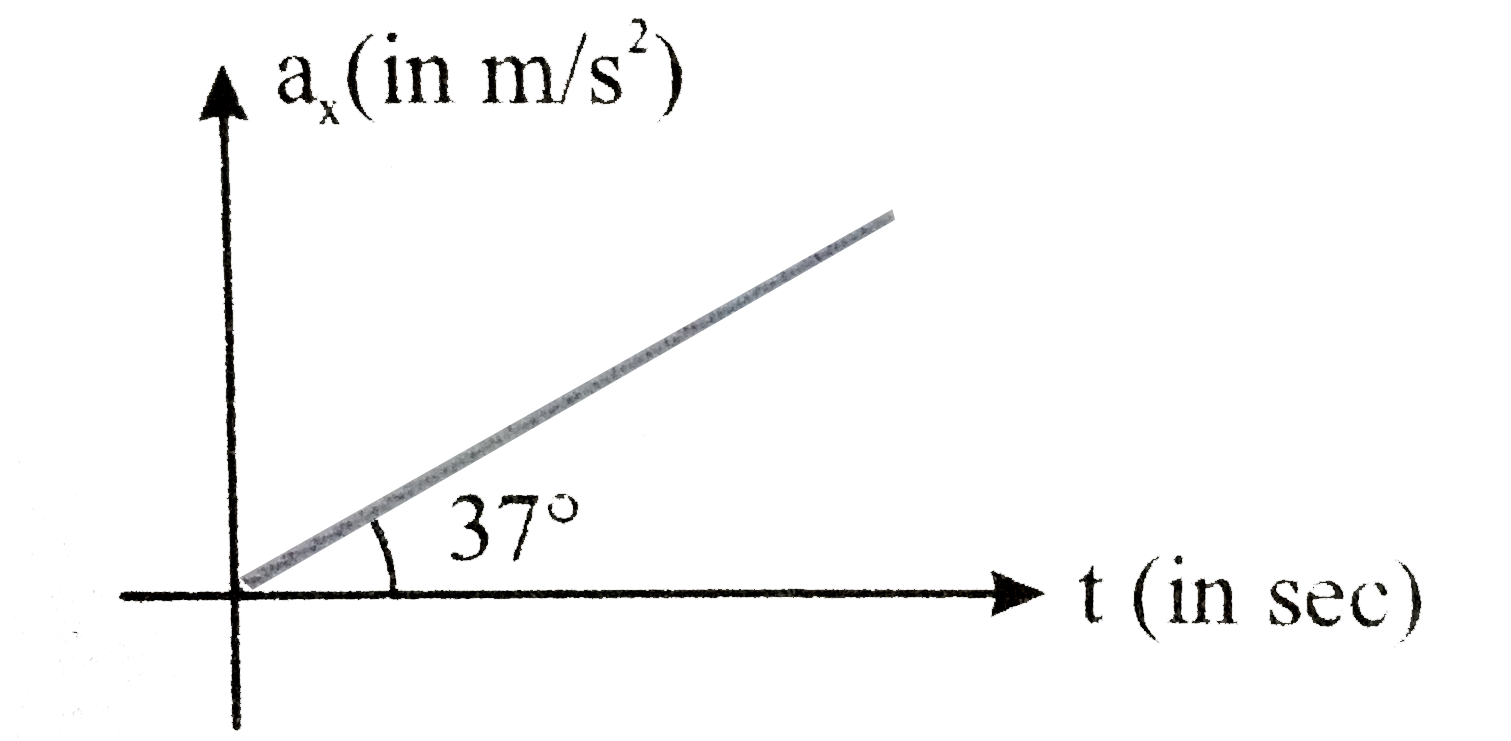
In the figure the variation of components of acceleration of a particle of mass is 1kg is shown w.r.t. time. The initial velocity of the particle is →u=(−3i+4j)m/s. The total work done by the resultant force on the particle in time from t=0 to t=4 seconds is :
 .View Solution
The position - time graph for a particle is shown in fig. Then in the time interval of (0, 6sec)
 View Solution
Position time graph of a particle of mass 2 kg is shown in figrure. Total work done on the particle from t=0 to t=4s is
 View Solution

