The table below gives the flavours of ice cream liked by children (boys and girls) of a society.

Study the table and answer the following questions:
(a) Draw a double bar graph using appropriate scale to represent the above information.
(b) Which flavour is liked the most by the boys?
(c) How many girls are there in all?
(d) How many children like chocolate flavour of ice cream?
(e) Find the ratio of children who like strawberry flavour to vanilla flavour of ice cream.
Step by step video & image solution for The table below gives the flavours of ice cream liked by children (boys and girls) of a society. Study the table and answer the following questions: (a) Draw a double bar graph using appropriate scale to represent the above information. (b) Which flavour is liked the most by the boys? (c) How many girls are there in all? (d) How many children like chocolate flavour of ice cream? (e) Find the ratio of children who like strawberry flavour to vanilla flavour of ice cream. by Maths experts to help you in doubts & scoring excellent marks in Class 7 exams.
Topper's Solved these Questions
- BOOK - NCERT EXEMPLARCHAPTER - DATA HANDLINGEXERCISE - THINK AND DISCUSS3videos
DATA HANDLING
- BOOK - NCERT EXEMPLARCHAPTER - DATA HANDLINGEXERCISE - EXERCISE(TRUE OR FALSE)18videos
DATA HANDLING
- BOOK - NCERT EXEMPLARCHAPTER - COMPARING QUANTITIESEXERCISE - THINK AND DISCUSS24videos
COMPARING QUANTITIES
- BOOK - NCERT EXEMPLARCHAPTER - EXPONENTS AND POWERSEXERCISE - EXERCISE136videos
EXPONENTS AND POWERS
Similar Questions
The table below compares the population (in hundreds) of 4 towns over two years:

Study the table and answer the following questions:
(a) Draw a double bar graph using appropriate scale to depict the above information.
(b) In which town was the population growth maximum?
(c) In which town was the population growth least?View SolutionThe following pictograph shows favourite ice cream flavours of boys in a colony.
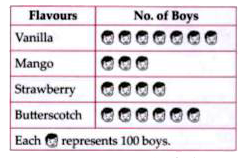
Which flavour is liked least by the boys?View Solution
Knowledge Check
- Question 1 - Select One
In the question above how many do not like ice creams ?
A40B44C148D36 - Question 2 - Select One
In the question above how many do not like ice creams ?
A40B44C148D36 - Question 3 - Select One
Refer the following data table and answer the question.
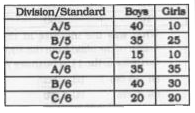
What is the ratio of boys to girls?A26:37B39:28C28:39D37:26
The students of Class VII have to choose one club from Music, Dance, Yoga, Dramatics, Fine arts and Electronics clubs. The data given below shows the choices made by girls and boys of the class. Study the table and answer the questions that follow:

(a) Draw a double bar graph using appropriate scale to depict the above data.
(b) How many students are there in Class VII?
(c) Which is the most preferred club by boys?
(d) Which is the least preferred club by girls?
(e) For which club the difference between boys and girls is the least?
(f) For which club is the difference between boys and girls the maximum?View SolutionGiven below is the data of school going students (boys and girls):

Draw the bar graph to represent the above data.View SolutionFollowing pictograph shows favourite colour of boys in a colony. Study it and answer the following questions.
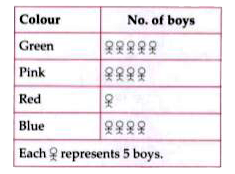
Which colour is most liked by boys ?View SolutionThe given table shows the types of chocolates children like in a society.
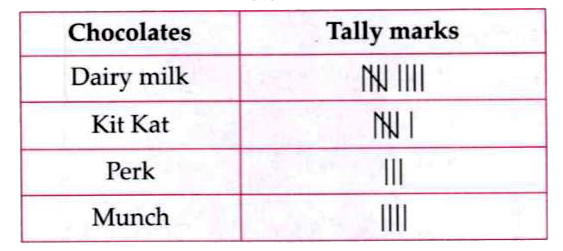
How many more students like Dairy milk than Munch ?View SolutionFollowing pictograph shows favourite colour of boys in a colony. Study it and answer the following questions.
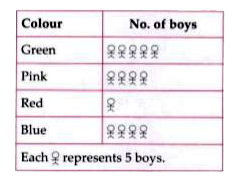
How many more boys liked pink colour than red colour ?View Solution

