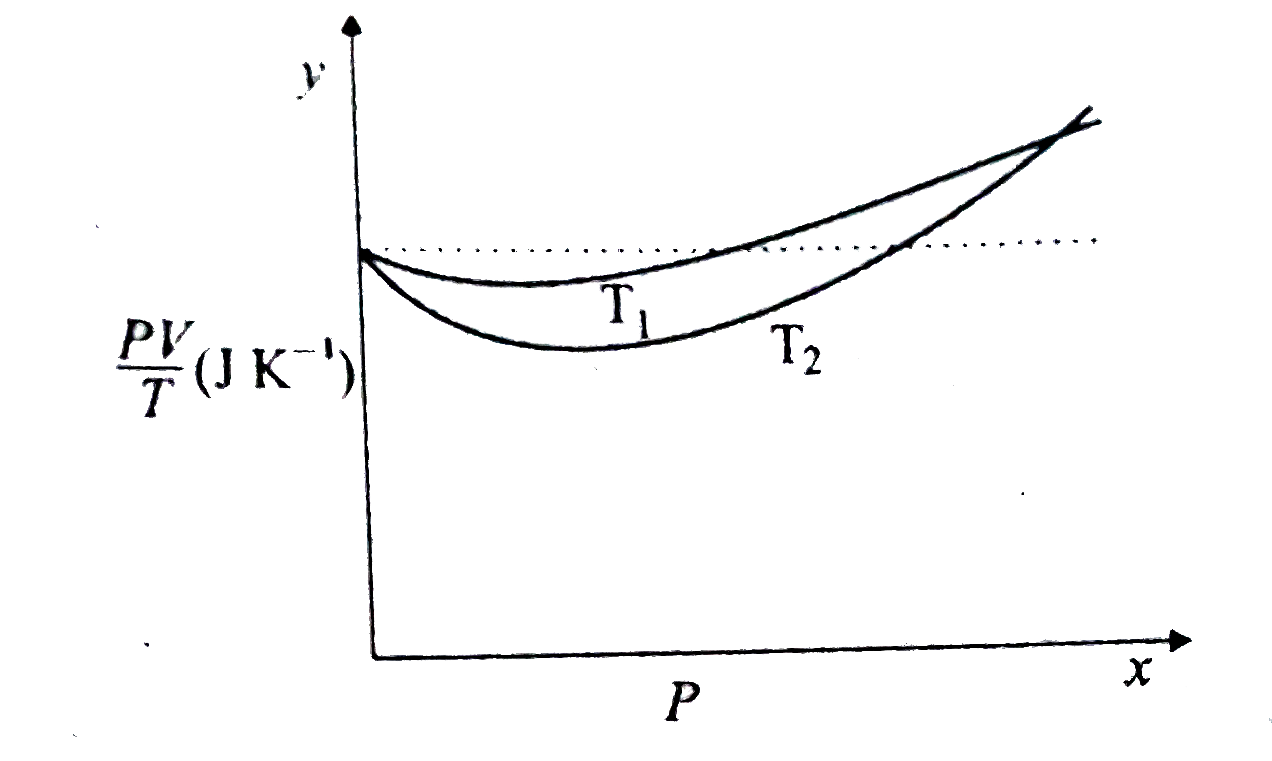
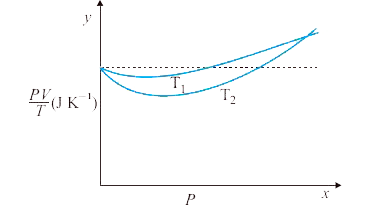
Figure Show plot of PV/T versus P for 1.00×10⁻³ kg of oxygen gas at two different temperatures.
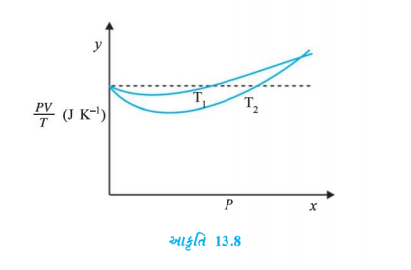
(a) What does the dotted plot signify?
(b) Which is true: T1>T2 or T1<T2?
(c) What is the value of PV/T where the curves meet on the y-axis?
(d) If we obtained similar plots for 1.00×10⁻³ kg of hydrogen, would we get the same value of PV/T at the point where the curves meet on the y-axis? If not, what mass of hydrogen yields the same value of PV/T (for low pressure high temperature region of the plot) ? (Molecular mass of H_(2) = 2.02 u, of O_(2) = 32.0 u, R= 8.31Jmol^(-1)K^(-1).)Solution in Gujrati
The correct Answer is:(i) ideal gas behaviour (ii) T1>T2 (iii) 0.26JK^(-1)
(i) Dotted lines correspond to ideal gas
(ii) T1>T2
(On high temp. real gas behaves as ideal gas)
(iii) PVT=mMR=10−332×10−3×8.314=0.26J/K
Topper's Solved these Questions
- BOOK - ALLEN CHAPTER - GEOMETRICAL OPTICSEXERCISE - EXERCISE - 04 (B)15videos
GEOMETRICAL OPTICS
- BOOK - ALLEN CHAPTER - GEOMETRICAL OPTICSEXERCISE - EXERCISE - 05 (A)73videos
GEOMETRICAL OPTICS
- BOOK - ALLEN CHAPTER - GEOMETRICAL OPTICSEXERCISE - Comprehension Based Questions66videos
GEOMETRICAL OPTICS
- BOOK - ALLEN CHAPTER - CURRENT ELECTRICITYEXERCISE - EX.II66videos
CURRENT ELECTRICITY
- BOOK - ALLEN CHAPTER - GRAVITATIONEXERCISE - EXERCISE 49videos
GRAVITATION
Similar Questions
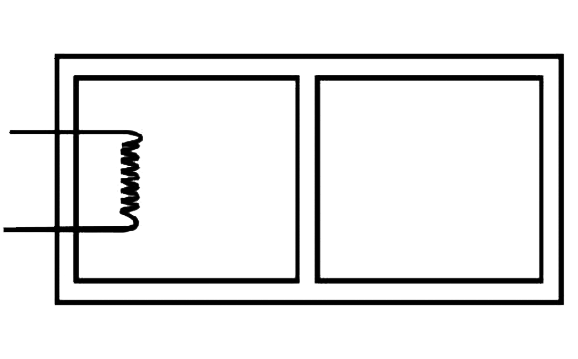
The rectangular box shown in Fig has partition which can slide without friction along the length of the box. Initially each of the two chambers of the box has one mole of a mono-atomic ideal gas (λ=5/3) at a pressure P0, volume V0 and temperature T0. The chamber on the left is slowly heated by an electric heater. The walls of the box and the lead wires of the heater is negligible. The gas in the left chamber expands pushing the partition until the final pressure in both chambers becomes 243P0/32. Determine (i) the final temperature of the gas in each chamber and (ii) the work done by the gas in the right chamber.
 06:25View Solution
An aluminium sphere of 20cm diameter is heated from 0∘C to 100∘C. Its volume changes by (given that the coefficient of linear expanison for aluminium (αAl=23×10−6/0C)
03:51View SolutionA certain amount of ice is supplied heat at a constant rate for 7 min. For the first one minute the temperature rises uniformly with time. Then it remains constant for the next 4 min and again the temperature rises at uniform rate for the last 2 min. Given Sice=0.5cal/g∘C,Lf=80cal/g.
The initial temperature of ice isView SolutionIn the Bohr's model of hy drogen atom, the electron moves around the nucleus in a circular orbit of radius 5×10⁻¹¹m. Its time period is 1.5×10⁻¹⁶s. The current associated with the electron motion is:-
04:04View SolutionAssertion : The difference in the value of acceleration due to gravity at pole and equator is proportional to square of angular velocity of earth.
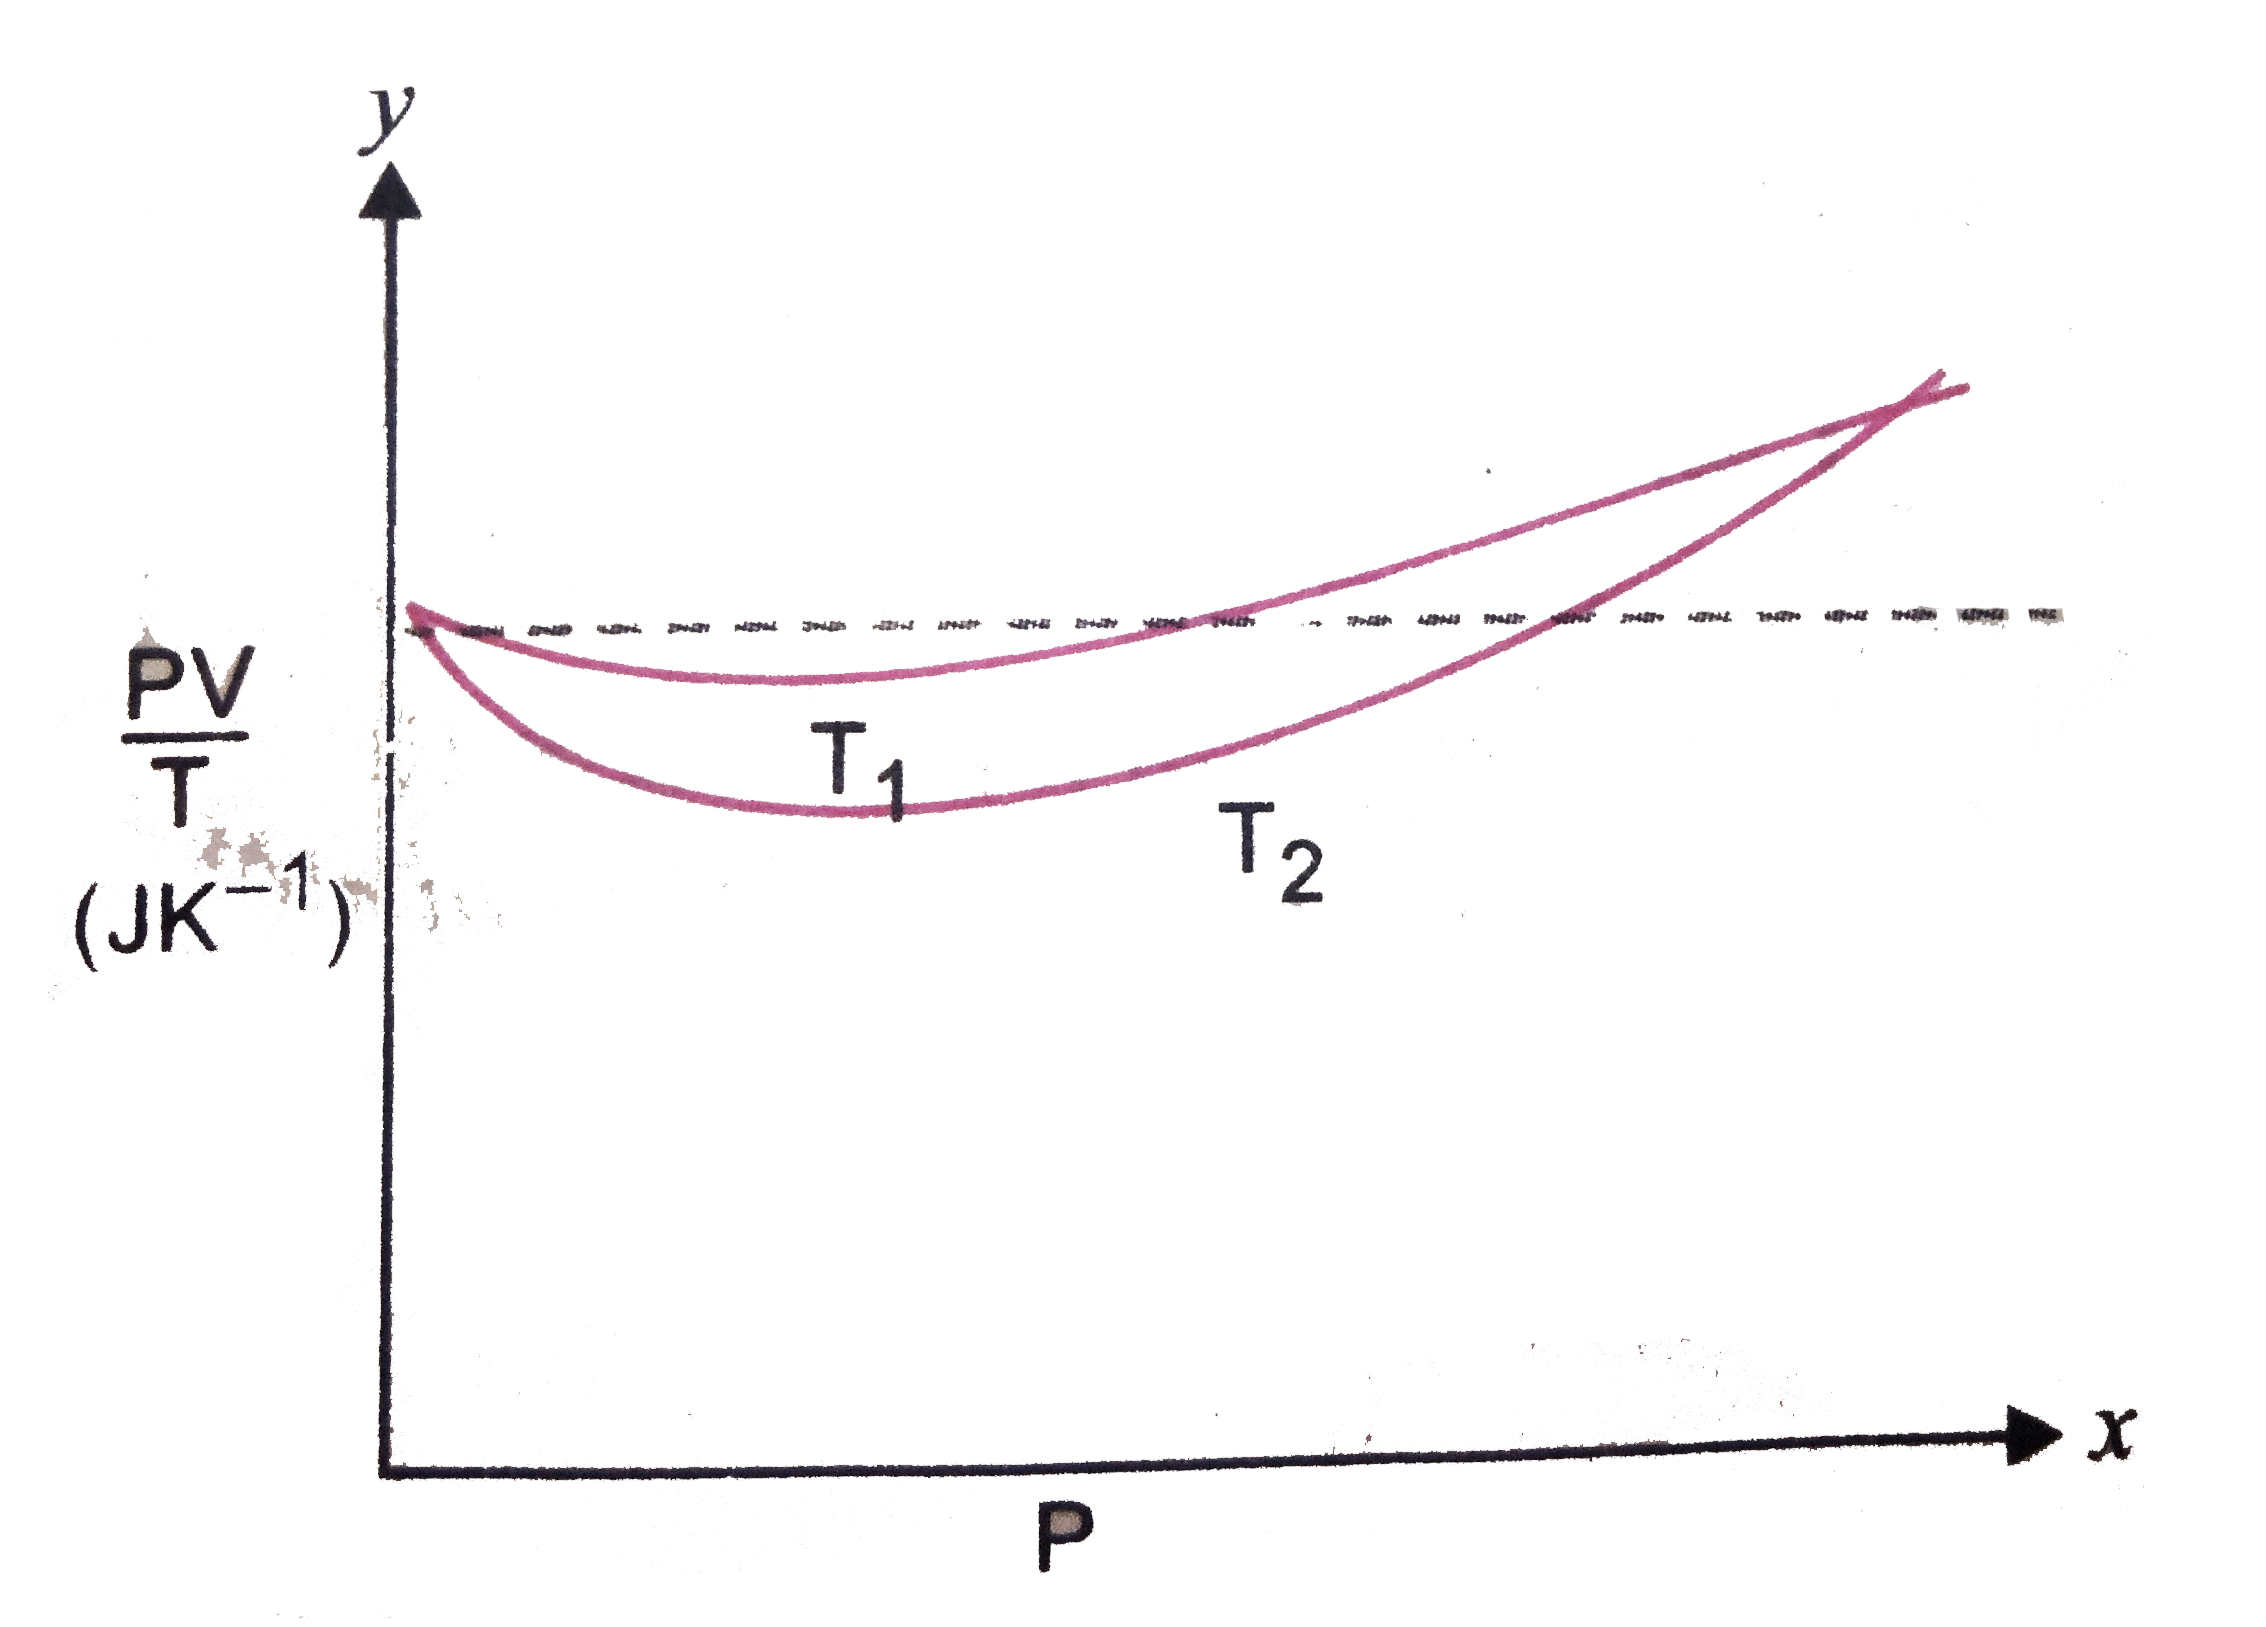
Reason : the value of acceleration due to gravity is minimum at the equator and maximum at the pole.11:14View SolutionFig shows of PV/T versus P for 1.00×10⁻³kg of oxygen gas at two different temperatures.
(a) What does the dotted plot signify ?
(b) Which is true : T1<T2orT2<T1?
( c) What is the value of PV/T where the curves meet on the Y-axis ?
(d) If we obtained similar plot for 1.00×10⁻³kg of hydrogen, would we get the same value of PV/T at the point where the curves meet on the y-axis ? If not, what mass of hydrogen yield the same value of PV/T (for low pressure high temperature region of the plot) ? (Molecular mass of H=2.02u, of O=32.0u,R=8.31Jmol−1K−1
 03:25View Solution
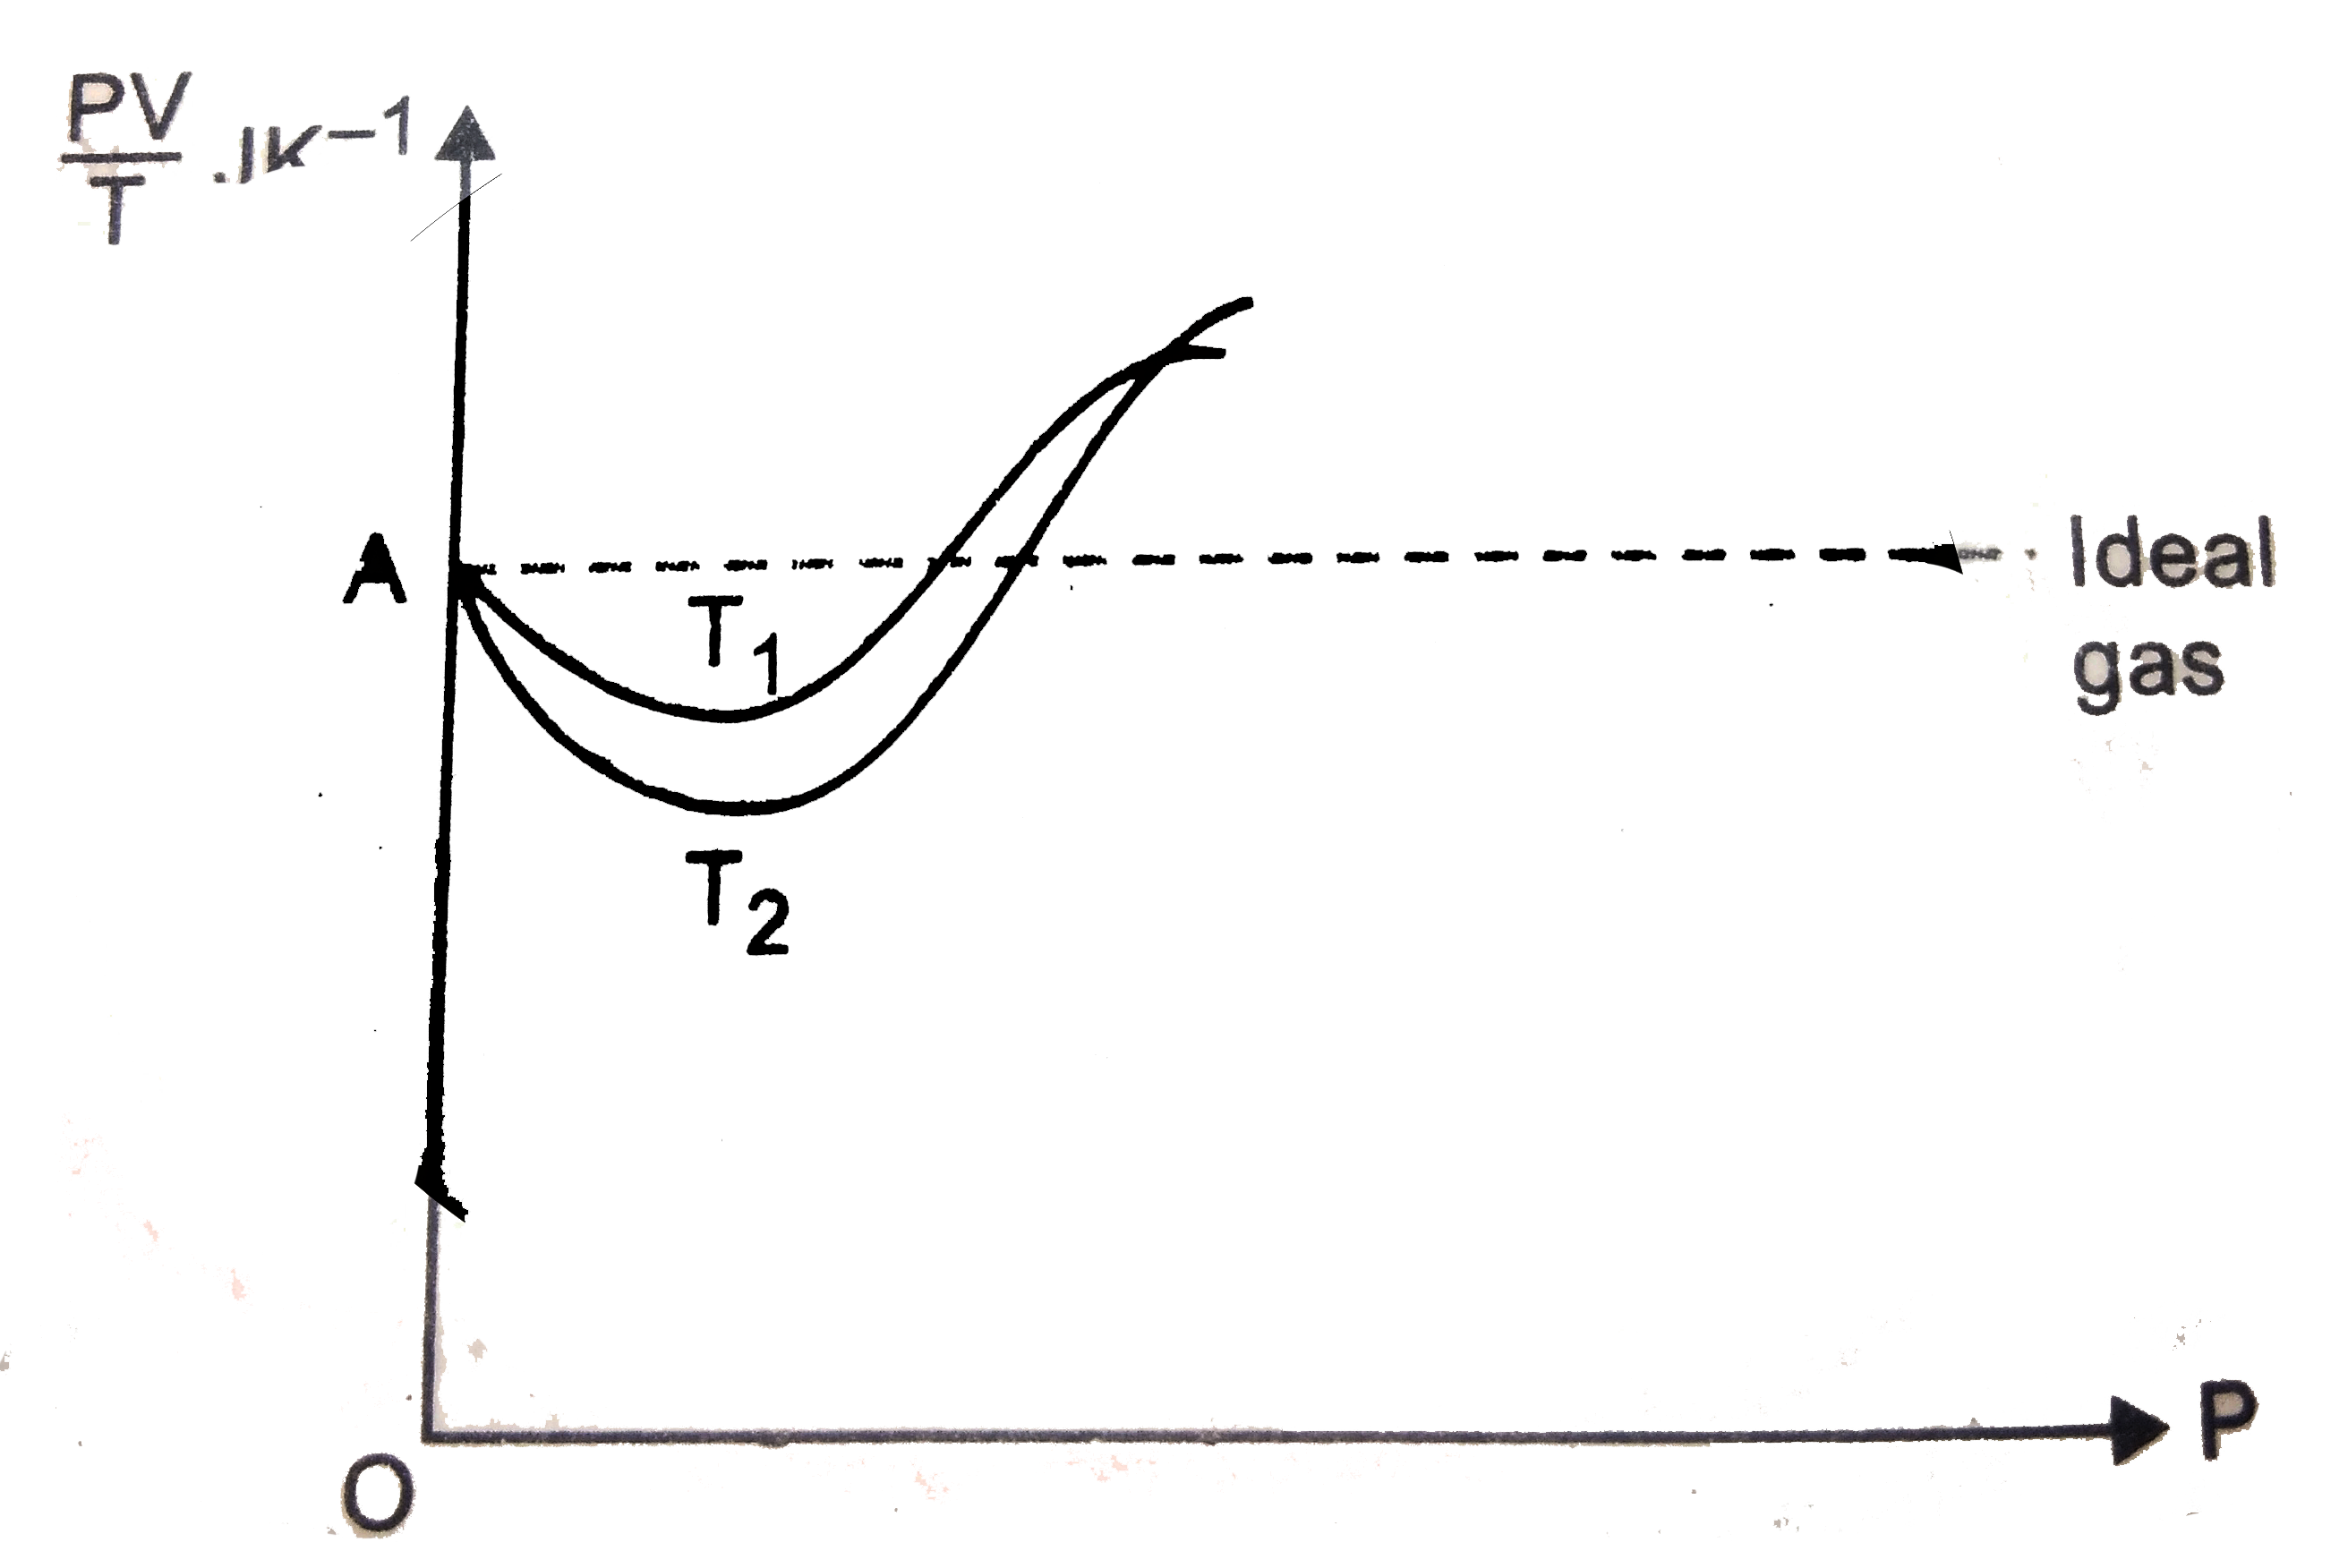
Given is the graph between PVT and P for 1 gm of oxygen gas at two different temperatures T1andT2 Fig. Given, density of oxygen =1.427kgm−3. The value of (PV)/(T) at the point A and the relation between T1andT2 are respectively :
 View Solution
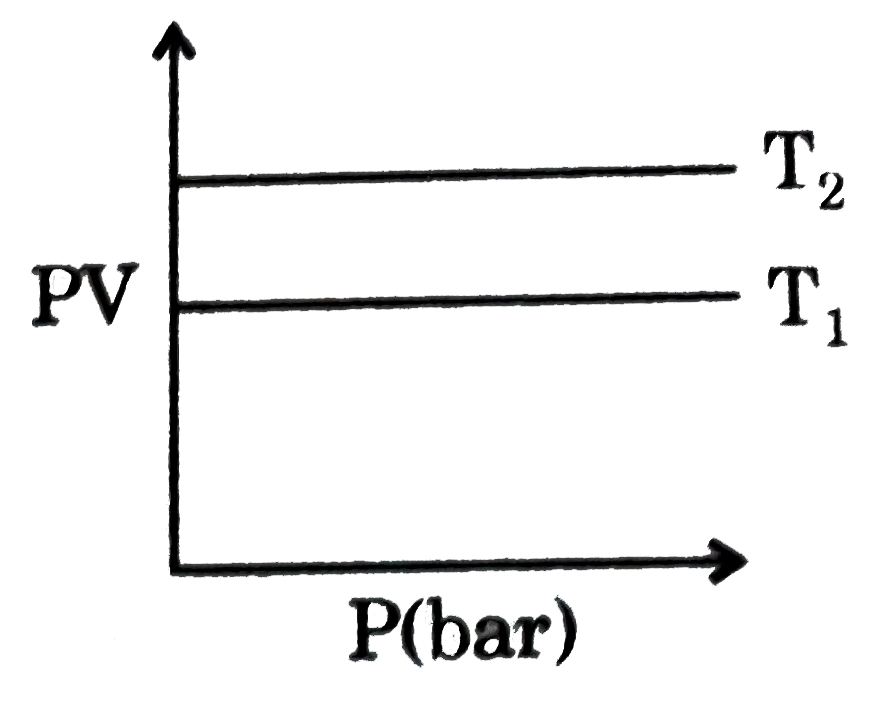
The product of PV is plotted against P at two temperatures T1 and T2 and the result is shown in figure. What is correct about T1 and T2?
 View Solution
Figure shows plot of PV//T versus P"for" 1.00 xx 10^(-3) kg of oxygen gas at two different temperatures. (i) What does the dotted plot signify? (ii) Which is true . T_(1) gt T_(2) "or" T_(1) lt T_(2) ? (iii) What is the value of PV//T where the curves meet on the y-axis?
05:44View Solutionचित्र में ऑक्सीजन के द्रव्यमान के लिए PV/T एवं P में , दो अलग - अलग तापों पर ग्राफ दर्शाये गए है ।
(a ) बिंदुकित रेखा क्या दर्शाती है ?
(b ) क्या सत्य है: T1>T2 अथवा T1<T2?
(c ) y - अक्ष पर जहाँ वक्र मिलते है वहाँ PV/T का मान क्या है ?
( d ) यदि हम ऐसे ही ग्राफ 1.00×10⁻³kg हाइड्रोजन के लिए बनाएँ तो भी क्या उस बिंदु पर जहाँ वक्र y - अक्ष से मिलते है PV/T का मान यही होगा ? यदि नहीं तो हाइड्रोजन के कितने द्रव्यमान के लिए PV/T का मान कम दाब और उच्च ताप के क्षेत्र के लिए वही होगा? (H2 का अणु द्रव्यमान =2.02u,O2 का अणु द्रव्यमान =32.0u,R=8.31Jmol−1K−1)06:58View SolutionGraphs between pressure and volume are plotted at different temperatures . Which of the following isotherms represent Boyle's law as PV = constant ? (T_(1) gt T_(2) gt T_(3))
04:34View SolutionFigure Show plot of PV/T versus P for 1.00×10⁻³ kg of oxygen gas at two different temperatures.
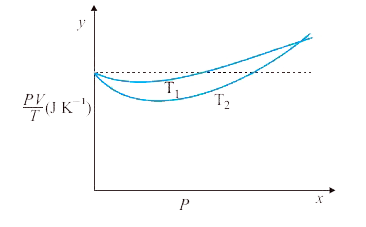
(a) What does the dotted plot signify?
(b) Which is true: T1>T2 or T1<T2?
(c) What is the value of PV/T where the curves meet on the y-axis?
(d) If we obtained similar plots for 1.00×10⁻³ kg of hydrogen, would we get the same value of PV/T at the point where the curves meet on the y-axis? If not, what mass of hydrogen yields the same value of PV/T (for low pressure high temperature region of the plot) ? (Molecular mass of H2=2.02u,ofO2=32.0u,R=8.31Jmol−1K−1.)03:04View SolutionFigure Show plot of PV/T versus P for 1.00×10⁻³ kg of oxygen gas at two different temperatures.
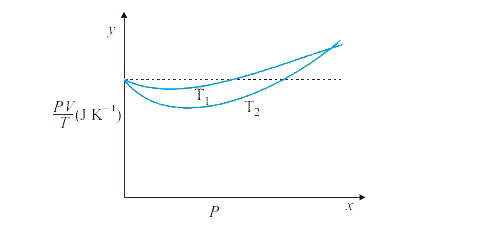
(a) What does the dotted plot signify?
(b) Which is true: T1>T2 or T1<T2?
(c) What is the value of PV/T where the curves meet on the y-axis?
(d) If we obtained similar plots for 1.00×10⁻³ kg of hydrogen, would we get the same value of PV/T at the point where the curves meet on the y-axis? If not, what mass of hydrogen yields the same value of PV/T (for low pressure high temperature region of the plot) ? (Molecular mass of H_(2) = 2.02 u, of O_(2) = 32.0 u, R= 8.31Jmol^(-1)K^(-1).)View SolutionFigure Show plot of PV/T versus P for 1.00×10⁻³ kg of oxygen gas at two different temperatures.
(a) What does the dotted plot signify?
(b) Which is true: T1>T2 or T1<T2?
(c) What is the value of PV/T where the curves meet on the y-axis?
(d) If we obtained similar plots for 1.00×10⁻³ kg of hydrogen, would we get the same value of PV/T at the point where the curves meet on the y-axis? If not, what mass of hydrogen yields the same value of PV/T (for low pressure high temperature region of the plot) ? (Molecular mass of H_(2) = 2.02 u, of O_(2) = 32.0 u, R= 8.31Jmol^(-1)K^(-1).)02:38View SolutionFigure Show plot of PV/T versus P for 1.00×10⁻³ kg of oxygen gas at two different temperatures.

(a) What does the dotted plot signify?
(b) Which is true: T1>T2 or T1<T2?
(c) What is the value of PV/T where the curves meet on the y-axis?
(d) If we obtained similar plots for 1.00×10⁻³ kg of hydrogen, would we get the same value of PV/T at the point where the curves meet on the y-axis? If not, what mass of hydrogen yields the same value of PV/T (for low pressure high temperature region of the plot) ? (Molecular mass of H_(2) = 2.02 u, of O_(2) = 32.0 u, R= 8.31Jmol^(-1)K^(-1).)05:06View SolutionFigure show plot of (PV)/(T) and P for 2gm of oxygen gas at two different temeratures. (i)The significance of dotted line (ii)The relation between T_(1) and T_(2) (iii)The value of (PV)/(T) where the curves meet on the Y-axis.
02:38View Solution

