The given bargraph shows the total no. of students of 5 different schools and no. of boys from each school.
Study the graph carefully and answer the following questions.
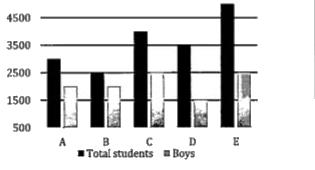
Girls in school A and B together are what percent more/less than girls of school B and D together?
60%
50%
40%
70%
The correct Answer is:C
Step by step video, text & image solution for The given bargraph shows the total no. of students of 5 different schools and no. of boys from each school. Study the graph carefully and answer the following questions. Girls in school A and B together are what percent more/less than girls of school B and D together? by Maths experts to help you in doubts & scoring excellent marks in Class 14 exams.
Updated on:21/07/2023Topper's Solved these Questions
- DATA INTERPRETATIONBOOK - ADDA247CHAPTER - DATA INTERPRETATIONEXERCISE - Prelims Questions (Level-1)
54 Videos
- DATA INTERPRETATIONBOOK - ADDA247CHAPTER - DATA INTERPRETATIONEXERCISE - Prelims Questions (Level-2)
59 Videos
- DATA INTERPRETATIONBOOK - ADDA247CHAPTER - DATA INTERPRETATIONEXERCISE - Previous Year Questions
56 Videos
- BOAT AND STREAM BOOK - ADDA247CHAPTER - BOAT AND STREAM EXERCISE - Previous Year Question
22 Videos
- DATA SUFFICIENCY BOOK - ADDA247CHAPTER - DATA SUFFICIENCY EXERCISE - PREVIOUS YEAR QUESTIONS
25 Videos
Similar Questions
Knowledge Check
The histogram shows the number of students using different modes of transport to commute from residence to school.
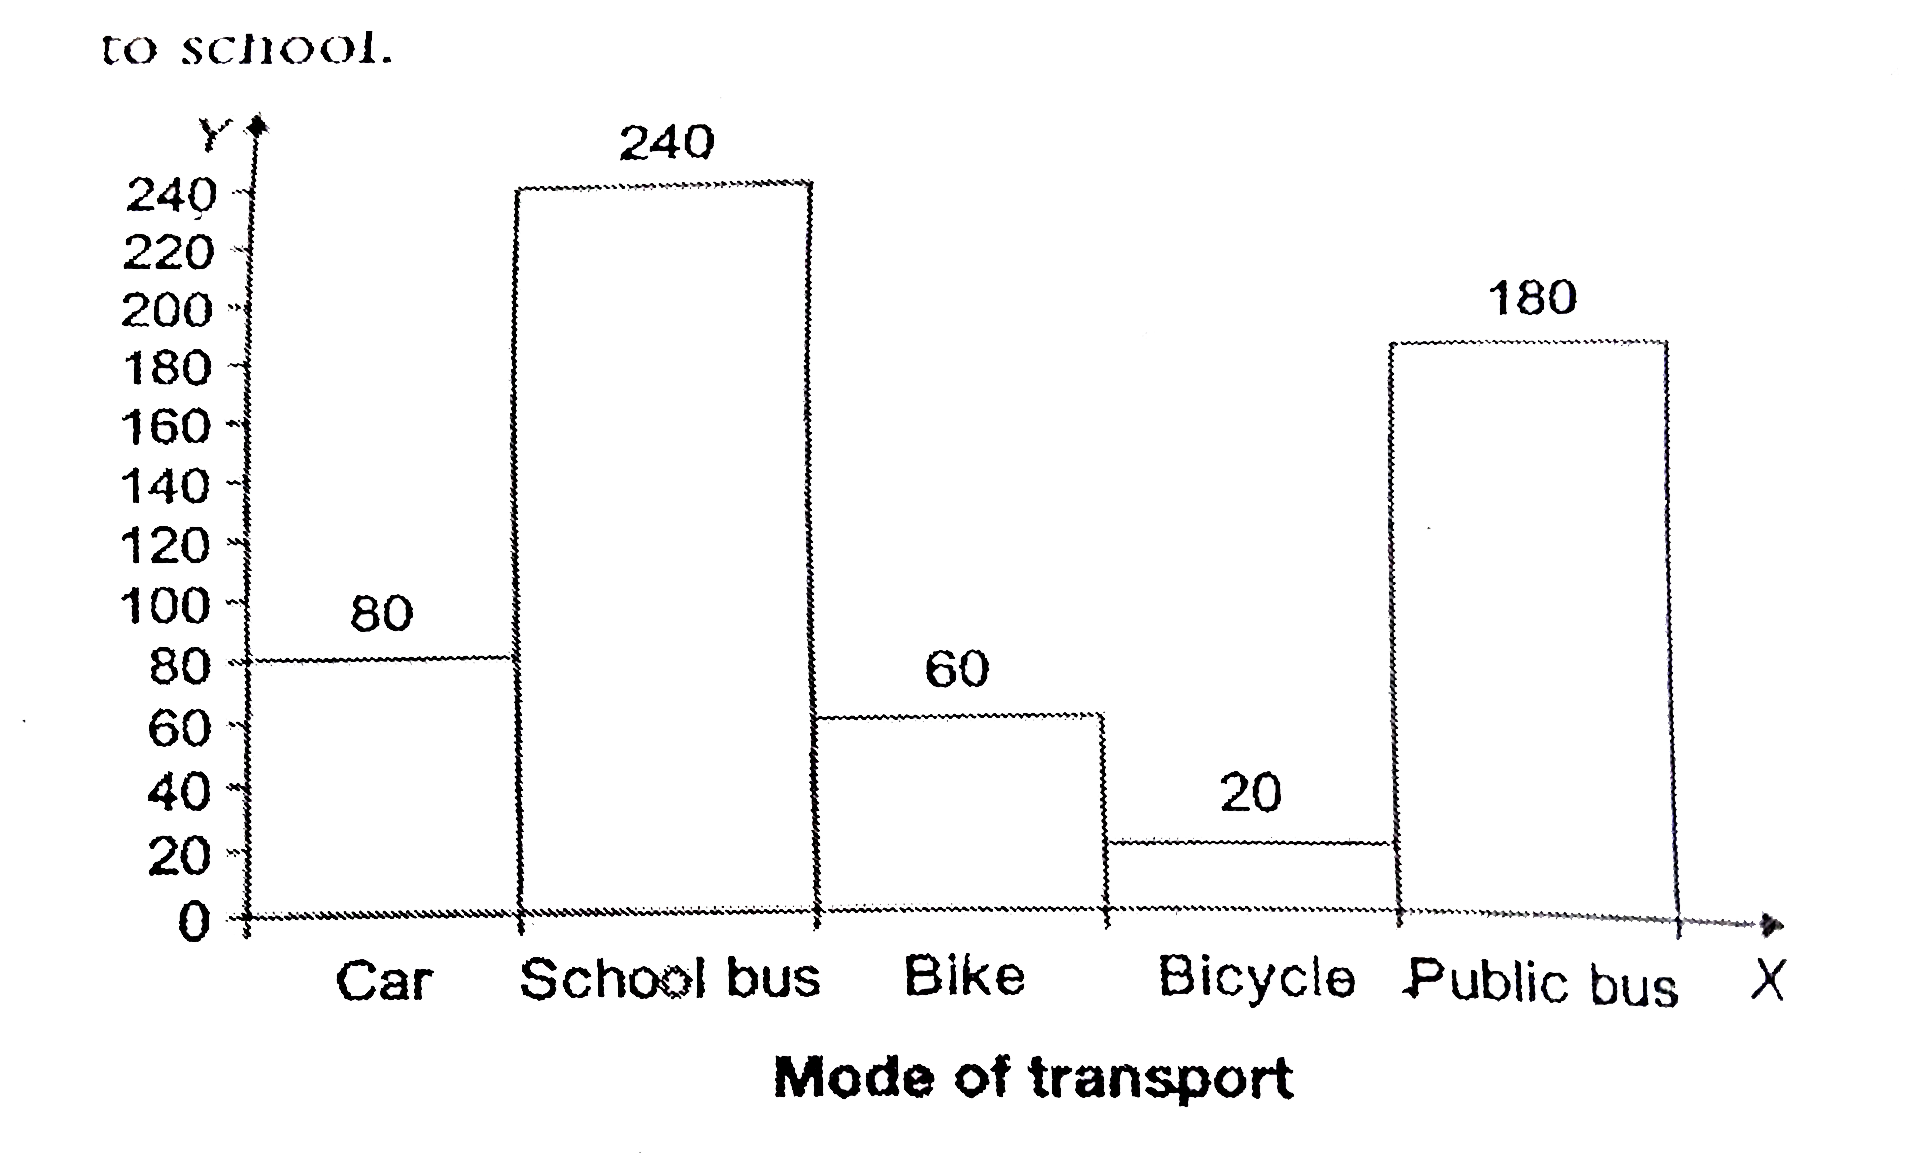
From the bar graph, answer the following question :
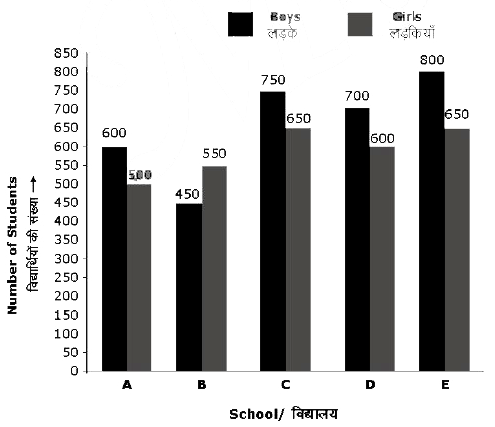
If 6 girls travel to school by bicycle, then how many boys travel by bicycle ?A20B16C14D6Study the following graph carefully and answer the questions that follow
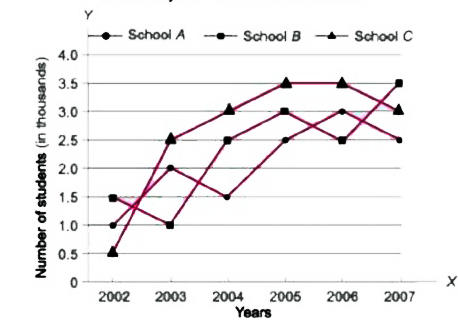
What was the approximate average number of students in school A over all the years together ?A1990B2090C2300D1800The given bar graph represents the number of bodys and girls in five different schools. Study the graph and answer the question that follows
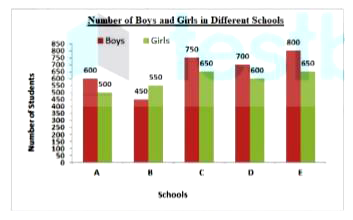
What is the average number of boys in schools A, B, C, D and E?A660B616C596D569
Following table shows the number of students studying in four different schools in four years. Studying the table carefully and answer the questions that follow
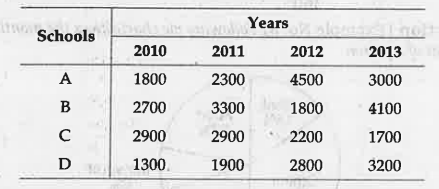
What is the total number of students studying in all the four schools together in the year 2012?
View SolutionStudy the given graph the question that follows
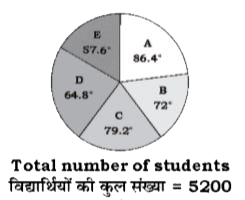
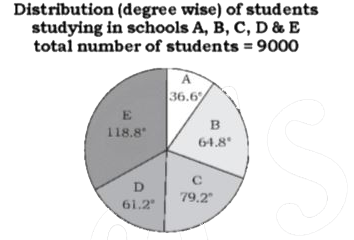
The number of students is school C is what percentage more than the number of students in school B?
View SolutionThe given bar graph shows the number of students of two schools over a period of six years.
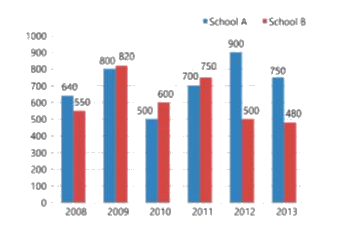
In the bar graph, what is the ratio of the average of the total students from school A to the average of the total students from school B ?
View SolutionThe given bar graph represents the number of boys and girls in five different schools. Study the graph and answer the question that follows
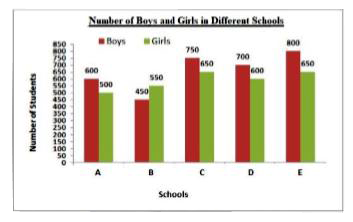
In which school is the percentage of girls the lowest ?
View SolutionStudy the following graph carefully and answer the questions that follow
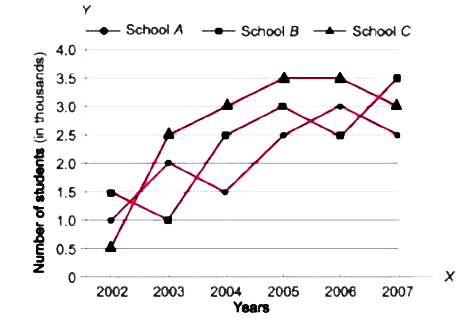
What was the average number of students in all schools together in the year 2006 ?
View Solution

