The given bargraph shows the total no. of students of 5 different schools and no. of boys from each school.
Study the graph carefully and answer the following questions.
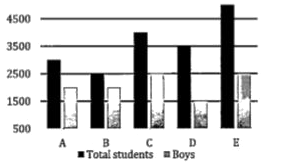
what is the difference between no of boys of school A and B?
500
1000
1500
0
The correct Answer is:D
Step by step video, text & image solution for The given bargraph shows the total no. of students of 5 different schools and no. of boys from each school. Study the graph carefully and answer the following questions. what is the difference between no of boys of school A and B? by Maths experts to help you in doubts & scoring excellent marks in Class 14 exams.
Topper's Solved these Questions
- BOOK - ADDA247CHAPTER - DATA INTERPRETATIONEXERCISE - Prelims Questions (Level-1)54videos
DATA INTERPRETATION
- BOOK - ADDA247CHAPTER - DATA INTERPRETATIONEXERCISE - Prelims Questions (Level-2)59videos
DATA INTERPRETATION
- BOOK - ADDA247CHAPTER - DATA INTERPRETATIONEXERCISE - Previous Year Questions56videos
DATA INTERPRETATION
- BOOK - ADDA247CHAPTER - BOAT AND STREAM EXERCISE - Previous Year Question22videos
BOAT AND STREAM
- BOOK - ADDA247CHAPTER - DATA SUFFICIENCY EXERCISE - PREVIOUS YEAR QUESTIONS25videos
DATA SUFFICIENCY
Similar Questions
Read the bar graph carefully and answer the following questions.
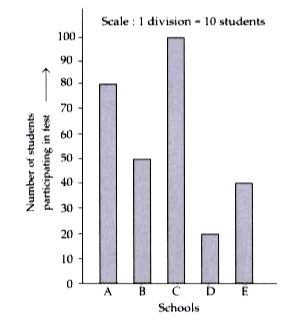 What is the difference between the numbr of students participated from school C and D ?View Solution
Read the following graph carefully and answer the questions given below:

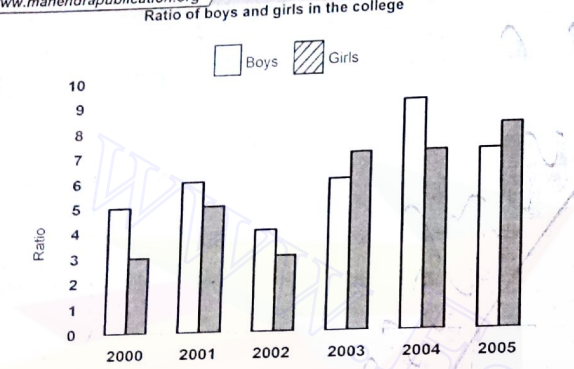
What is the difference between the number of boys and girls in the year 2004 ?View Solution
Knowledge Check
- Question 1 - Select One
The histogram shows the number of students using different modes of transport to commute from residence to school.
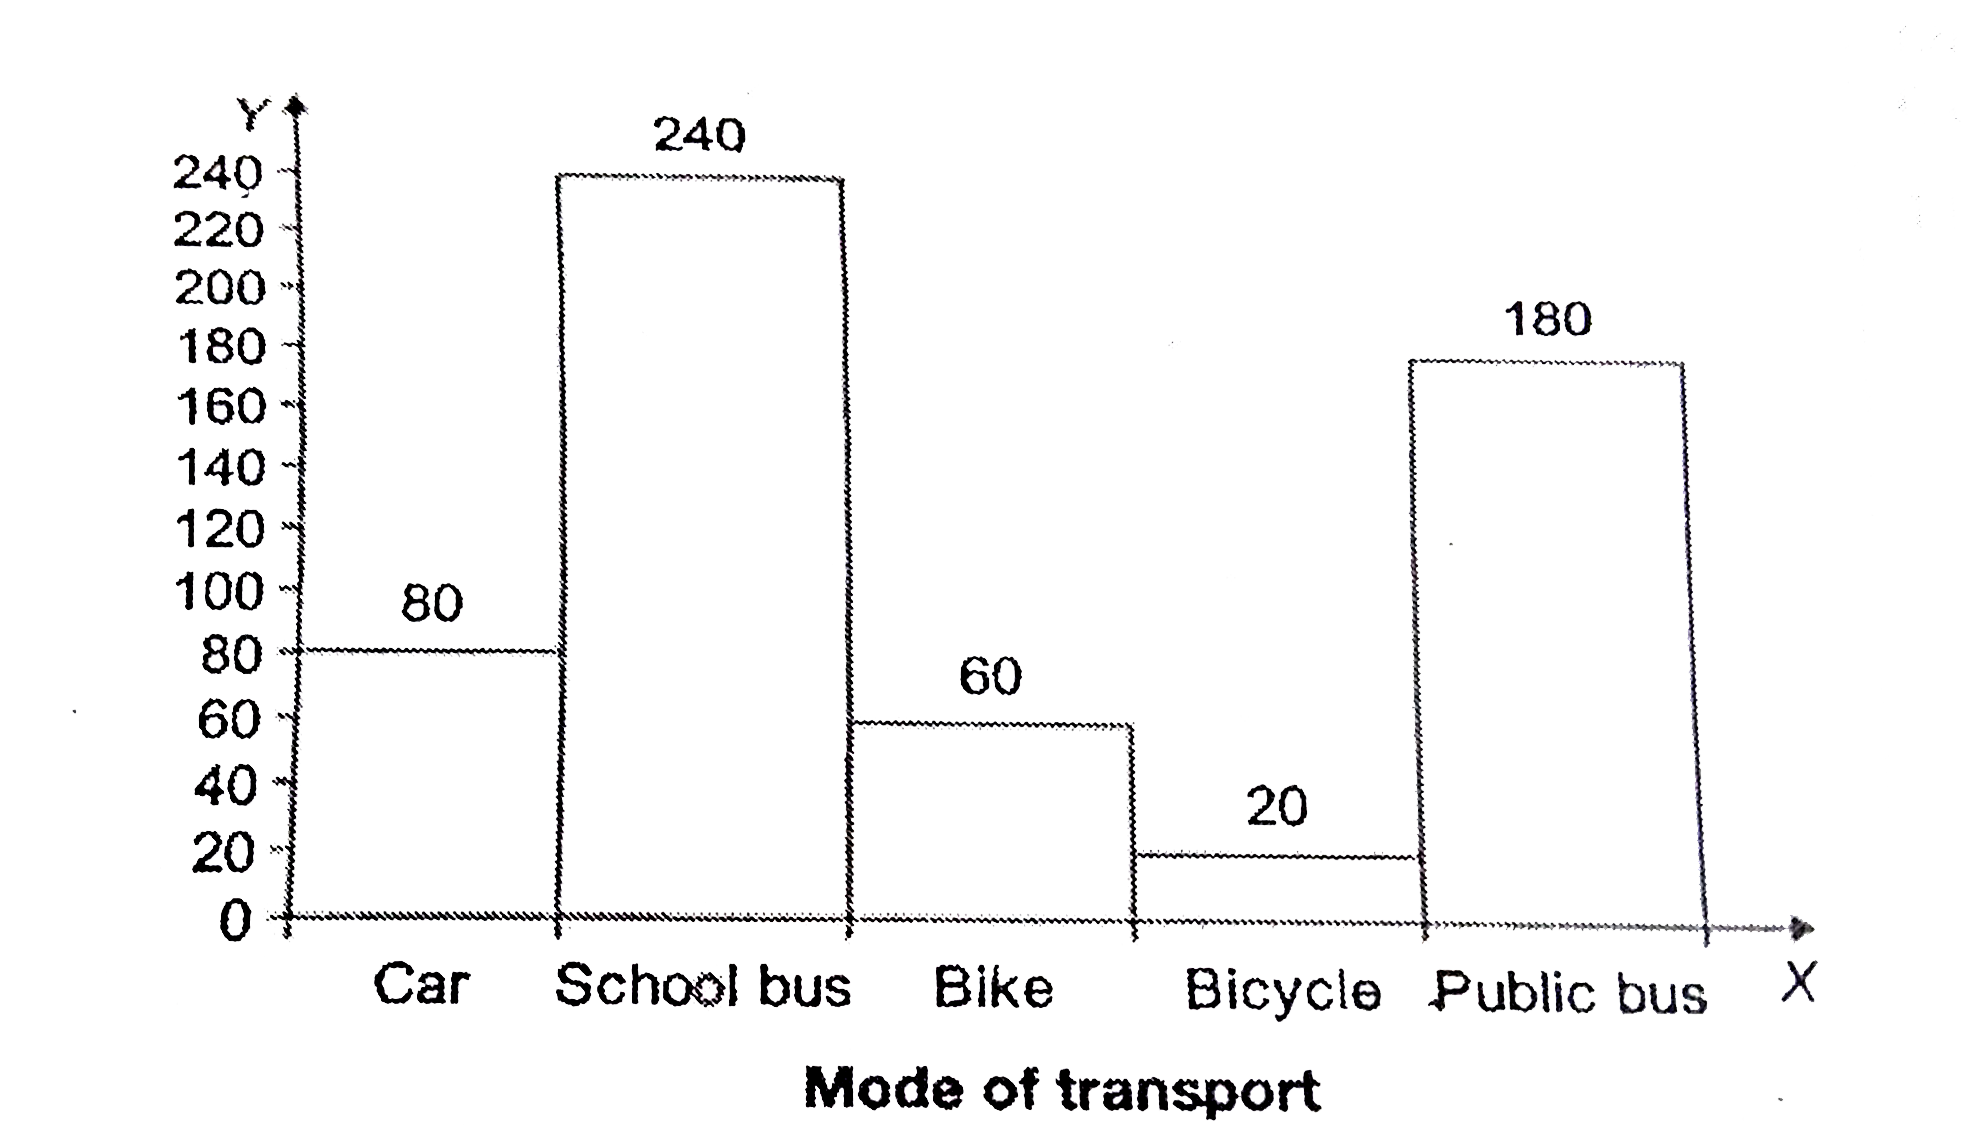
From the bar graph, answer the following question :
What is the total number of pupils who travel by school bus and bike ?A200B320C300D100 - Question 2 - Select One
The given bar graph represents the number of bodys and girls in five different schools. Study the graph and answer the question that follows
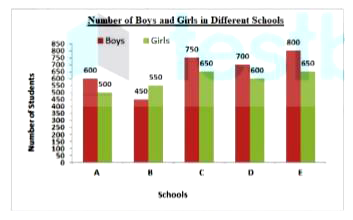
What is the average number of boys in schools A, B, C, D and E?A660B616C596D569 - Question 3 - Select One
The histogram shows the number of students using different modes of transport to commute from residence to school.
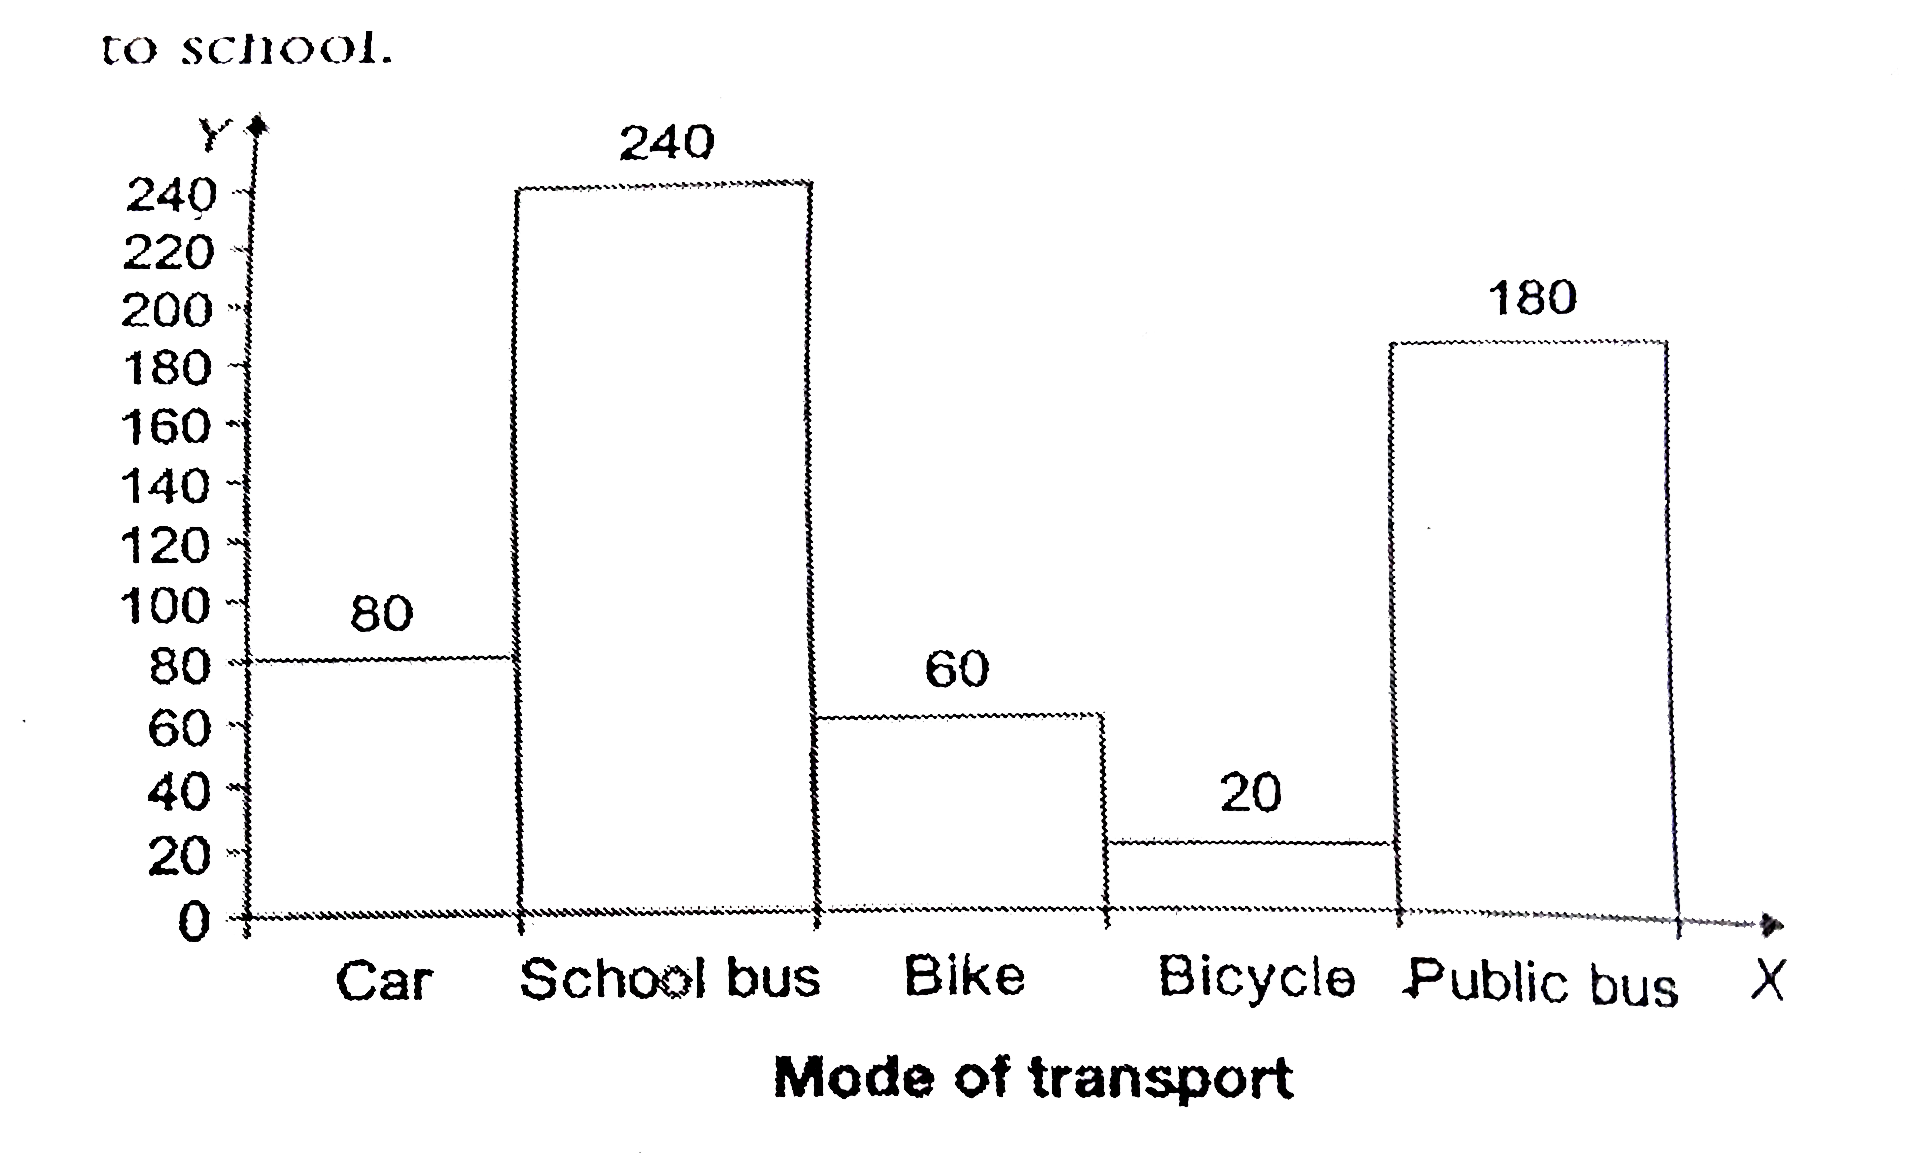
From the bar graph, answer the following question :
If 6 girls travel to school by bicycle, then how many boys travel by bicycle ?A20B16C14D6
Following table shows the number of students studying in four different schools in four years. Studying the table carefully and answer the questions that follow
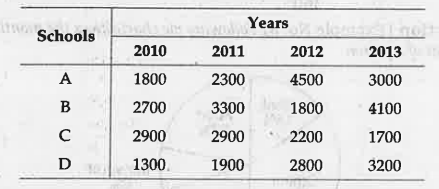
What is the total number of students studying in all the four schools together in the year 2012?View SolutionIn the given bar graph what is the ratio of the total boys and girls in all schools
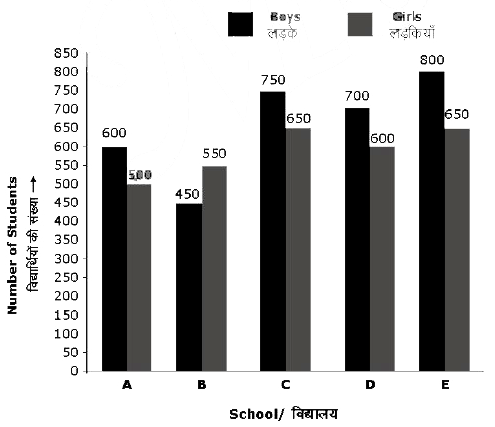 View Solution
The pie-chart given below shows the number of students enrolled in a school in different activities. Total number of students in the school is 1200. Study the chart and answer the questions.

Which two clubs have the enrolment in the ratio of 2:1 ?View SolutionFollowing table shows the number of students studying in four different schools in four years. Studying the table carefully and answer the questions that follow
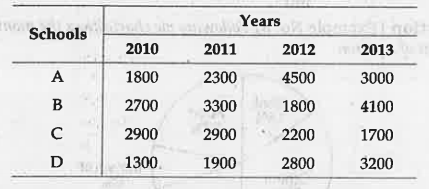
Which scholls has highest number of students in all the years together?View SolutionThe pie-chart shows the percentage-wise distribution of the number of students in five different schools P,Q,R,S and T .
The total number of students in all five schools together is 10,500 .
Study the pie -chart and answer the question .
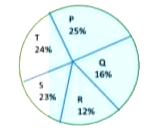
The difference between the central angles corresponding to schools T and R is :View Solution

