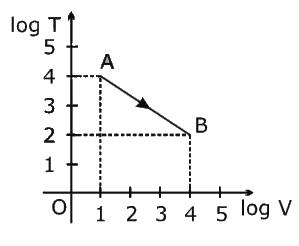
100 mole of an ideal gas at 8.21 atm is heated to show a linear graph between log V (V in litres) and log-T (T in kelvin). The slope of the line is :Solution in Malayalam
V=nRTP=100×0.0821×T8.21=T∴logV=logT or slope of line is 1.
Topper's Solved these Questions
- CHEMICAL THERMODYNAMICS BOOK - BRILLIANT PUBLICATIONCHAPTER - CHEMICAL THERMODYNAMICS EXERCISE - LEVEL-II (Assertion-Reason Type)
18 Videos
- CHEMICAL BONDING AND MOLECULAR STRUCTUREBOOK - BRILLIANT PUBLICATIONCHAPTER - CHEMICAL BONDING AND MOLECULAR STRUCTUREEXERCISE - QUESTION (LEVEL -ll)
42 Videos
- CLASSIFICATION OF ELEMENTS AND PERIODICITY IN PROPERTIESBOOK - BRILLIANT PUBLICATIONCHAPTER - CLASSIFICATION OF ELEMENTS AND PERIODICITY IN PROPERTIESEXERCISE - QUESTIONS (LEVEL-III ( Linked Comprehension Type ))
12 Videos
Similar Questions
Assertion : Heat of neutralisation of HNO3, and NaOH is almost same as that of HCl and KOH.
Reason : Both HNO3, and HCl are strong acids and NaOH and KOH are strong bases. : if both (A) and (R) are correct and (R) is the correct explanation of(A)., If both (A) and (R) are correct, but (R) is not the correct explanation of(A)., If(A) is correct, but (R) is incorrect., If both (A) and (R) are incorrect.
View SolutionWhich of the following species are hypervalent ?
(l) ClO−4
(ll) BF3
(lll) SO2−4
(lV) CO2−3
View SolutionThe heats of formation (ΔH∘f) of the oxides of the third period, sodium to chlorine, are in kJ mol−1

Based on these data, answer the following questions
Which oxide has maximum negative heat of formation per oxygen atom?
View SolutionThe intercept of the line drawm for log P (P in atm) and log (1)/(V) (V in litre) for 1 mole of an ideal gas at 27^(@)C is equal to .
View SolutionFor a closed container containing 100 mol of an ideal gas fitted with movable, frictionless, weightless piston operating such that pressure of gas remain constant at 8.21 atm, which graph repsents correct variation of log V v//s log T where V is in litre and T is in Kelvin ? (R = 0.0821 (atmL)/(molK))
View SolutionFor a closed container containing 10 moles of an ideal gas, at constant pressure of 0.82 atm, which graph correctly represent, variation of log V us log T where volume is in litre and temp. in kelvin :
View Solution10 moles of an ideal gas is subjected to an isochoric process (volume constant) and a graph of log P us log T is plotted where P is in 'atm' and is in 'Kelvin'. If volume of the container is 82.1 ml then calculate sum of a,b and c. Where : a = slope of the graph b = x intercept of the graph c = y intercept of the graph
View SolutionFor an ideal gas, under isobaric condition, a graph between log V vs log T :
View SolutionFigure shows, the adiabatic curve on a log T and log V scale performed on ideal gas. The gas is -

View SolutionTen moles of an ideal gas are filled in a closed vessel. The vessel has cylinder and piston type arrangement and pressure of the gas remains constant at 0.821 atm. Which of the following graph represents correct variation of log V vs log T?
(V = Volume in litre and T = temperature in Kelvin)
View Solutionनिम्न में से कौन - सा आयतन (V), ताप (T) ग्राफ ( आलेख ) , एक वायुमंडलीय दाब पर आदर्श गैस के एक मोल के व्यवहार को प्रदर्शित करता है ?
View SolutionIf a graph is plotted between log V and log T for 2 moles of a gas of constant pressure of 0.0821 atm, then which of the following statements are correct?
View SolutionA graph is ploted between log V and log T for two moles of gas at constant pressure of 0.0821 atm. [V and T are in litres and kelvin]. Then which of the following is/are correct
View SolutionA graph is ploted between log V and log T for two moles of gas at constant pressure of 0.0821 atm. [V and T are in litres and kelvin]. Then which of the following is/are correct
View SolutionFor a closed container containing 100 mol of an ideal gas fitted with movable, frictionless, weightless piston operating such that pressure of gas remain constant at 8.21 atm, which graph repsents correct variation of log Vv/s log T where V is in litre and T is in Kelvin ? (R=0.0821atmLmolK)
View SolutionFor a closed container containing 10 moles of an ideal gas, at constant pressure of 0.82 atm, which graph correctly represent, variation of log V us log T where volume is in litre and temp. in kelvin :
View Solution
