Assertion: The plot of volume (V) versus pressure (P) at constant temperature is a hyperbola in the first quadrant.
Reason: V∝1/P at constant temperature.
If both (A) and (R) are correct and (R) is the correct explanation of (A).
If both (A) and (R) are correct, but (R) is not the correct explanation of (A).
If (A) is correct, but (R) is incorrect.
If (A) is incorrect, but (R) is correct.
The correct Answer is:A, B, C, D
To solve the question, we need to analyze the assertion and the reason provided.
1. Understanding the Assertion:
- The assertion states that the plot of volume (V) versus pressure (P) at constant temperature is a hyperbola in the first quadrant.
- According to Boyle's Law, at constant temperature, the volume of a gas is inversely proportional to its pressure.
2. Understanding the Reason:
- The reason states that V is proportional to 1P at constant temperature.
- This means that if pressure increases, volume decreases, and vice versa, which is a characteristic of an inverse relationship.
3. Mathematical Representation:
- From Boyle's Law, we can express this relationship mathematically as:
PV=k
where k is a constant (nRT, where n is the number of moles, R is the gas constant, and T is the temperature).
4. Graphical Representation:
- Rearranging the equation gives:
V=kP
- This equation represents a hyperbola when plotted on a graph with volume (V) on the y-axis and pressure (P) on the x-axis.
5. First Quadrant:
- The graph will only exist in the first quadrant because both volume (V) and pressure (P) must be positive values for real gases.
6. Conclusion:
- Since the reason correctly explains the assertion, both the assertion and reason are true. Therefore, the correct answer to the question is that the assertion is true and the reason is a correct explanation of the assertion.
Final Answer:
- The assertion is true, and the reason is a correct explanation for the assertion.
- The assertion states that the plot of volume (V) versus pressure (P) at constant temperature is a hyperbola in the first quadrant.
- According to Boyle's Law, at constant temperature, the volume of a gas is inversely proportional to its pressure.
- The reason states that V is proportional to 1P at constant temperature.
- This means that if pressure increases, volume decreases, and vice versa, which is a characteristic of an inverse relationship.
- From Boyle's Law, we can express this relationship mathematically as:
PV=k
where k is a constant (nRT, where n is the number of moles, R is the gas constant, and T is the temperature).
- Rearranging the equation gives:
V=kP
- This equation represents a hyperbola when plotted on a graph with volume (V) on the y-axis and pressure (P) on the x-axis.
- The graph will only exist in the first quadrant because both volume (V) and pressure (P) must be positive values for real gases.
- Since the reason correctly explains the assertion, both the assertion and reason are true. Therefore, the correct answer to the question is that the assertion is true and the reason is a correct explanation of the assertion.
- The assertion is true, and the reason is a correct explanation for the assertion.
Topper's Solved these Questions
- STATES OF MATTERBOOK - CENGAGE CHEMISTRY ENGLISHCHAPTER - STATES OF MATTEREXERCISE - Exercises (Integer)
10 Videos
- STATES OF MATTERBOOK - CENGAGE CHEMISTRY ENGLISHCHAPTER - STATES OF MATTEREXERCISE - Archives (Multiple Correct)
3 Videos
- STATES OF MATTERBOOK - CENGAGE CHEMISTRY ENGLISHCHAPTER - STATES OF MATTEREXERCISE - Exercises (Single Correct)
85 Videos
- SOME BASIC CONCEPTS AND MOLE CONCEPTBOOK - CENGAGE CHEMISTRY ENGLISHCHAPTER - SOME BASIC CONCEPTS AND MOLE CONCEPTEXERCISE - Archives Subjective
11 Videos
- STOICHIOMETRYBOOK - CENGAGE CHEMISTRY ENGLISHCHAPTER - STOICHIOMETRYEXERCISE - Archives Subjective
33 Videos
Similar Questions
Graph between speed v of sound in air and pressure P at a constant temperature is given by
View SolutionWhat is the type of graph between log P and log V at constant temperature?
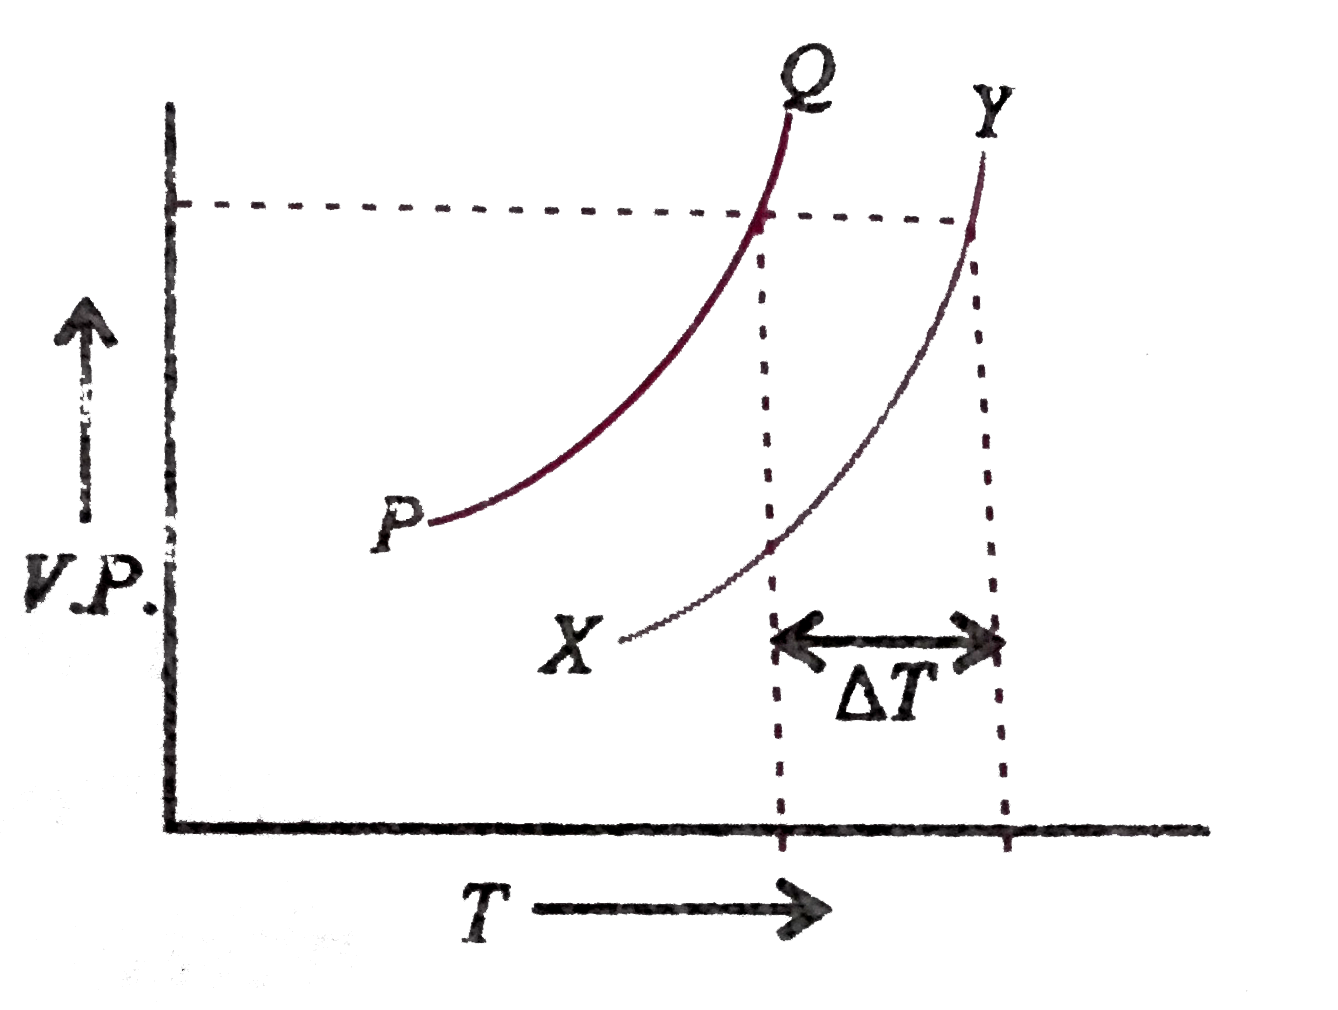
View SolutionIn the graph plotted between vapour pressure (V.P.) and temperature (T),

View SolutionThe graph betwene P and V at constant temperature should look like
View SolutionThe slope of the plot between pV and p at constant temperature is
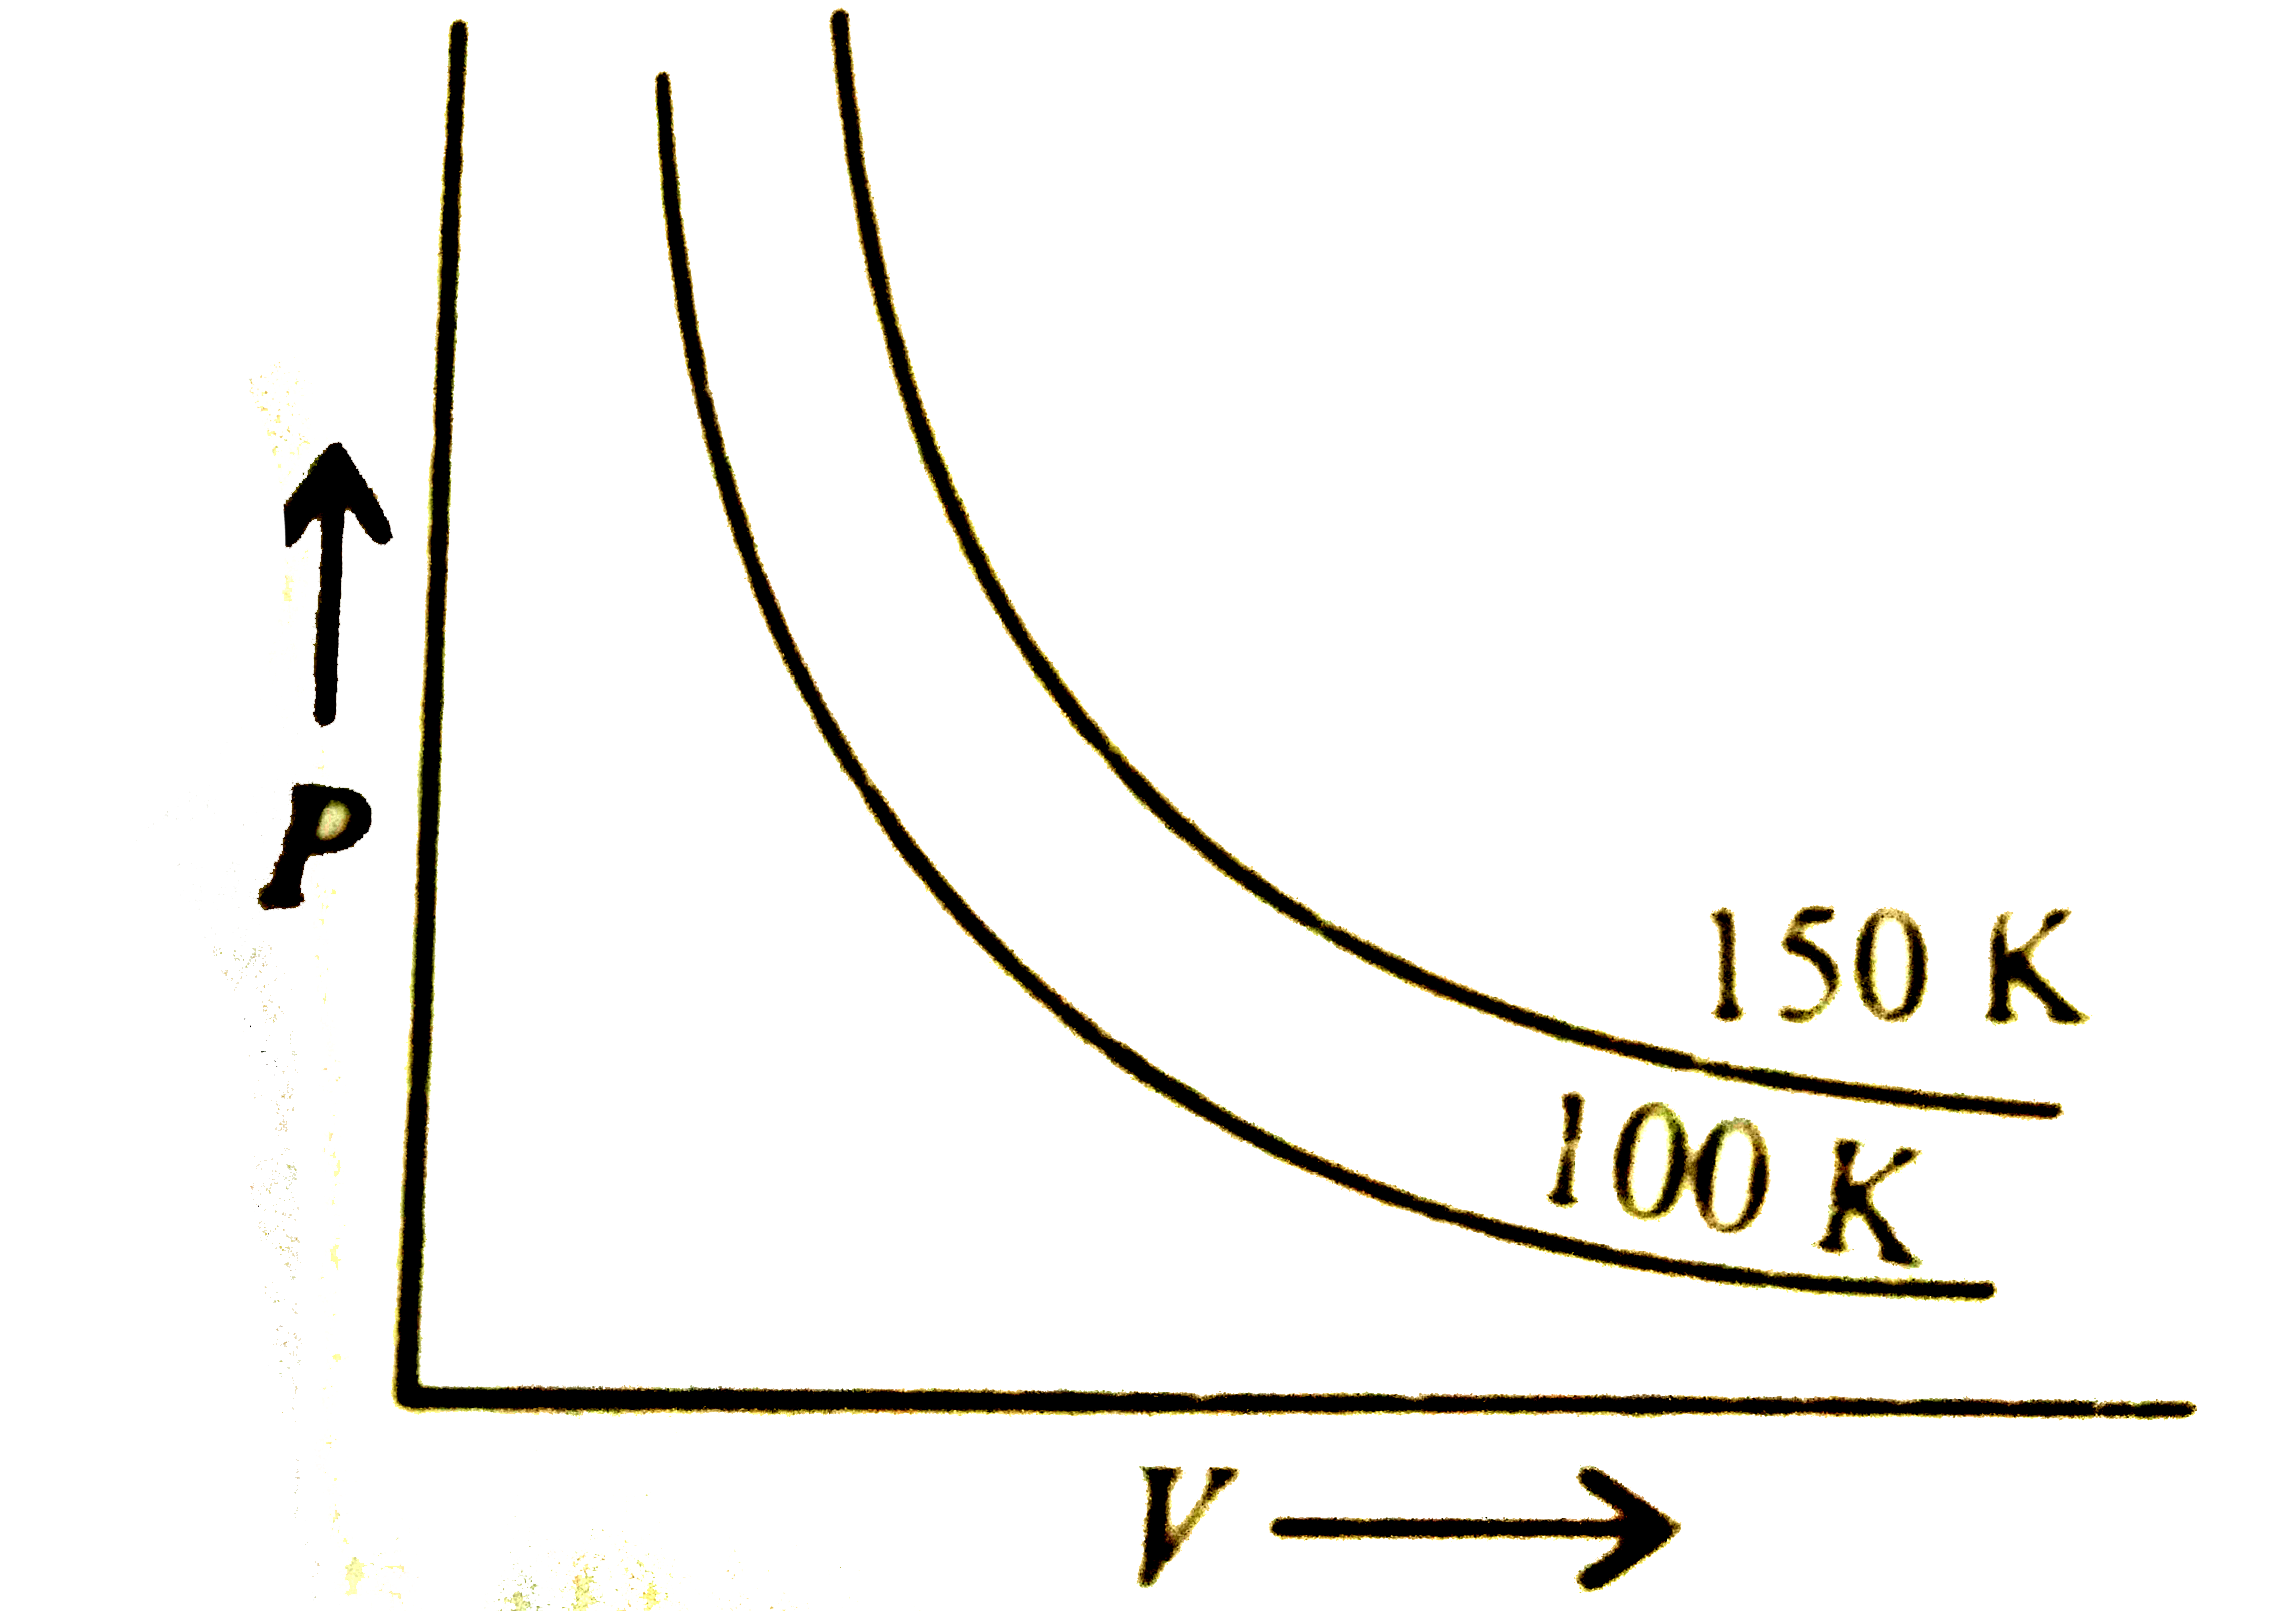
View SolutionA graph is plotted between pressure and volume at different temperatures . On the basis of the graph what changes will you observe in the volume if
(i) the pressure is increased at constant temperature .
(ii) the temperature is decreased at constant pressure .

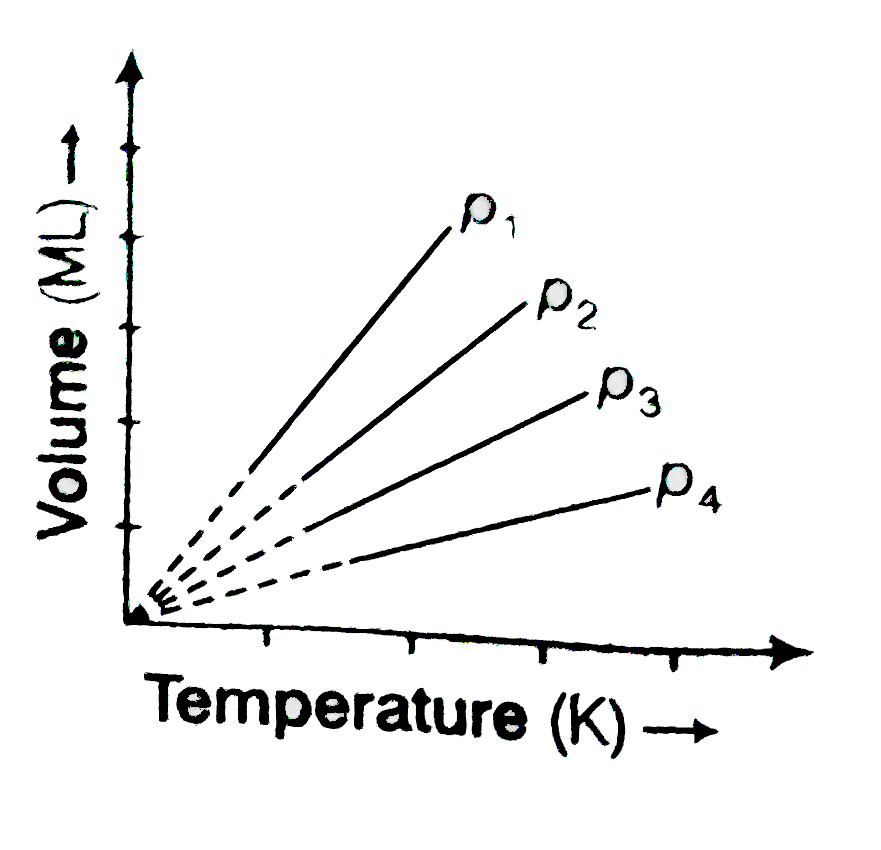
View SolutionA plot of volume (V) versus temperature (T) for a gas at constant pressure is a straight line passing through the origin. The plots at different values of pressure are shown in figure. Which of the following order of pressure is correct for this gas ?

View SolutionWhich one of the following plot will be a hyperbola at constant temperature ?
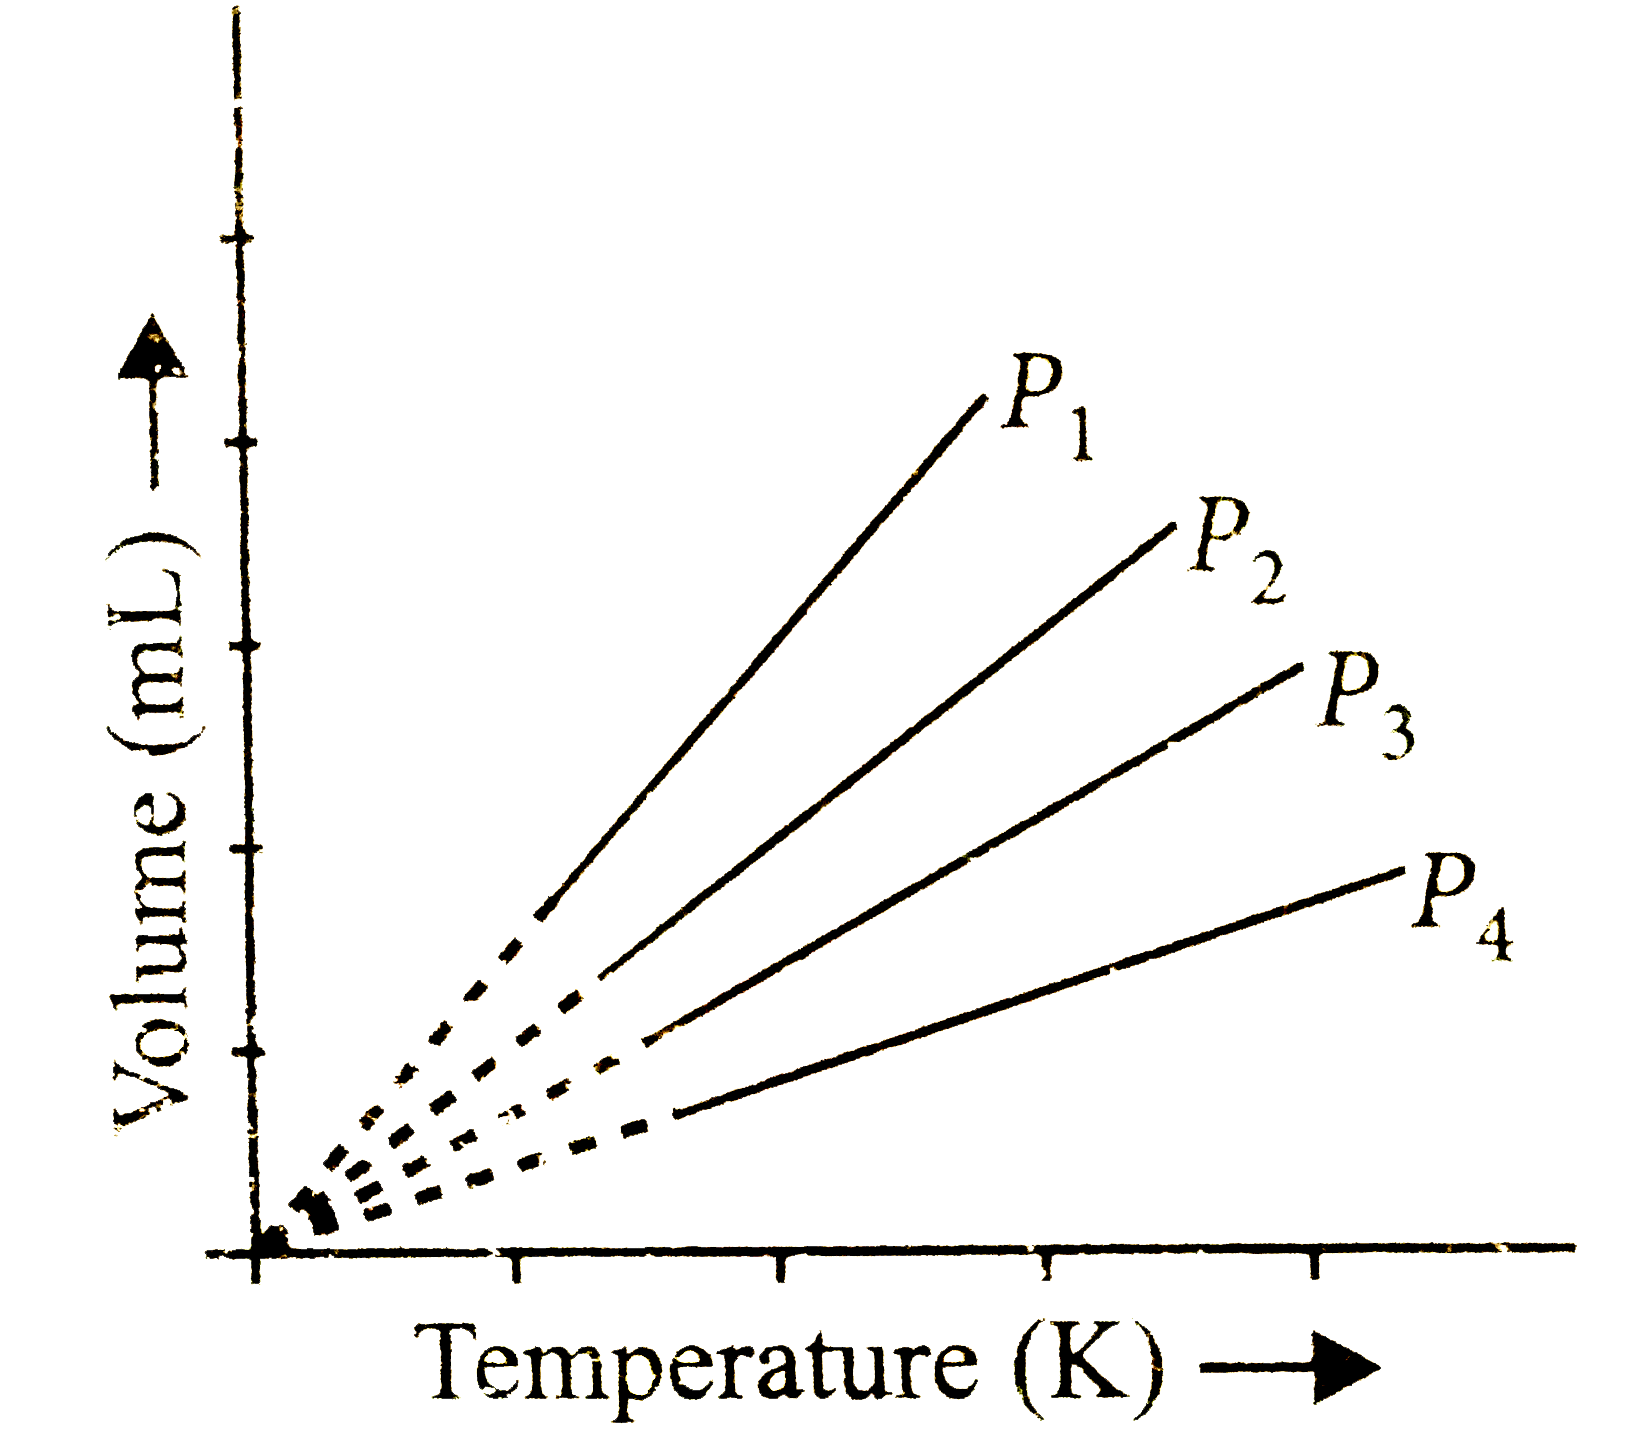
View SolutionA plot of volume (V) versus temperature (T) for a gas at constant pressure is a straight line passing through the origin . The plots at different values of pressure are shown in figure .
Which of the following order of pressure is correct for this gas ?

View SolutionFor a given mass of a gas what is the shape of (p) versus (1V) graph at constant temperature ?
View Solution
