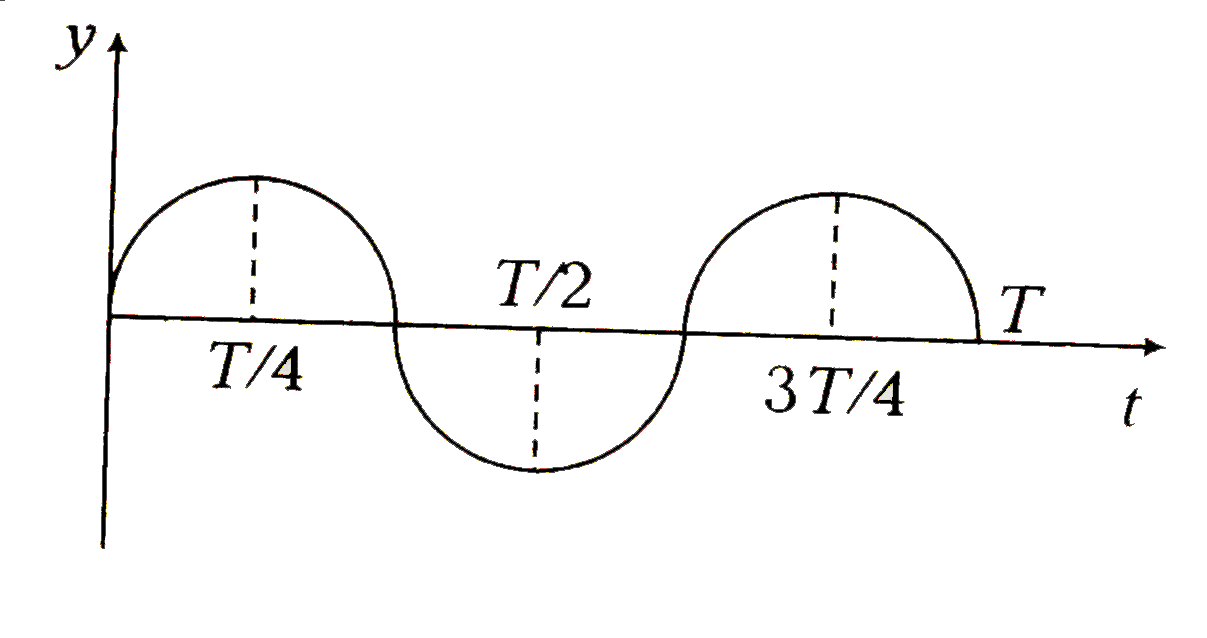
Draw graph showing the variation of displacement with time of a body executing (i) free oscillation (ii) damped oscillations.
To draw the graphs showing the variation of displacement with time for a body executing free oscillation and damped oscillation, follow these steps:
Step 1: Understand Free Oscillation
- Free oscillation occurs when a system oscillates without any external forces acting on it. The system oscillates at its natural frequency and maintains a constant amplitude.
Step 2: Draw the Graph for Free Oscillation
- On a graph, plot time (t) on the x-axis and displacement (x) on the y-axis.
- The graph will be a sine or cosine wave, indicating that the displacement varies sinusoidally with time. The amplitude remains constant throughout the oscillation.
Step 3: Understand Damped Oscillation
- Damped oscillation occurs when a system experiences a resistive force (like friction or air resistance) that causes the amplitude of the oscillation to decrease over time.
Step 4: Draw the Graph for Damped Oscillation
- On another graph, plot time (t) on the x-axis and displacement (x) on the y-axis.
- The graph will also start as a sine or cosine wave, but the amplitude will gradually decrease over time, indicating that the oscillation is losing energy. The wave will appear to decay exponentially.
Step 5: Label the Graphs
- Clearly label the graph for free oscillation as "Free Oscillation" and the graph for damped oscillation as "Damped Oscillation."
- Indicate the axes with "Time (t)" and "Displacement (x)" accordingly.
Final Graphs
- You should now have two graphs: one showing constant amplitude for free oscillation and another showing decreasing amplitude for damped oscillation.
- Free oscillation occurs when a system oscillates without any external forces acting on it. The system oscillates at its natural frequency and maintains a constant amplitude.
- On a graph, plot time (t) on the x-axis and displacement (x) on the y-axis.
- The graph will be a sine or cosine wave, indicating that the displacement varies sinusoidally with time. The amplitude remains constant throughout the oscillation.
- Damped oscillation occurs when a system experiences a resistive force (like friction or air resistance) that causes the amplitude of the oscillation to decrease over time.
- On another graph, plot time (t) on the x-axis and displacement (x) on the y-axis.
- The graph will also start as a sine or cosine wave, but the amplitude will gradually decrease over time, indicating that the oscillation is losing energy. The wave will appear to decay exponentially.
- Clearly label the graph for free oscillation as "Free Oscillation" and the graph for damped oscillation as "Damped Oscillation."
- Indicate the axes with "Time (t)" and "Displacement (x)" accordingly.
- You should now have two graphs: one showing constant amplitude for free oscillation and another showing decreasing amplitude for damped oscillation.
Topper's Solved these Questions
- OSCILLATIONS BOOK - ICSECHAPTER - OSCILLATIONS EXERCISE - VERY SHORT ANSWER QUESTIONS
13 Videos
- OSCILLATIONS BOOK - ICSECHAPTER - OSCILLATIONS EXERCISE - SELECTED PROBLEMS (FROM THE CHARACTERISTIC OF SHM)
14 Videos
- OSCILLATIONS BOOK - ICSECHAPTER - OSCILLATIONS EXERCISE - LONG ANSWER QUESTIONS
3 Videos
- MOTION IN FLUIDS BOOK - ICSECHAPTER - MOTION IN FLUIDS EXERCISE - SELECTED PROBLEMS (FROM POISEUILLE.S FORMULA)
19 Videos
- PROPERTIES OF MATTERBOOK - ICSECHAPTER - PROPERTIES OF MATTEREXERCISE - MODULE 4 ( TEMPERATURE ) UNSOLVED PROBLEMS
12 Videos
Similar Questions
Draw a graph showing the variation of decay rate with number of active nuclei.
View SolutionDraw the velocity-displacement graph of a body executing shm.
View SolutionDraw a graph between displacement from mean position and time for a body executing free vibration in a vacuum.
View SolutionDraw a graph between displacement and time for a body executing natural vibrations.
View SolutionDraw graphs to show the variation of amplitude with driving frequency of a forced harmonic oscillator under (i) zero damping, (ii) low damping and (iii) high damping
View SolutionThe graph shows the variation of displacement of a particle executing S.H.M with time. We inference form this graph that :-
_E01_037_Q01.png)
View SolutionThe graph shows the variation of displacement of a particle execting SHM with time . We infer from this graph that

View SolutionThe graph showing the variation of K.E. or P.E. with displacement of a harmonic oscillator is a parabola, but that of total energy with displacement is a straight line. Why?
View SolutionDraw a graph to show the variation of PE, KE and total energy of a simple harmonic oscillator with displacement.
View SolutionDraw the graph between displacement and
kinetic energy for a particle executing SHM.
View Solution